Pretty Williams FractalsThis script adds Williams Fractals that are more visually pleasing than TradingView's built-in version.
Bill Williams Indicators


PpSignal Inver Fisher WilliamsThe Inverse Fisher Transform (IFISH) was authored by John Ehlers. The IFISH applies some math functions and constants to a weighted moving average (wma) of the relative strength index (rsi) of the closing price to calculate its oscillator position. The user may change the input (close) and period lengths. This indicator’s definition is further expressed in the condensed code given in the calculation below.
www.motivewave.com


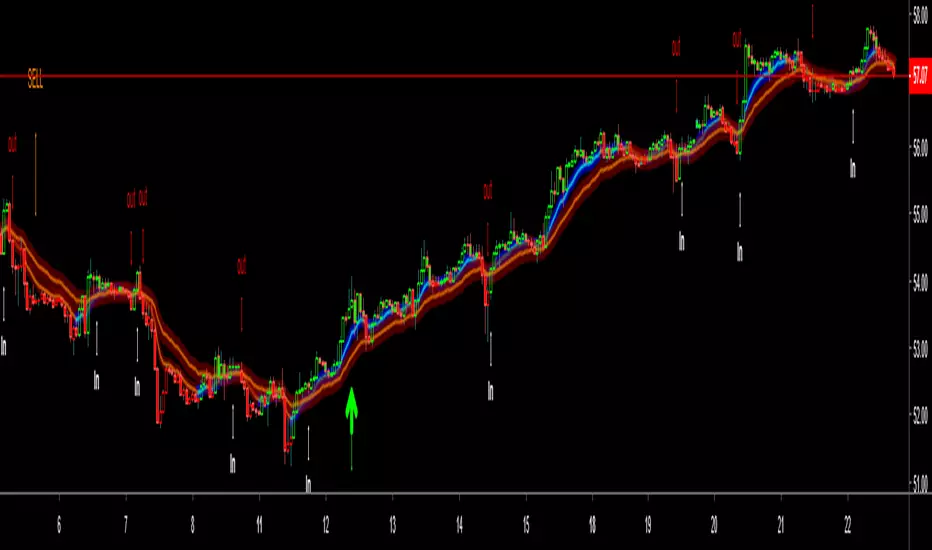
PpSignal ATR MA BandPpsignal Atr Move Average Band is my self development.
Trading:
- Buy when the price break out the upper band and W% is green.
- Sell when the price break out the lower band and W% is orange.

PpSignal Acceleration BandsAcceleration Bands
Description:
Adaptive bands that contain 95% of price action usually used in 20 or 80 bar periods. Trading signals occur when price action is confirmed outside the bands.
This indicator targets the top 5% of moves, keeping traders focused on the best trends.
The 20 Bar Acceleration Band Expert Advisor (SPX chart below) shows buy and sell signals based on my system. Notice
hat in the 14 months shown, the &P500 only exposed a signal 4 times, each was profitable. This depicts the 5% theory sell - Acceleration Bands highlight only the extreme moves for option traders. The issue many traders face is really two-fold; many traders want more signals and the entry point can use some refinement. Like the Yin & Yang relationship, I've developed a system that combines Acceleration bands with Williams' Percent R% to remove any weaknesses and refine trading signals. Let's take a look at how it works.
Willams' %R with two separate systems based on breakout and retest (lower risk entries) methods. We have smoothed out and modified Williams' Percent R to make it a better and more usable trading vehicle.
Description: Larry Williams created the Percent Range oscillator to highlight overbought versus oversold levels in securities. Traditionally overbought connotates a long exit or sell short entry as oversold would insinuate the opposite, however, we in general consider overbought to be bullish and oversold to be bearish. The Big Trends Percent R system targets the top 20th percentile and bottom 20th percentile.
Signal
Buy when the price breaks the upperline and W5 overblows.
Sell when the price breaks the lower band and W5 oversold
www.bigtrends.com

PpSignal Williams %R SmoothWe have smoothed out and modified Williams' Percent R to make it a better and more usable trading vehicle.
in blu you can see the smooth w%, yellow normal w%.


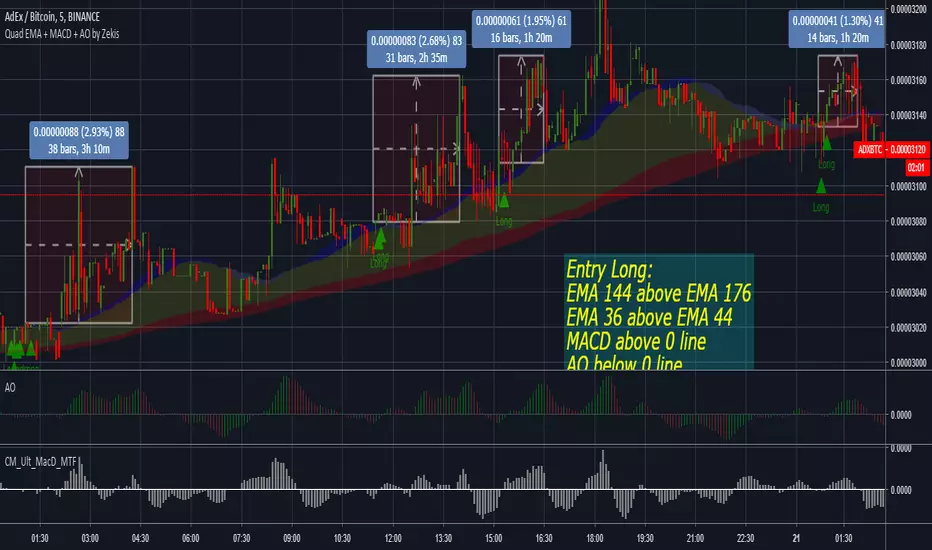
Quadruple EMA + MACD + Awesome Oscillator by ZekisThis strategy is based on quadruple EMAs, MACD and Awesome Oscillator, developed by Nenad Kerkez and simplified by me.
Scalping strategy (lower time frames)
Entry Position
Before we take a buy trade the two above criteria must be met. The 144 EMA must be above the 176 EMA and the 36 EMA must be above the 44 EMA. We then wait for AO to fall below the 0. The final „trigger‟ to the entry is when the MACD closes above the 0 line.
Sell trade is vice versa. 36 EMA must be below 44 EMA and 144 EMA must be below 176 EMA.
TAKE PROFIT and STOP LOSS
10-40 pips. Pivot Point targets.
STOP LOSS above/below last highest high
Enjoy!
@Zekis
DFR LineIt is a technical indicator, based and programmed of three indicators of mobile bands confirms and filters, the signals of purchase and sale to have a more effective operation
It works for all markets and ideal timing for novice and advanced traders.


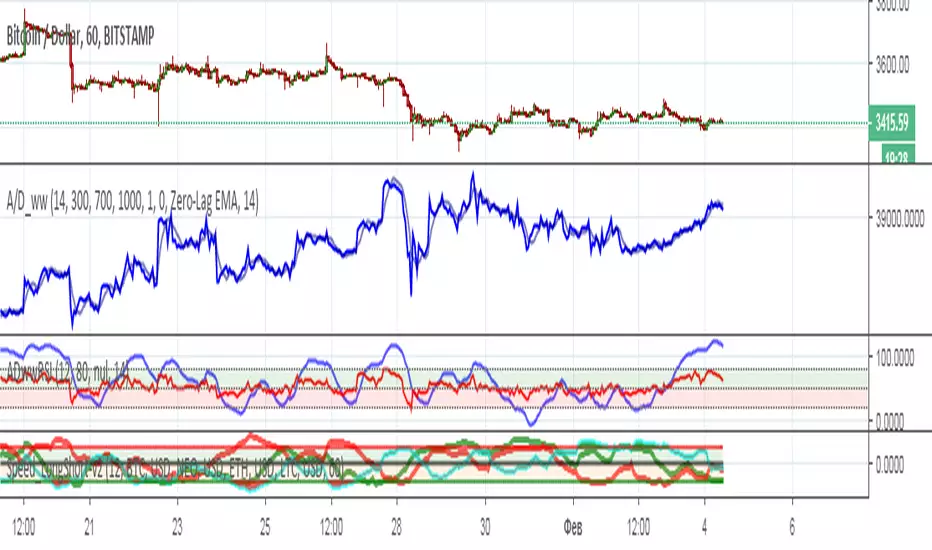
A/D Indicator[wozdux]+sum1 sum2 sum3Accumulation Distribution indicator (A / D) with additions. By default, the summation is performed for the entire historical period or for the period for which data are available on the Tradingwiev website . Added the ability to summarize for a given period (sum1, sum2,sum3).
--------
Accumulation Distribution индикатор (A/D) c дополнениями. По умолчанию суммирование производится за весь исторический период или за тот период, за который имеются данные на сайте Tradingwiev . Добавлена возможность суммировать за заданный период (sum1, sum2,sum3).
Wyckoff Trend Tracking Momentum IndicatorWyckoff Trend Tracking Momentum Indicator该指标结合量价,让您感受到来自市场的冷热。

Godmode 4.0.1 [Correlator]First off, a huge thank you to the following people:
@LEGION:
@LazyBear: www.tradingview.com
@xSilas: www.tradingview.com
@Ni6HTH4awK: www.tradingview.com
@sco77m4r7and:
@SNOW_CITY: www.tradingview.com
@oh92: www.tradingview.com
@alexgrover: www.tradingview.com
@cI8DH: www.tradingview.com
@DonovanWall: www.tradingview.com
This is my second iteration of Godmode. This time I allowed the possibility to correlate two benchmarks against one another, thereby giving you twice the signals (once there's a strong correlation between the two, inverse or otherwise). That aside, there are no changes to this indicator that the first iteration doesn't have:
There are still more iterations planned, but if you guys have any ideas or wishes regarding what direction I go, then please let me know.
Want to Learn?
If you'd like the opportunity to learn Pine but you have difficulty finding resources to guide you, take a look at this rudimentary list: docs.google.com
The list will be updated in the future as more people share the resources that have helped, or continue to help, them. Follow me on Twitter to keep up-to-date with the growing list of resources as well as any other scripts I publish.
Suggestions or Questions?
Don't even kinda hesitate to forward them to me. My (metaphorical) door is always open.

Godmode 4.0.0 [Oscillator]First off, a huge thank you to the following people:
LEGION:
LazyBear: www.tradingview.com
xSilas: www.tradingview.com
Ni6HTH4awK: www.tradingview.com
sco77m4r7and:
SNOW_CITY: www.tradingview.com
oh92: www.tradingview.com
alexgrover: www.tradingview.com
cI8DH: www.tradingview.com
DonovanWall: www.tradingview.com
Since I've been on TradingView I've become somewhat enthralled by Godmode and the collective work that goes in to it, so I decided to publish my own iteration, building off the ideas already present. (This is a great way to get familiar with Pine by the way, just in case there are any beginners reading this)
Changes
The first change I made was to allow the user to select whatever tickerid they wanted as a benchmark. If trading XBTUSD on BitMEX for example, the indicator will react to exchange-specific activity, which means it will respond to all the little whipsaws, whipsaws that can be especially present on a futures exchange. By typing CRYPTOCAP:BTC or CRYPTOCAP:TOTAL we endeavor to remove noise. It can also signal earlier. Less noise and less lag. Another idea would be to choose a benchmark that has a strong inverse relationship with the asset you're trading: try CRYPTOCAP:USDT as the benchmark against BTC to see what I mean.
I also added the ability to smooth the plot, yet again removing noise but adding considerable lag.
The linear regression of the wave-trend is calculated in place of the EMA. This is plotted as columns with the midline (50) as the base. This is just calculating the slope of the wave-trend and can signal a weakening trend before a reversal takes place.
Using cI8DH's True RSI script () as inspiration, I added a function for calculating the True TSI in an attempt to remove any bullish bias. Funnily enough, when I tried to do the same with the RSI I had some problems. I'll try to resolve this in the coming weeks.
Made slight changes to the aesthetics. Tried to bring the two main plots alive by making their bold, opaque colors stand off the subtle tones in the background.
To Do List
1. I would like to sort out the issue with the True RSI.
2. When the plots are smoothed, there's an issue with the green 'Caution!' dots appearing in the lower half of the indicator.
3. I'd like to adjust the code so that if the 'Benchmark' box is empty, that it will automatically register the current tickerid as the 'Benchmark'.
If anyone has any suggestions on other fixes or how to apply the fixes mentioned by me, please don't hesitate to reach out to me here or through other media platforms.
Want to Learn?
If you'd like the opportunity to learn Pine but you have difficulty finding resources to guide you, take a look at this rudimentary list: docs.google.com
The list will be updated in the future as more people share the resources that have helped, or continue to help, them. Follow me on Twitter to keep up-to-date with the growing list of resources.
Suggestions or Questions?
Don't even kinda hesitate to forward them to me. My (metaphorical) door is always open.
BITMEX:XBTUSD
CRYPTOCAP:BTC
CRYPTOCAP:TOTAL
CRYPTOCAP:USDT.D

SampleInvitePublish - V1
This strategy is designed for trading stocks and crypto currencies on the long side.
It uses three different timeframes to determine the most profitable entry prices (Day, 4 hour and chart interval).
The strategy employs ten different setups to accommodate both range trading and trend following markets.
The system contains sophisticated algorithms that scale to varies chart intervals.
Tailored to perform best between 4 hours to as low as 10 minutes.
The entire system consists of three tools: HullbusterScope, HullbusterBacktest and HullbusterSignal.
Hullbuster scope is used to obtain configuration information about the market instrument which will be applied to the HullbusterBacktest.
Commit an iterative approach to the backtest tool until the simulated results match your entry and exit expectations .
Apply the HullbusterSignal to the chart and use the same backtest configuration to setup actual trading alerts.

Swing PointsThis indicator gives a clear indication of price action swing-points as well as an indication of whether it is a higher, lower, or equal swing point relative to the last high/low.

Short Selling BITMEX Alts (15min scalp strategy)So this is a strategy i made for trading BITMEX alts on 15minute timeframe.
Works simply. You get sell signal when it is considered overbought and way too far from its mean -> the moving average. So you short it with that moving average as the target. Sometimes it goes lower, since the sell signal represents resistance area and average represents support and they act accordingly. Might break through, might bounce back to entry. So its safer to exit at support then pray on breakdown, its 15min strategy afterall.
There is no defined stop loss on this strategy. When i trade it i take risk/reward setup and my stop is calculated based on reward from entry to target. Usually its 1R or above that,usually i use price action for that purpose. if you trade it manually you have advantage, since signal gets confirmed on candle close, yet it could appear as soon as candle opens. So if you dont want any additional risks - wait for candle close and short it. If you want to gamble it - enter and average it up as it goes until you meet your risk limit.
Here is how it is inteded to be traded.
This strategy does not account for limit fees on bitmex, so it wouldnt be much practical to entry AND exit with market orders. As you can see in example, simple 1.5% move would lose 1/3 of its reward if you used market entry+exit.
This one works on :
TRX
EOS
LTC
BCH
ADA
All 15 minute timeframes. Plus it showes really good results in spot exachnges too, if you want to use as a tool to exit spot exposure (binance chart, same symbols).
Contact for free trial here or at twitter.com (i post full perfomance on all pairs there)
Also check this strategies performance on BCHH contract on bitmex. Absolute banger.

Oscillator Strategy for Scalping (BITMEX Swaps btc + eth)This is short selling strategy for BITMEX's XBTUSD and ETHUSD swaps scalping.
Made specifically for 3M XBTUSD and 3M-5M ETHUSD timeframe trading.
Not gonna open all the details, but it works mostly on bear divergences and moving averages.
On premium it shows 10000 bars back on 3minute timeframe and over that period(3 weeks aprox) XBTUSD had 28 trades and ETHUSD had 25(+17 on 5M timeframe) trades with that strategy.
How to trade it and setups that i use for manual trading:
1: You can use it to confirm your bias. Sell signal appears + price tries to retake previous resistance = most likely it will fail.
2. Sell signal after wick up suggests that you are likely to get filled at the top.
Your main target should be this moving average. Basically sell signal appears at resistance/near one and moving average represents current line of support. So when you enter short you should be eyeing this MA as your exit/target. Yes, there is a good possibility that support wount hold and this is a bear market we talking about BUT it is 3M bot oriented trading strategy, dont forget about and dont hold for too long to find yourself with price lending on MA and jumping from it.
This strategy does not have a defined stop, rather it suggests you to calculate it based on entry (provided) and target (provided).
Here is what i usually do to calculate my risks. My reward is a move to line of support, my stop is usually 1R, winrate is much higher than 50% so i feel good about it. Entry either at sell signal or at wick. Wicks not always get runned, but they provide incredible r/r setups.
Free trial for 36 hours for this one.

Oscillator Based Scalping (Forex Majors)This is a scalping strategy based on oscillator divergences.
Tested on ForexICE market data.
Signal might appear and disappear during candle making since it is based on Moving Average and therefore acts on close, but since candle closed signal is final and does not repaint.
1M timeframes is recommended for bot trading. 5M-15M is more suitable for manual trading.
Full list of tested intraday timeframes below:
EUR-USD - 1M-5M-15M
USD-JPY - 1M-5M
GBP-USD - 1M
AUD-USD - 1M-5M-15M
USD-CHF - 1M-15M
NZD-USD - 1M-5M-15M
USD-CAD - 1M-5M
There is 2 more similar trading strategies that im finishing now, 1 for BITMEX ETHUSD and XBTUSD contracts, and 1 for bitmex alts. Should be ready in a day or two.
Additional notes on executing trades:
-Trade should be entered as close to sell signal as possible. You can enter at market at red circle candle or at limit at top of sell signal candle. In both cases your target is red Moving Average and entering at market just makes overall R/R for a trade is lower yet limit order might not always get filled.
-This strategy doesnt have a defined stop loss by itself, but your target is a moving average and 1-1 risk reward should be enough. Although the win rate is much higher than 50% so you can be less greedy if you feel like playing it safer.
-Strategy itself uses pyramiding, so i would recommend averaging up if you get 2-3 consecutive sell signals above moving average.
-It is assumed that you have OANDA spread rates or better.
-- Free trial for 24 hours. Contact me here or at twitter.com --

Traderset Uni Renko - Awesome OscillatorThis is simply Bill Williams AO oscillator, fabricated with predefined numbers to better fit the Uni Renko charts and my methodology. The reason for publishing this version is that the original numbers (you can see them on the top instance of the oscillator) does not behave that much satisfactory when it comes to renko charting in my methodology !
The AO is not a part of my methodology nor Alligator, but i know some people who would like to have these two tools in renko charts. Here you have it.

SetMax Positions-BBAO3dirty coding right now so be patient and wait for updates and upgrades
cheers.
