Multi Time Frame Williams Alligator H1M5
fractalist scalpers and traders on 5 minute charts in the financial markets are often swamped by too many fractals; switching charts back and forth to do multi time frame analysis can be a headache too; so here's an indicator script coded by yours truly to make our lives easier.
how it works?
apply MTFWA on a 5 minute chart; sychronise it with your 1 hour chart; draw the standard horizontal line to mark fractals on your 1 hour chart...there you go; better fractals filtered to analyse your 5 minute chart; scalp your hearts out.
Bill Williams Indicators

Multi Time Frame Williams Alligator H1M5specifically for fractalist scalpers; apply H1 MTFWA on M5 chart.

Time Pattern IndicatorHigh Priority = Gold Diamonds
Medium Priority = Silver Circles
Leading Priority = Fuchsia Crosses


FILBFILBv3- Components:
1)
EMA 8 moves above 24: Candles Flip Green
EMA 8 moves Below 24: Candles Flip Pink
2)
Bull Div - Blue Candle
Bear Div - Red Candle
(On Mac D)
3)
Williams Fractals
Was designed on the 6 Hour Chart.
- Settings need to be adjusted:
Deslect the normal candles by right clicking the chart description in the top left and select "hide"
Hide the EMAs (i sometimes show the EMA 24) in the FILBFILB settings
Select the wick colour to grey in the FILBFILB settings
The Way i use this to:
- Use Stops based on Fractal points
- Enter Trades Long when flip Green Bear when flip Pink
- Hedge on Red Candles when in bull trend, unhedge when Blue (vica - versa in bear trend)

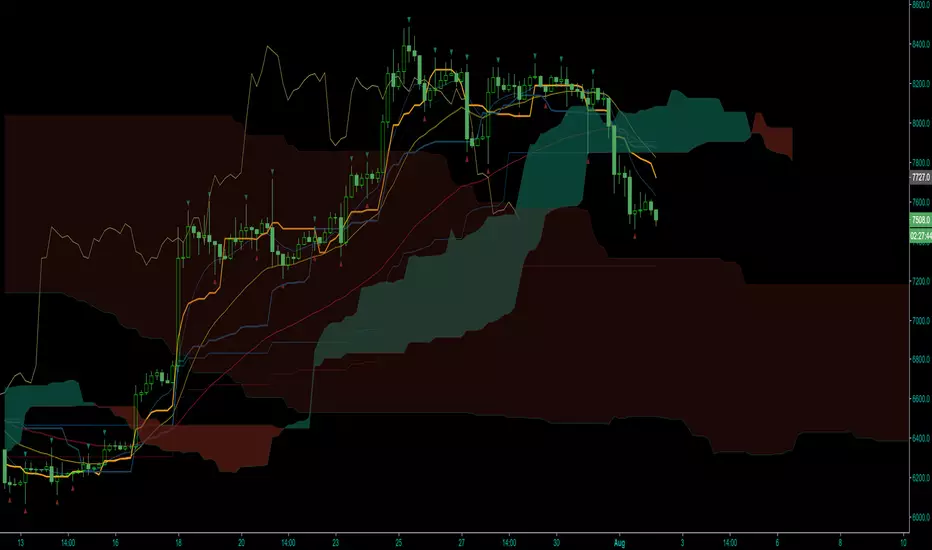
ULTIMATE ICHIMOKU TRADING SUITEThis is an update of "Uncle Mo's Ultimate Ichimoku V1"
Main features:
2 x Ichimoku Cloud
5 x EMA
2 x MA
1 x HullMA
Williams Fractal
Bollinger Bands - ***NEW***
ATR - ***NEW***
PSAR - ***NEW***
Candlestick Patterns - ***NEW***
Price Action Bars- ***NEW***
List of credits:
@br0qn for the Ichimoku
@RicardoSantos for the Bill Williams Fractal
@EmilianoMesa for the EMAs/MAs
@mohamed982 for the HullMA
@ymaheshreddy4u for the Bollinger Bands
@ChrisMoody for the Price Action Bars and PSAR
@HPotter for the ATR
@repo32 for the Candlestick Patterns
The script is open source and free to use. Feel free to change it around to suit your needs.
***If you copy & paste code from other traders to make your own script, please do remember to give them credit for their amazing work.***
Happy trading!

I AM Div3rgentIchimuko+MACD+William+CCi+Bollinger+4EMA,4SMA +ATR +pivot + strategy
When background is green William or cci or BOTH are under their boundaries (Good to Buy)
When background is red William or cci or BOTH are over their boundaries (Good to sell)
When Macd strategy tell u can buy
When it says close u can sell
Use ichimuko it is the best trend analyzer
U also can use EMA & SMA And ATR in option(touch Setting bottom)
,...
Hope u all EnJoY

Uncle Mo's Ultimate Ichimoku V1Main features:
2 x Ichimoku Cloud
5 x EMA
2 x MA
1 x HullMA
Williams Fractals
Study is based around trader @br0qn 's Ichimoku script.
Credits also go to:
@RicardoSantos for the Bill Williams Fractals
@EmilianoMesa for the EMAs/MAs
@mohamed982 for the HullMA
The script is open source so please feel free to change it around. I'd greatly appreciate it if you could suggest ways to improve it.
Happy trading!

2xIchimoku Cloud + 4xMA + Williams FractalUpdated version of the previously published multi-indicator which includes
4x Moving Averages
2x Ichimoku Clouds
Bill Williams Fractals
Changes:
-Toggle switches for each indicator on input tab for easy on/off
-MA Type Selector (EMA/SMA/WMA/VWMA)
-Various default style change
Many thanks to both redwraith and jedireza for helping me work out the MA section
www.tradingview.com
www.tradingview.com
Next improvements: Ichimoku settings

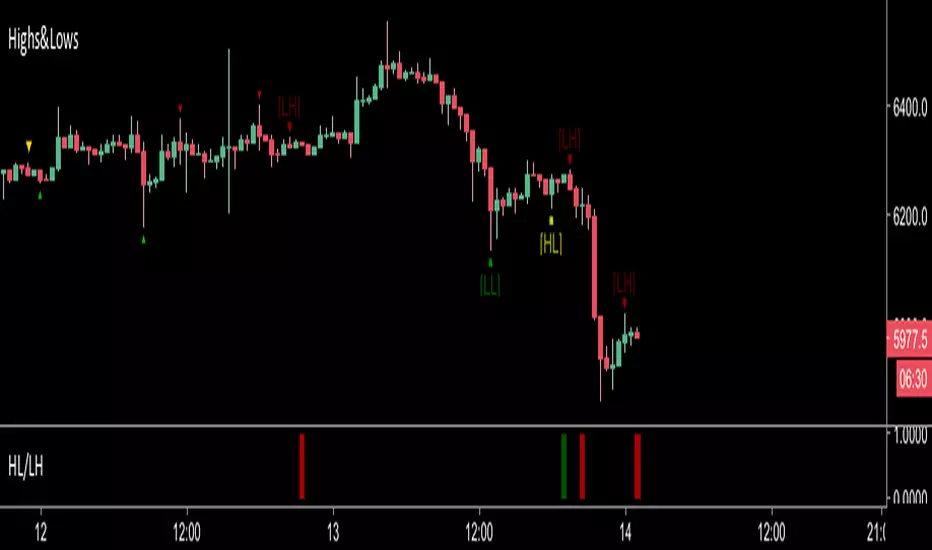
Highs&LowsShows Higher Highs, Higher Lows, Lower Lows & Lower Highs based off of Bill Williams fractals.
I use this mainly by shorting a break of the higher lows marked in yellow.
A long signal would be a candle close above a lower high (less reliable)
Alerts can be set with the secondary indicator below the chart.
Higher Lows / Lower Highs Alerts -https://www.tradingview.com/script/Ka1yXqRj-Higher-Lows-Lower-Highs-Alerts/
Merykatoji Strategy on SPX500 USIdea from Moving average + William Fractal + ATR
This script is backtested from 01/01/2017 till now with a profit of 0.57% and loss of 0.56%.
The strategy is running in real-time on the hourly chart
Explanation
Green-dot: Price of take profit
Purple-dot: Price of stop loss
==> Help you be a tiny bit more discipline :D
Possible leverage ( if you are risky as me) = 1 :1 - 1:50
At the time posting there is a long signal coming up
Want to understand more ??? feel free to give me a message or comment directly below
I also wrote the same strategy for other 15 pairs of fx :) give me a like and ill start posting more :'O
Happy trading => M E R Y K A T O J I

Stoch_Williams_RSI[wozdux]2Strategy. The indicator gives buy and sell signals based on two or three indicators.
Alert 2 is the signal from the two indicators is the Stochastic + Williams. Alert 3 signal from three Stochastic + Williams+ RSI indicators is simple. The Alert4 signal from the three Stochastic + Williams+MTF indicators is simple. Alert5 signal from three Stochastic + Williams+ RSI-2 indicators smoothed.
Settings.
""alert 2 show" - show signal button
""alert 3 show" - show signal button
""alert 4 show" - show signal button
""alert 5 show" - show signal button
To use, you need to connect the "alert" by one of the "alert-2-3-4-5".
Стратегия. Индикатор дает сигналы на покупку и продажу на основе двух или трех индикаторов.
Alert2 это сигнал от двух индикаторов Stochastic + Williams. Alert3 сигнал от трех индикаторов Stochastic + Williams+ RSI простой. Alert4 сигнал от трех индикаторов Stochastic + Williams+MTF простой. Alert5 сигнал от трех индикаторов Stochastic + Williams+ RSI-2 сглаженный.
Настройки.
"alert2 show"- кнопка показать сигнал
"alert3 show"- кнопка показать сигнал
"alert4 show"- кнопка показать сигнал
"alert5 show"- кнопка показать сигнал
Чтобы воспользоваться, нужно подключить "оповещение" по одному из «alert-2-3-4-5».

Stoch_Williams_RSI[wozdux]Strategy. The indicator gives buy and sell signals based on two or three indicators.
Alert 2 is the signal from the two indicators is the Stochastic + Williams. Alert 3 signal from three Stochastic + Williams+ RSI indicators is simple. The Alert4 signal from the three Stochastic + Williams+MTF indicators is simple. Alert5 signal from three Stochastic + Williams+ RSI-2 indicators smoothed.
Settings.
""alert 2 show" - show signal button
""alert 3 show" - show signal button
""alert 4 show" - show signal button
""alert 5 show" - show signal button
To use, you need to connect the "alert" by one of the "alert-2-3-4-5".
Стратегия. Индикатор дает сигналы на покупку и продажу на основе двух или трех индикаторов.
Alert2 это сигнал от двух индикаторов Stochastic + Williams. Alert3 сигнал от трех индикаторов Stochastic + Williams+ RSI простой. Alert4 сигнал от трех индикаторов Stochastic + Williams+MTF простой. Alert5 сигнал от трех индикаторов Stochastic + Williams+ RSI-2 сглаженный.
Настройки.
"alert2 show"- кнопка показать сигнал
"alert3 show"- кнопка показать сигнал
"alert4 show"- кнопка показать сигнал
"alert5 show"- кнопка показать сигнал
Чтобы воспользоваться, нужно подключить "оповещение" по одному из «alert-2-3-4-5».


2xIchimoku Cloud + 4xEMA + Williams FractalCopy+Pasted/edited the code from :
Moku
www.tradingview.com
EMA
www.tradingview.com
Fractal
www.tradingview.com
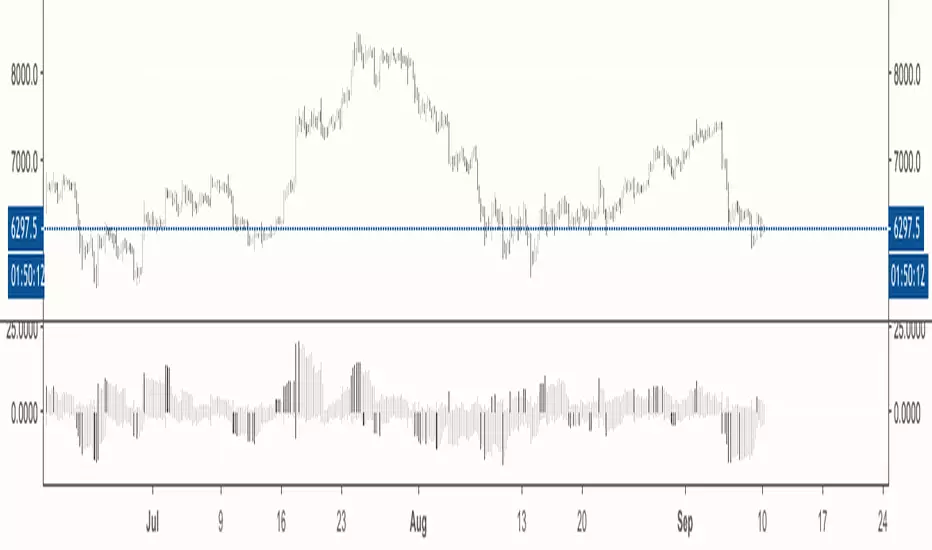
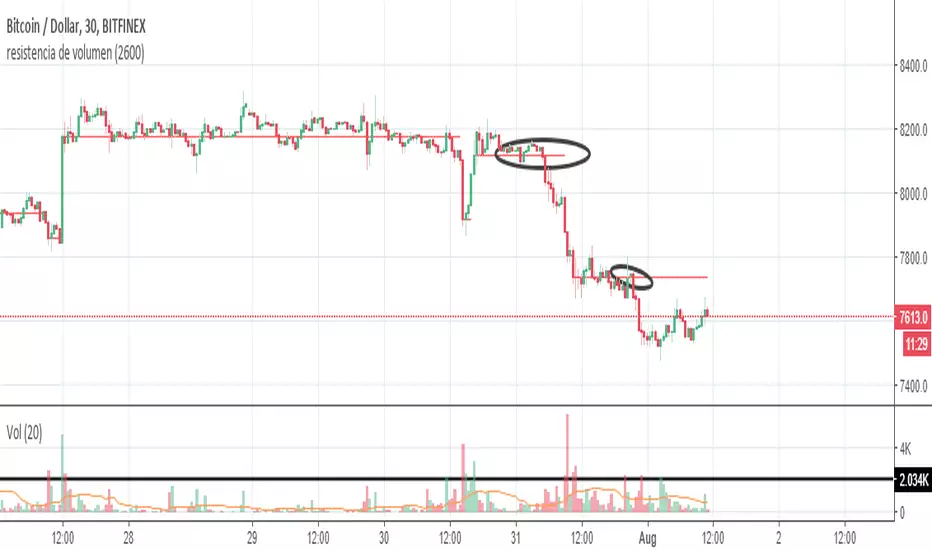
Resistance of VolumeIt is used to detect volume resistors in a personalized way, since it allows the user to enter the volume in which he wishes the resistance to jump automatically.
It does not mark the black line and the graphic that's just to help understand how it works
in the above image can see the indicator works on 30 minutes chart
in the above image can see the indicator works on 5 minutes chart
therefore, it can be configured to go through several temporalities.

BottomFinder Adv. Charts Suite V2.0With the advanced charts suite you get multiple indicators you can overlay on your charts, while only using one indicator slot. We made this after requests from our members, to assist those who use a free TV account. IT can take a minute or more to load... be patient! Its not advised to use them all at once, use them in combinations and see what works for you! I wanted to include more indicators, but hit some of the limits imposed by pine script. All options are off by default.
Included are:
Ichimoku Cloud
Support Resistance Fractal
Trailing Long/Short Stoploss
Bull Bear Squares
Triple Hull Moving Average
Standard Hull Moving Average
Fibonacci Daily
Advance Decline Lines
This indicator is available to all our members at no extra charge. If you would like access join us in the link from my signature. You can get a trial of our paid indicators and access to the free ones as well.
Please also like this indicator, and follow me on TradingView for access! We have many more great free indicators coming in the future!

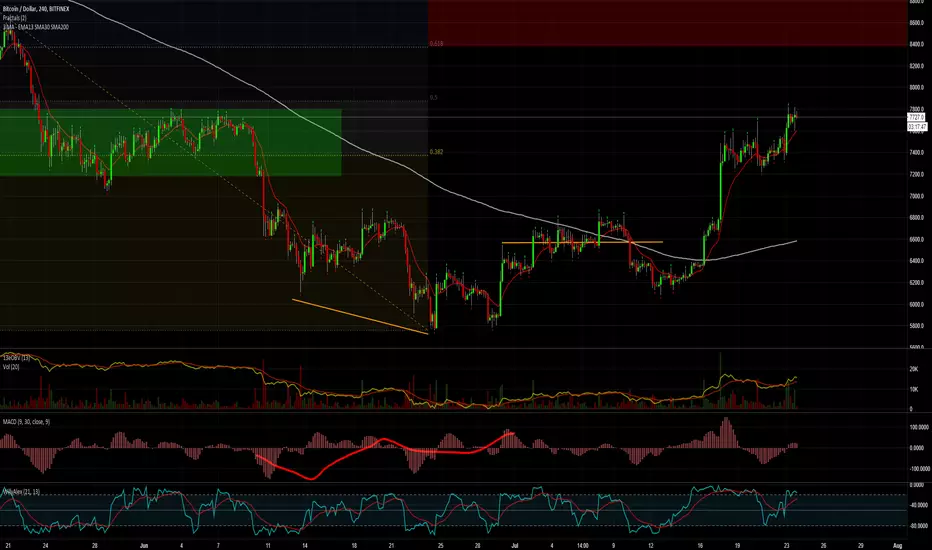
Willams %R with 13 EMA and middle pointWillams %R with 13 EMA and middle point. It also uses the textbook formula instead of the Tradingview one.

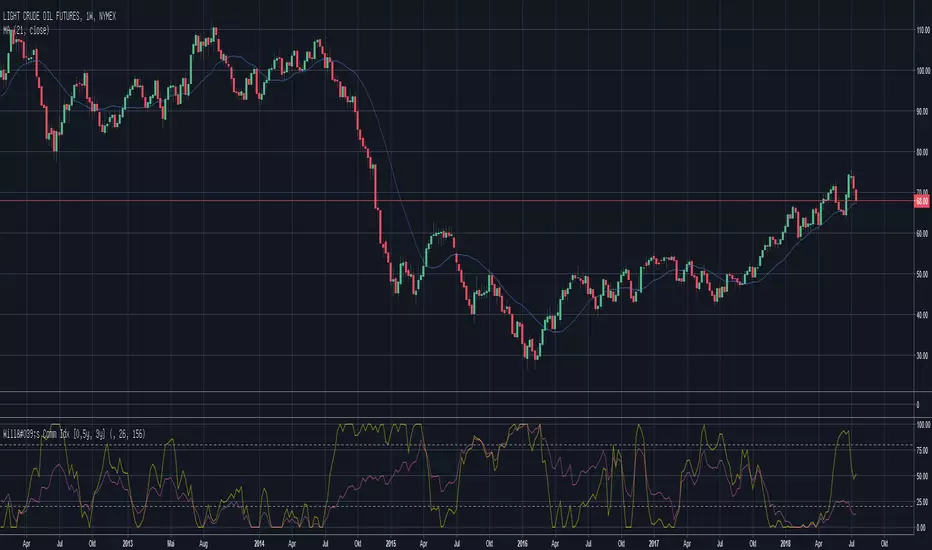
William's Commercial Index (0.5y, 3y)William's Commercial Index from Greeny with look at 0.5 year and 3 years.
TPA Price&Volume Index(8/8).This indicator is based on both trading volume and price volatility . We also consider variables depending on whether the virtual currency is light or heavy.
Intuitive and easy to use.
There are a total of eight indicators from 1 to 8 since it is the object of all the binance.
You need to change the settings for each time series.
At present, I set it freely in the 5 minutes of writing, and it is easy to write.
If the sensitivity setting is high, it will be very sensitive, but in order to take the "trend" element, please do not set the value of the setting too high.
We will continue to update additional stocks in the event of a listing of listed stocks in the future.
Indicators are open to specific subscribers. Thank you.
이 지표는 거래량과 가격변동성 두가지를 기반으로 한 지표입니다. 또한 해당 가상화폐가 가볍냐 무겁냐에 따른 변수까지 고려되어있습니다.
직관적이고 사용하기쉽습니다.
바이낸스 전 종목 대상이기에 1~8번 총 8개의 지표가 있습니다.
각 시계열 별로 세팅을 바꿔야 합니다.
현재는 5분봉에 쓰기 편하게 제 임의로 세팅해놨습니다.
민감도설정이 높다면 정말 민감하게 나타내겟지만 "추세"라는 요소를 가져가기위해서는 해당 설정의 값을 너무 높게하지 마시기바랍니다.
추후 바이낸스 상장종목이 생길시 지속적으로 종목추가업데이트를 할 예정입니다.
지표는 특정구독자들에게 공개됩니다. 감사합니다.
