RSI Phan Ky FullThe RSI divergence indicator is like a magnifying glass that spots gaps between price swings and momentum. When price keeps climbing but RSI quietly sags, it’s a flashing U‑turn sign: the bulls are winded, and the bears are lacing up their boots. Flip it around—price is sliding yet RSI edges higher—and you’ve got bulls secretly stockpiling. Hidden divergences shore up the trend; regular divergences hint at a pivot. Blend those signals with overbought/oversold zones, support‑resistance, and volume, and RSI divergence turns into a radar that helps traders jump in with swagger and bail out just in time.
Bill Williams Indicators

Delta AO + Regular AO (Normalized)🔀 Delta AO + Regular AO (Normalized) – Visualizing Market moods becomes simpler 🔀
🧠 Introduction
The Delta AO + Regular AO (Normalized) is a custom oscillator that fuses the power of classic momentum analysis with volume-derived delta flow to give traders a dual-perspective edge.
This tool was born from a need to better visualize internal market thrust (via delta) while still respecting the time-tested signal power of the traditional Awesome Oscillator (AO).
🔍 What makes it unique?
✅ Volume-based Delta Calculation – Models upward/downward delta using a custom volatility-weighted volume allocation method, not simple tick-delta or raw buys/sells.
✅ Cumulative Delta Candles – Instead of just plotting bars, the indicator rebuilds the market structure using cumulative delta logic.
✅ Dual AO Display – Shows both custom delta AO and traditional price AO simultaneously.
✅ Normalized Scaling – Each AO is independently normalized by its standard deviation (volatility-adjusted), making both indicators visually comparable without distortion.
🧮 Under the Hood
Let’s break down the components:
1. Delta Logic 📊
Rather than using raw delta or tick-level data, this script simulates net effort:
Delta Up = Volume × a smart weighting when the candle is bullish
Delta Down = Volume × weighting when the candle is bearish
The weighting dynamically adjusts based on candle body-to-wick ratio. This provides a more refined delta estimate based on candle structure.
This delta is accumulated (cumulative delta) and used to form a synthetic OHLC candle structure.
2. AO Calculations ⚖️
Custom AO: Calculated from the median of synthetic delta candles
Regular AO: Classic (median price 5-period SMA - 34-period SMA)
Both are normalized using their own 34-bar standard deviation, improving comparability and visualization in one pane.
3. Color Coding 🎨
For the delta AO histogram:
Lime: Bullish + Increasing Momentum
Green: Bullish + Weakening Momentum
Red: Bearish + Increasing Momentum (to the downside)
Maroon: Bearish + Weakening Momentum
This lets you immediately spot momentum shifts and strength behind volume-based moves.
📈 How to Use – Trading Guide
🔧 Recommended Setup:
Timeframe: Works well on all intraday and higher timeframes (5m–1D)
Symbol: Especially effective on liquid instruments (futures, indices, large caps)
✅ Entry Signals
🔹 Buy Setup
Delta AO turns green or lime above zero, and Regular AO is also rising
Ideal confirmation: Lime bar (strong bullish delta momentum) and a crossover above zero
🔹 Sell Setup
Delta AO turns maroon or red below zero, and Regular AO is also falling
Ideal confirmation: Red bar (strong bearish delta momentum) and AO falling further below zero
🔄 Momentum Confirmation
Look for divergence between the Delta AO and Regular AO.
🔼 If Delta AO is rising but Regular AO is flat or falling → Volume is leading price (possible breakout ahead)
🔽 If Regular AO is strong but Delta AO fades → Price may be unsustainable (fakeout risk)
🛑 Exit / Reversal Clues
Sudden color shifts (e.g., Lime → Green → Maroon) can signal momentum exhaustion
Both AOs converging to zero suggests consolidation phase ahead
📌 Pro Tips
Use this with volume profile, support/resistance, or market structure zones for maximum confluence
Works great as a secondary confirmation tool for your existing strategy
💬 Final Thoughts
This oscillator is not just a pretty double AO — it's a strategic fusion of price and volume time-series designed to help you anticipate shifts before they’re obvious in price alone.
If you're looking for:
A modernized AO
Volume-integrated signal clarity
Normalized, noise-filtered momentum visual
Then this tool belongs in your chart arsenal.
📈 Try it. Test it. Pair it. If you find value, consider sharing or following for more next-gen indicators.
Please note this is an educational idea and past performance is not assurance of future performance.
Happy trading!
— @Pratik_4Clover

Current Fractal High/Low (Dynamic)
This indicator dynamically tracks the most recent confirmed Fractal High and Fractal Low across any timeframe using custom left/right bar configurations.
🔍 Key Features:
Detects Fractal Highs and Lows based on user-defined pivot settings.
Draws a green line and label ("FH") at the most recent Fractal High.
Draws a red line and label ("FL") at the most recent Fractal Low.
All lines extend from the confirmation bar to the current candle.
Automatically removes old lines and labels for a clean, uncluttered chart.
🛠️ Customizable Inputs:
Left & Right bars for pivot sensitivity
Line width for visibility
📌 Use Cases:
Identifying structure shifts
Recognizing key swing points
Supporting liquidity and breakout strategies
💡 Fractals are confirmed only after the full formation of the pattern (left and right bars). This ensures reliability over reactivity.
This script is designed for intraday to swing traders who want a reliable way to visualize market turning points with minimal noise.

RSI Run‑Length by ATTARSI Run‑Length by ATTA – The Next Generation of RSI
The RSI Run‑Length by ATTA indicator was developed to quantify not only the magnitude of price movements but also the continuity with which they occur. Instead of relying on point‑by‑point averages of gains and losses, it counts each sequence of consecutive gains (up‑run) and each sequence of consecutive losses (down‑run), applies Wilder’s RMA smoothing to these counts, and then computes the classic RSI formula on their ratio.
This approach significantly reduces market noise by giving greater weight to sustained trends, while simultaneously reducing the lag inherent in traditional methods. Rather than waiting for signals triggered by isolated fluctuations, RSI Run‑Length by ATTA detects turning points at the earliest stages of movement streaks and maintains precise, timely responsiveness.
Core Principles:
Run‑Length Counting: Measures trend depth without distortion from isolated spikes.
Wilder’s RMA on Counts: Provides statistical smoothing to suppress excessive volatility.
Classic RSI Formula: Applies the familiar RSI calculation to the smoothed run‑length ratio.
This mechanism enables early identification of momentum shifts and the construction of strategies based on stable sequences rather than sporadic gains. The simplicity of a single parameter (run‑length period – default 14) and the logical sequence of counting, smoothing, and ratio calculation make the tool both transparent and intuitive for technical traders and quantitative analysts alike.
Usage Instructions:
Select the run‑length period (commonly 14 bars).
Set overbought/oversold thresholds (recommended 70/30).
Overlay with complementary indicators (classic RSI, MACD, etc.) for confirmation.
I invite traders and analysts to incorporate RSI Run‑Length by ATTA into their indicator libraries to gain deeper, more actionable insights into price momentum.
Absorption Lines Basic Indicator:
Green support lines and red resistance lines will appear on your chart
Numbers 1-7 will show up as triangles above and below bars
Green triangles below bars are sell signals
Red triangles above bars are buy signals
For Scanning:
In TradingView's Stock Screener, add a custom filter using this indicator
Look for "New Level", "Signal Number", or "Bar Close At Level" conditions
For specific signals, use "Buy Signal X" or "Sell Signal X" (where X is 1-7)
For Alerts:
Set up alerts using the three alert conditions in TradingView
You'll be notified when new lines are printed, when bars close at levels, or when signals appear

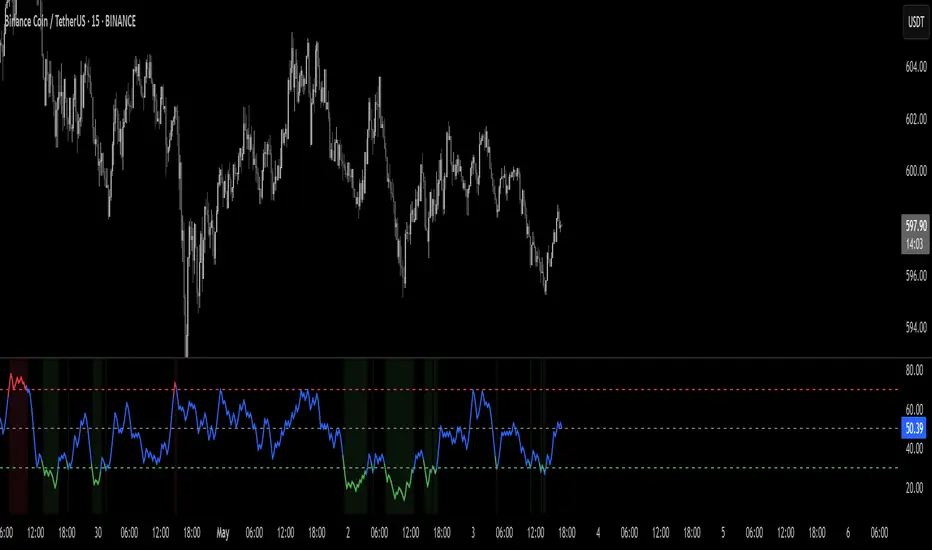
Williams R Zone Scalper v1.0[BullByte]Originality & Usefulness
Unlike standard Williams R cross-over scripts, this strategy layers five dynamic filters—moving-average trend, Supertrend, Choppiness Index, Bollinger Band Width, and volume validation —and presents a real-time dashboard with equity, PnL, filter status, and key indicator values. No other public Pine script combines these elements with toggleable filters and a custom dashboard. In backtests (BTC/USD (Binance), 5 min, 24 Mar 2025 → 28 Apr 2025), adding these filters turned a –2.09 % standalone Williams R into a +5.05 % net winner while cutting maximum drawdown in half.
---
What This Script Does
- Monitors Williams R (length 14) for overbought/oversold reversals.
- Applies up to five dynamic filters to confirm trend strength and volatility direction:
- Moving average (SMA/EMA/WMA/HMA)
- Supertrend line
- Choppiness Index (CI)
- Bollinger Band Width (BBW)
- Volume vs. its 50-period MA
- Plots blue arrows for Long entries (R crosses above –80 + all filters green) and red arrows for Short entries (R crosses below –20 + all filters green).
- Optionally sets dynamic ATR-based stop-loss (1.5×ATR) and take-profit (2×ATR).
- Shows a dashboard box with current position, equity, PnL, filter status, and real-time Williams R / MA/volume values.
---
Backtest Summary (BTC/USD(Binance), 5 min, 24 Mar 2025 → 28 Apr 2025)
• Total P&L : +50.70 USD (+5.05 %)
• Max Drawdown : 31.93 USD (3.11 %)
• Total Trades : 198
• Win Rate : 55.05 % (109/89)
• Profit Factor : 1.288
• Commission : 0.01 % per trade
• Slippage : 0 ticks
Even in choppy March–April, this multi-filter approach nets +5 % with a robust risk profile, compared to –2.09 % and higher drawdown for Williams R alone.
---
Williams R Alone vs. Multi-Filter Version
• Total P&L :
– Williams R alone → –20.83 USD (–2.09 %)
– Multi-Filter → +50.70 USD (+5.05 %)
• Max Drawdown :
– Williams R alone → 62.13 USD (6.00 %)
– Multi-Filter → 31.93 USD (3.11 %)
• Total Trades : 543 vs. 198
• Win Rate : 60.22 % vs. 55.05 %
• Profit Factor : 0.943 vs. 1.288
---
Inputs & What They Control
- wrLen (14): Williams R look-back
- maType (EMA): Trend filter type (SMA, EMA, WMA, HMA)
- maLen (20): Moving-average period
- useChop (true): Toggle Choppiness Index filter
- ciLen (12): CI look-back length
- chopThr (38.2): CI threshold (below = trending)
- useVol (true): Toggle volume-above-average filter
- volMaLen (50): Volume MA period
- useBBW (false): Toggle Bollinger Band Width filter
- bbwMaLen (50): BBW MA period
- useST (false): Toggle Supertrend filter
- stAtrLen (10): Supertrend ATR length
- stFactor (3.0): Supertrend multiplier
- useSL (false): Toggle ATR-based SL/TP
- atrLen (14): ATR period for SL/TP
- slMult (1.5): SL = slMult × ATR
- tpMult (2.0): TP = tpMult × ATR
---
How to Read the Chart
- Blue arrow (Long): Williams R crosses above –80 + all enabled filters green
- Red arrow (Short) : Williams R crosses below –20 + all filters green
- Dashboard box:
- Top : position and equity
- Next : cumulative PnL in USD & %
- Middle : green/white dots for each filter (green=passing, white=disabled)
- Bottom : Williams R, MA, and volume current values
---
Usage Tips
- Add the script : Indicators → My Scripts → Williams R Zone Scalper v1.0 → Add to BTC/USD chart on 5 min.
- Defaults : Optimized for BTC/USD.
- Forex majors : Raise `chopThr` to ~42.
- Stocks/high-beta : Enable `useBBW`.
- Enable SL/TP : Toggle `useSL`; stop-loss = 1.5×ATR, take-profit = 2×ATR apply automatically.
---
Common Questions
- * Why not trade every Williams R reversal?*
Raw Williams R whipsaws in sideways markets. Choppiness and volume filters reduce false entries.
- *Can I use on 1 min or 15 min?*
Yes—adjust ATR length or thresholds accordingly. Defaults target 5 min scalping.
- *What if all filters are on?*
Fewer arrows, higher-quality signals. Expect ~10 % boost in average win size.
---
Disclaimer & License
Trading carries risk of loss. Use this script “as is” under the Mozilla Public License 2.0 (mozilla.org). Always backtest, paper-trade, and adjust risk settings to your own profile.
---
Credits & References
- Pine Script v6, using TradingView’s built-in `ta.supertrend()`.
- TradingView House Rules: www.tradingview.com
Goodluck!
BullByte

Overnight ES Strategy: CBC + Fractal + RSI + ATR FilterThis script is designed for overnight trading of the E-mini S&P 500 futures (ES) between 6 PM and 11 PM EST.
It combines multiple technical confluences to generate high-probability buy and sell signals, focusing on volatility-rich, low-liquidity evening sessions.
Key Features:
Candle Body Confluence (CBC) Approximation:
Identifies candles with small real bodies compared to total range, simulating consolidation zones where price is likely to reverse.
Williams Fractal Confirmation:
Detects local tops and bottoms based on 5-bar fractal reversal patterns, helping validate breakout or reversal points.
RSI Filter:
Ensures momentum is supportive — buys only when RSI < 35 (oversold) and sells only when RSI > 65 (overbought).
ATR Volatility Filter:
Trades are only allowed if the Average True Range (ATR) exceeds a user-defined threshold, filtering out low-volatility, risky environments.
Time Session Control:
Signals are only generated during the user-defined evening session (default: 6 PM to 11 PM EST) to match market behavior.
Real-Time Alerts Enabled:
Alerts can be set for BUY or SELL conditions, enabling mobile notifications, emails, or pop-ups without constant chart monitoring.
Recommended Settings:
Chart Timeframe: 15-minute or 30-minute candles
Assets: ES Mini (ES1!), NQ Mini, or other CME futures
Session: New York Time (EST)
ATR Threshold: Adjust based on market conditions; 5.0 suggested starting point for ES Mini on 15m.
Important:
This script only plots signals, it does not auto-execute trades.
Always backtest and paper trade before using live capital.
Volatility can vary; consider adjusting RSI and ATR filters based on market environment.
Credits:
Script designed based on confluence of price action, momentum, reversal structure, and volatility filtering principles used by professional traders.
Inspired by Candle Body Confluence (CBC) theory and Williams fractal techniques.

Williams Fractals Dynamic Horizontal LinesWilliams Fractals with Dynamic Horizontal Lines
Overview
This script identifies Williams Fractals (support and resistance points) on any chart and automatically draws horizontal lines at those fractal levels.
The lines extend right and disappear when price breaks them — giving a clean and real-time view of key support and resistance levels.
Features
Detects upward fractals (potential resistances).
Detects downward fractals (potential supports).
Draws horizontal lines at each fractal point.
Automatically deletes a line when:
Price closes above a resistance.
Price closes below a support.
Clean and lightweight — minimal performance impact.
Inputs
Setting Description Default
Periods (n) Number of candles on each side required to confirm a fractal (minimum 2). 2
How It Works
Fractal Detection:
An up fractal is confirmed when a candle has the highest high compared to its neighbors.
A down fractal is confirmed when a candle has the lowest low compared to its neighbors.
Custom logic supports different "ties" — not just strict greater-than or less-than comparisons.
Drawing Lines:
When an up fractal is detected → a red horizontal resistance line is drawn.
When a down fractal is detected → a green horizontal support line is drawn.
Lines are drawn starting at the fractal candle and extend right across the chart.
Dynamic Line Deletion:
Every new candle is checked:
If high > resistance line → delete that resistance line.
If low < support line → delete that support line.
Only unbroken lines are kept on the chart, providing live, updated support/resistance zones.
Visual Elements
Up Fractal: 🡅 Triangular marker (teal color) above the fractal candle.
Down Fractal: 🡇 Triangular marker (red color) below the fractal candle.
Resistance Line: Red horizontal line.
Support Line: Green horizontal line.
Technical Details
Version: Pine Script v6
Arrays Used:
To store and manage active lines (line arrays).
To track the price associated with each line (float arrays).
Error Handling:
Backward iteration is handled using a while loop instead of a for loop to comply with Pine Script restrictions.
Offset Handling:
Fractal markers are plotted with an offset of -n bars for visual alignment.
Possible Enhancements (Future Ideas)
Sensitivity Settings: Allow a small margin (buffer) to define breakouts.
Extend Options: Let users choose between extending "infinite" or "limited" bars.
Custom Alerts: Generate alerts when fractal levels are broken.
Multi-timeframe Support: Detect fractals from higher timeframes on lower timeframe charts.
Example Usage
Swing Trading:
Use the fractal lines to identify and react to key breakouts or breakdowns dynamically.
Intraday Trading:
Spot live support/resistance on smaller timeframes for quick trades.
Trend Reversal Spotting:
Notice when a major fractal level is broken, possibly indicating trend changes.
Example Visual — Williams Fractals Dynamic Lines
Price Chart View:
What This Diagram Shows:
▲ Up Fractals:
Form resistance lines.
Line extends until price breaks above it.
▼ Down Fractals:
Form support lines.
Line extends until price breaks below it.
Lines are removed from the chart as soon as broken.
📈 Real Chart Example
Here's a rough idea how it will look live on your TradingView chart:
Feature Visual
Up Fractal 🔺 Green triangle above bar
Resistance Line ➖ Horizontal red line across the chart
Down Fractal 🔻 Red triangle below bar
Support Line ➖ Horizontal green line across the chart
Line Break 🚫 Line disappears when price crosses
GCM Supreme Trading System Pro (With Golden Zone)Okay, bro! Here are some notes on your "GCM Supreme Trading System Pro (Dashboard + RSI)" indicator based on the Pine Script code you provided. Think of this as a breakdown of its components, logic, and how you might use it, along with some things to consider.
GCM Supreme Trading System Pro (Dashboard + RSI) - Notes
Overall Concept:
This indicator aims to provide an "all-in-one" visual dashboard and signal system by combining several technical analysis concepts:
Short-Term Trend: Using a fast EMA.
Volatility/Channel: High/Low plot with fill.
Sentiment: Background color based on price vs. EMA.
Price Structure/Pattern: Highlighting potential AMD phases.
Key Price Level: Previous day's specific Fibonacci zone (Golden Zone).
Momentum: RSI Overbought/Oversold status.
Volume Analysis: Identifying volume spikes.
Risk Assessment: Based on ATR volatility.
Signal Generation: Based on EMA direction change confirmed by candle color.
Centralized Summary: A dashboard showing the status of key components.
Key Components & How They Work:
Trend EMA (Length: 3 by default):
What: A very fast Exponential Moving Average of the specified source (close by default).
How: Plots the EMA line. Colors the line green if the EMA is moving up, red if moving down, gray if flat.
Usage: Provides a very quick view of the immediate price direction and momentum.
High/Low Channel Lines & Fill:
What: Plots the current bar's high and low.
How: The area between the high and low is filled. The fill color changes based on whether the Trend EMA is moving up (green fill), down (red fill), or is neutral (gray fill).
Usage: Visualizes the recent price range/volatility and ties it to the immediate trend direction.
Sentiment Background:
What: Colors the chart background.
How: Background is lightly colored green if the close is above the Trend EMA, and red if the close is below the Trend EMA.
Usage: Reinforces the current short-term bias based on price's position relative to the fast EMA.
AMD Pattern Candles:
What: Highlights specific candle patterns often associated with Accumulation, Manipulation, and Distribution phases.
How:
Accumulation (Aqua): Previous candle was Red, current candle is Green (Red -> Green).
Manipulation (Yellow): Previous candle was Green, current candle is Red (Green -> Red).
Distribution (Fuchsia): Two consecutive Red candles where the candle before the first Red was Not Red (Not Red -> Red -> Red).
Usage: Helps visually spot potential shifts in market behavior according to the AMD concept.
Previous Day's Fib Golden Zone (0.55-0.66):
What: Calculates a specific Fibonacci zone (between 55% and 66%) based on the previous day's range (High-Low).
How: Plots a horizontal box on the chart covering the calculated zone level. Uses the previous day's range direction (Green/Red candle) to determine if the zone is calculated up from the low (Green day) or down from the high (Red day).
Usage: Identifies a potential key retracement or support/resistance zone from the previous day's price action that may be relevant for the current day.
RSI (Relative Strength Index):
What: A classic momentum oscillator.
How: Calculates the RSI value based on the specified length and source. The dashboard shows the current value and flags it as Overbought (> OB level), Oversold (< OS level), or Neutral.
Usage: Provides context on momentum extremes. High RSI suggests strong upward momentum (potentially overextended), low RSI suggests strong downward momentum (potentially oversold).
Volume Spike Confirmation:
What: Compares current volume to its Moving Average.
How: Calculates a simple moving average of volume. Identifies a "Spike" if the current volume is significantly higher (multiplied by a factor) than the MA.
Usage: Provides a contextual check for increased activity accompanying price moves. (Note: In the current script, this is calculated and shown on the dashboard but not directly used in the signal label logic, though it could be added).
Risk Assessment (ATR):
What: Uses the Average True Range.
How: Calculates the ATR for the specified length. Compares the current ATR to a longer-term average ATR. Flags "High Risk" if the current ATR is significantly higher than the average.
Usage: Gives an indication of current volatility relative to recent history, which can inform stop-loss placement or position sizing.
Signals (Buy/Sell Labels):
What: Plots "BUY" or "SELL" labels on the chart.
How:
BUY Signal: Triggers when the Trend EMA starts moving Up on the previous bar AND the current bar is Green (close > open).
SELL Signal: Triggers when the Trend EMA starts moving Down on the previous bar AND the current bar is Red (close < open).
Usage: These are your potential entry triggers. They indicate that the fast EMA trend has just changed direction and the current candle is confirming that move with its color.
Dashboard:
What: A 2x5 table displayed on the chart (bottom right by default).
How: Shows the current status of:
Trend (Bull/Bear/Neutral)
Volume (Spike/Normal)
Last Signal (🟢 BUY, 🔴 SELL, or None)
Risk (High/Normal based on ATR)
RSI (Overbought/Oversold/Neutral + Current Value)
Usage: Provides a quick, centralized summary of multiple indicator components without having to visually check every detail on the chart or separate panes.
How to Potentially Use It (Example Interpretation):
Look for a BUY signal (Green label) when:
The dashboard shows "🟢 BUY" as the Last Signal.
Consider additional confirmation: Is Volume status "Spike"? Is Risk "Normal"? Is RSI not "Overbought" (or perhaps just coming out of "Oversold" territory)? Is the price above/interacting positively with the Golden Zone?
Look for a SELL signal (Red label) when:
The dashboard shows "🔴 SELL" as the Last Signal.
Consider additional confirmation: Is Volume status "Spike"? Is Risk "Normal"? Is RSI not "Oversold" (or perhaps just coming out of "Overbought" territory)? Is the price below/interacting negatively with the Golden Zone?
Use the Sentiment Background and High/Low Channel Fill to quickly see the immediate trend and volatility context.
Watch AMD candles around key levels (like the Golden Zone or signal triggers) for potential pattern confirmation.
Check the Dashboard frequently for a summary of all these factors, even without a specific signal.
Strengths & Potential Benefits:
Comprehensive View: Integrates multiple popular trading concepts into a single indicator.
Visual Clarity: Uses colors, fills, labels, and a dashboard for easy interpretation.
Customizable: Inputs allow tuning the sensitivity of the EMA, Volume, ATR, and RSI to different assets/timeframes.
Dashboard Efficiency: Saves time by consolidating key status points.
Non-Repainting Signals: The buy/sell labels trigger and stay based on closed bar data.
Important Considerations & Limitations:
Fast EMA Sensitivity: An EMA length of 3 is very fast and prone to whipsaws, especially in choppy or ranging markets. Signals based solely on this could be frequent and unreliable in non-trending conditions.
Signal Logic: The core signal is only based on EMA direction change + candle color. While simple, it might miss opportunities or generate signals without broader market confirmation (like strong volume, favorable RSI position, or reaction at key levels). The dashboard provides these other factors as context, but they aren't required for the signal label in the current code.
Golden Zone Reliance: The previous day's Fib zone is just one potential level. It won't always be respected, and its relevance might vary significantly across different markets and timeframes.
AMD Patterns: The defined AMD patterns are specific. The market's "real" accumulation/manipulation/distribution might manifest in more complex ways.
Dashboard as Summary, Not Signal: Remember the dashboard shows the current status of all components on the last bar, but the BUY/SELL signal labels are based on a specific historical event (previous bar's EMA turn). You need to look at both: the label for the trigger, and the dashboard for the confluence of other factors right now.
Not a Standalone System: While called a "Trading System," no single indicator guarantees profitability. This tool provides signals and context, but requires a robust trading plan including stop losses, profit targets, position sizing, and potentially confluence with other analysis methods.
Timeframe Dependency: The ideal settings (EMA length, RSI length, etc.) will likely differ significantly between timeframes (e.g., 1-minute vs. 4-hour). Testing and optimization are crucial.
In Summary:
The "GCM Supreme Trading System Pro (Dashboard + RSI)" is a well-designed indicator that consolidates several useful analysis tools into a single view. Its strength lies in providing quick visual context and a clear signal trigger based on short-term trend shifts. However, like any indicator, it's not perfect. Its effectiveness will largely depend on the market conditions, the chosen settings, and how it's integrated into a comprehensive trading strategy, using the dashboard components as essential confirmation and risk assessment tools alongside the primary signal labels.

Scalp Strategy by Trade Journey📘 Trading Strategy: "Delta Flow Scalper"
Author: @Trad_journey
Type: Scalping / Intraday
Timeframes:
- Context: 1H
- Entry Points: 15m
---
🎯 Core Idea
We use a powerful tool — the Delta-RSI Oscillator (D-RSI), which calculates the derivative of RSI using polynomial regression. This oscillator doesn't just show the strength of price movement but reveals how that strength changes over time.
By combining this with order flow analysis on the 1H timeframe, we can spot reversals and momentum bursts within a prevailing trend, where the D-RSI is most accurate.
---
🔍 Strategy Logic
1. Context (1H)
Before entering a trade on the 15m chart, we determine:
- The trend on 1H using candle structure, levels, EMAs, volume, VSA, and other methods.
- Example: If 1H shows a series of higher highs/lows and rising volume — it indicates an uptrend.
2. Entry Signals (15m)
Entry is based on the D-RSI, configured with manually optimized settings:
- RSI Length: 14
- Polynomial Order: 2
- Window Length: 14
- Signal EMA: 7
- RMSE Filtering: Enabled, e.g., with a 10% threshold
Entry Conditions (any of the following):
- Zero-Crossing: Oscillator crosses above zero (long) or below zero (short)
- Signal Line Cross: D-RSI crosses the signal EMA
- Direction Change: Oscillator was below zero and starts rising (long), or vice versa
3. Trade Filter
To improve accuracy:
- Polynomial Approximation Error Filter (RMSE) is used — this eliminates noisy signals.
- Ideally, confirm entries with a candlestick pattern or key level as well.
---
📈 Example of Entry Logic
1. On 1H: Clear uptrend, candles with long lower wicks, volume increasing
2. On 15m: D-RSI was below zero, sharply started rising and crossed the signal line from below
3. RMSE < 10% → signal confirmed
4. Enter long, place stop below local low + spread
5. Exit:
- On opposite D-RSI signal
- Or at a take profit (e.g., 1.5R or a key level)
---
⚙️ Settings
()
---
📊 Why It Works
- D-RSI captures momentum shifts and trend acceleration — these often occur before price changes.
- RMSE filtering removes false signals during chop or weak movement.
- Using a higher timeframe gives directional context — entries are made in the trend's direction, drastically increasing win probability.
---
🔔 Recommendations
- Don’t use without higher timeframe context — countertrend signals can be unprofitable.
- Best entries are after small pullbacks within a trend.
- You can add an ATR/volatility filter — to avoid signals in tight ranges.
---
✅ Conclusion
Delta Flow Scalper is a plug-and-play strategy for traders looking for precise intraday entries within larger moves. It's great for those wanting to reduce noise and trade smartly with momentum.
Try it on demo, tweak it to fit your style — and go for it!

FVG TheoryThe indicator is intended to facilitate trading with FVGs. It consists of 3 components:
1. Swings:
A swing is a 3-candle formation based on the Williams Fractal Indicator.
The interaction with the last swing is always displayed as a red line. This allows you to recognize the last interaction directly and draw conclusions about the further course of the price (sweep / break).
In addition, the closest fractal is always shown as a green line, which acts as a potential target.
2. FVGs:
FVGs are also known as Inbalance, it is a 3 candle formation where a gap is created in the market. The market often runs into this and reacts.
If the market reacts from an imbalance before it has reached the swing low in the bullish case, the next FVG appears in a different color.
This formation has more power and is therefore color-coded.
If the FVG is particularly strong, measured by the fact that the 3rd candle in the formation breaks the 2nd candle with a candle body, this is marked with a small arrow in the FVG (break away gap).
3. overlapping
If there is a structure point within an FVG (order block, significant swing), a line is drawn there.
These overlaps have a higher confluence than FVGs alone. The wick is preferred, but if there is no overlap, the body of the structure is used.
The line thickness and colors are individually adjustable.

Key Financial index**Basic Indicators** (updates may be delayed by a few weeks after dividend distribution):
1. **P/E Ratio**: *Price-to-Earnings*. This ratio shows the price investors are willing to pay for each unit of profit the company generates.
- A P/E below 8 is considered good, meaning the company yields a 12.5% annual profit, which implies a payback period of 8 years.
2. **P/B Ratio**: *Price-to-Book Ratio*. This is used to compare a company's market value with its book value.
- A low P/B (usually below 1): May indicate that the stock is undervalued compared to the company’s net asset value. This can be a good investment opportunity but may also signal financial trouble.
- A high P/B (usually above 3): May suggest the stock is overvalued relative to the company’s net assets. This could reflect high growth expectations or potential overvaluation.
3. **D/E Ratio**: *Debt-to-Equity Ratio* is a financial metric that measures a company’s financial leverage.
D/E Ratio = Total Liabilities / Shareholders' Equity.
It compares the total liabilities of a company to its equity to indicate how much debt is used to finance its assets compared to shareholder investments.
- D/E Ratio below 1: Generally considered safe.
- D/E Ratio between 1 and 2: May be acceptable depending on the industry.
- D/E Ratio above 2: May indicate high financial risk.
4. **CR Ratio**: *Current Ratio*, an important liquidity metric used to assess a company’s ability to pay off short-term liabilities using its short-term assets.
- CR Ratio > 1: Indicates the company has enough current assets to pay off its short-term debts. The higher the ratio, the better the liquidity position.
- CR Ratio < 1: Suggests the company may face difficulties in meeting short-term obligations. This can be a red flag for financial stability.
5. **Profit Margin**: A key financial indicator that measures a company’s profitability relative to its revenue. It shows what percentage of revenue remains after all related costs are deducted.
**General significance of Profit Margin**:
- **Operational Efficiency**: A high profit margin indicates efficient cost management and the ability to generate strong profits from revenue.
- **Industry Comparison**: Comparing a company’s profit margin with its industry peers helps assess its competitive position and relative performance.
**Note**:
- There is no single “good” margin across all industries. Each industry has different cost structures and competition levels, leading to varying average margins.
- When analyzing profit margins, one must consider the industry context, the company’s business model, and market trends.
6. **Growth Expectation ↑**: This refers to the expected profit growth. The percentage figure reflects how much growth the market expects the company to achieve in the next financial report based on the current stock price.
- The lower the expected growth rate (typically below 15%), the safer the current price is considered.
- A high expected growth rate may indicate that the market anticipates a profit breakthrough or that the stock is trading above its intrinsic value relative to actual earnings.

Scalper's Fractal Cloud with RSI + VWAP + MACD (Fixed)Scalper’s Fractal Confluence Dashboard
1. Purpose of the Indicator
This TradingView indicator script provides a high-confluence setup for scalping and day trading. It blends momentum indicators (RSI, MACD), trend bias tools (EMA Cloud, VWAP), and structure (fractal swings, gap zones) to help confirm precise entries and exits.
2. Components of the Indicator
- EMA Cloud (50 & 200 EMA): Trend bias – green means bullish, red means bearish. Avoid longs under red cloud.
- VWAP: Institutional volume anchor. Ideal entries are pullbacks to VWAP in direction of trend.
- Gap Zones: Shows open-air zones (white space) where price can move fast. Used to anticipate momentum moves.
- ZigZag Swings: Marks structural pivots (highs/lows) – useful for stop placement and range anticipation.
- MACD Histogram: Shows bullish or bearish momentum via background color.
- RSI: Overbought (>70) or oversold (<30) warnings. Good for exits or countertrend reversion plays.
- EMA Spread Label: Quick view of momentum strength. Wide spread = strong trend.
3. Scalping Entry Checklist
Before entering a trade, confirm these conditions:
• • Bias: EMA cloud color supports trade direction
• • Price is above/below VWAP (confirming institutional flow)
• • MACD histogram matches direction (green for long, red for short)
• • RSI not at extreme (unless you’re fading trend)
• • If entering gap zone, expect fast move
• • Recent swing high/low nearby for target or stop
4. Risk & Sizing Guidelines
Risk 1–2% of account per trade. Place stop below recent swing low (for longs) or high (for shorts). Use fractional sizing near VWAP or white space zones for scalping reversals.
5. Daily Trade Journal Template
- Date:
- Ticker:
- Setup Type (VWAP pullback, Gap Break, EMA reversion):
- Entry Time:
- Bias (Green/Red Cloud):
- RSI Level / MACD Reading:
- Stop Loss:
- Target:
- Result (P/L):
- What I Did Well:
- What Needs Work:

Fractal Pattern AnalysisFractal Pattern Key Elements and How to Read Them
1. Williams Fractals (Triangle Markers)
Red Triangles Pointing Down: Bearish fractals - potential resistance points and selling opportunities
Green Triangles Pointing Up: Bullish fractals - potential support points and buying opportunities
When to Act: Look for bullish fractals forming during uptrends and bearish fractals during downtrends
2. Moving Averages
Yellow Line (20 EMA): Short-term trend
Blue Line (50 EMA): Medium-term trend
Red Line (200 EMA): Long-term trend
Interpretation: When shorter MAs cross above longer MAs, it's bullish; when they cross below, it's bearish
Key Signal: The alignment of all three MAs (stacked in order) confirms a strong trend
3. Background Color
Green Background: Uptrend (all MAs aligned bullishly)
Red Background: Downtrend (all MAs aligned bearishly)
Yellow Background: Sideways/neutral market (MAs not clearly aligned)
4. Market Structure Markers (Small Circles)
Green Circles: Higher highs and higher lows (bullish structure)
Red Circles: Lower highs and lower lows (bearish structure)
Pattern Recognition: Multiple green circles suggest continuing uptrend; multiple red circles suggest continuing downtrend
5. Reversal Diamonds ("Rev" Markers)
Yellow Diamonds: Potential trend reversal points
Usage: These mark where the current trend might be changing direction
Confirmation: Wait for price to close beyond the diamond before acting
6. Bollinger Bands (Blue Lines with Fill)
Middle Band: 20-period SMA
Upper/Lower Bands: Volatility channels
Signals: Price touching upper band in uptrend is strength; touching lower band in downtrend is weakness
Squeeze: When bands narrow, expect a volatility breakout soon
7. Status Table (Top Right)
Shows current trend, volume direction, and overall signal at a glance
"BUY" signal appears when multiple bullish conditions align
"SELL" signal appears when multiple bearish conditions align

Range Filter Buy and Sell 5min## **Enhanced Range Filter Strategy: A Comprehensive Overview**
### **1. Introduction**
The **Enhanced Range Filter Strategy** is a powerful technical trading system designed to identify high-probability trading opportunities while filtering out market noise. It utilizes **range-based trend filtering**, **momentum confirmation**, and **volatility-based risk management** to generate precise entry and exit signals. This strategy is particularly useful for traders who aim to capitalize on trend-following setups while avoiding choppy, ranging market conditions.
---
### **2. Key Components of the Strategy**
#### **A. Range Filter (Trend Determination)**
- The **Range Filter** smooths price fluctuations and helps identify clear trends.
- It calculates an **adjusted price range** based on a **sampling period** and a **multiplier**, ensuring a dynamic trend-following approach.
- **Uptrends:** When the current price is above the range filter and the trend is strengthening.
- **Downtrends:** When the price falls below the range filter and momentum confirms the move.
#### **B. RSI (Relative Strength Index) as Momentum Confirmation**
- RSI is used to **filter out weak trades** and prevent entries during overbought/oversold conditions.
- **Buy Signals:** RSI is above a certain threshold (e.g., 50) in an uptrend.
- **Sell Signals:** RSI is below a certain threshold (e.g., 50) in a downtrend.
#### **C. ADX (Average Directional Index) for Trend Strength Confirmation**
- ADX ensures that trades are only taken when the trend has **sufficient strength**.
- Avoids trading in low-volatility, ranging markets.
- **Threshold (e.g., 25):** Only trade when ADX is above this value, indicating a strong trend.
#### **D. ATR (Average True Range) for Risk Management**
- **Stop Loss (SL):** Placed **one ATR below** (for long trades) or **one ATR above** (for short trades).
- **Take Profit (TP):** Set at a **3:1 reward-to-risk ratio**, using ATR to determine realistic price targets.
- Ensures volatility-adjusted risk management.
---
### **3. Entry and Exit Conditions**
#### **📈 Buy (Long) Entry Conditions:**
1. **Price is above the Range Filter** → Indicates an uptrend.
2. **Upward trend strength is positive** (confirmed via trend counter).
3. **RSI is above the buy threshold** (e.g., 50, to confirm momentum).
4. **ADX confirms trend strength** (e.g., above 25).
5. **Volatility is supportive** (using ATR analysis).
#### **📉 Sell (Short) Entry Conditions:**
1. **Price is below the Range Filter** → Indicates a downtrend.
2. **Downward trend strength is positive** (confirmed via trend counter).
3. **RSI is below the sell threshold** (e.g., 50, to confirm momentum).
4. **ADX confirms trend strength** (e.g., above 25).
5. **Volatility is supportive** (using ATR analysis).
#### **🚪 Exit Conditions:**
- **Stop Loss (SL):**
- **Long Trades:** 1 ATR below entry price.
- **Short Trades:** 1 ATR above entry price.
- **Take Profit (TP):**
- Set at **3x the risk distance** to achieve a favorable risk-reward ratio.
- **Ranging Market Exit:**
- If ADX falls below the threshold, indicating a weakening trend.
---
### **4. Visualization & Alerts**
- **Colored range filter line** changes based on trend direction.
- **Buy and Sell signals** appear as labels on the chart.
- **Stop Loss and Take Profit levels** are plotted as dashed lines.
- **Gray background highlights ranging markets** where trading is avoided.
- **Alerts trigger on Buy, Sell, and Ranging Market conditions** for automation.
---
### **5. Advantages of the Enhanced Range Filter Strategy**
✅ **Trend-Following with Noise Reduction** → Helps avoid false signals by filtering out weak trends.
✅ **Momentum Confirmation with RSI & ADX** → Ensures that only strong, valid trades are executed.
✅ **Volatility-Based Risk Management** → ATR ensures adaptive stop loss and take profit placements.
✅ **Works on Multiple Timeframes** → Effective for day trading, swing trading, and scalping.
✅ **Visually Intuitive** → Clearly displays trade signals, SL/TP levels, and trend conditions.
---
### **6. Who Should Use This Strategy?**
✔ **Trend Traders** who want to enter trades with momentum confirmation.
✔ **Swing Traders** looking for medium-term opportunities with a solid risk-reward ratio.
✔ **Scalpers** who need precise entries and exits to minimize false signals.
✔ **Algorithmic Traders** using alerts for automated execution.
---
### **7. Conclusion**
The **Enhanced Range Filter Strategy** is a powerful trading tool that combines **trend-following techniques, momentum indicators, and risk management** into a structured, rule-based system. By leveraging **Range Filters, RSI, ADX, and ATR**, traders can improve trade accuracy, manage risk effectively, and filter out unfavorable market conditions.
This strategy is **ideal for traders looking for a systematic, disciplined approach** to capturing trends while **avoiding market noise and false breakouts**. 🚀

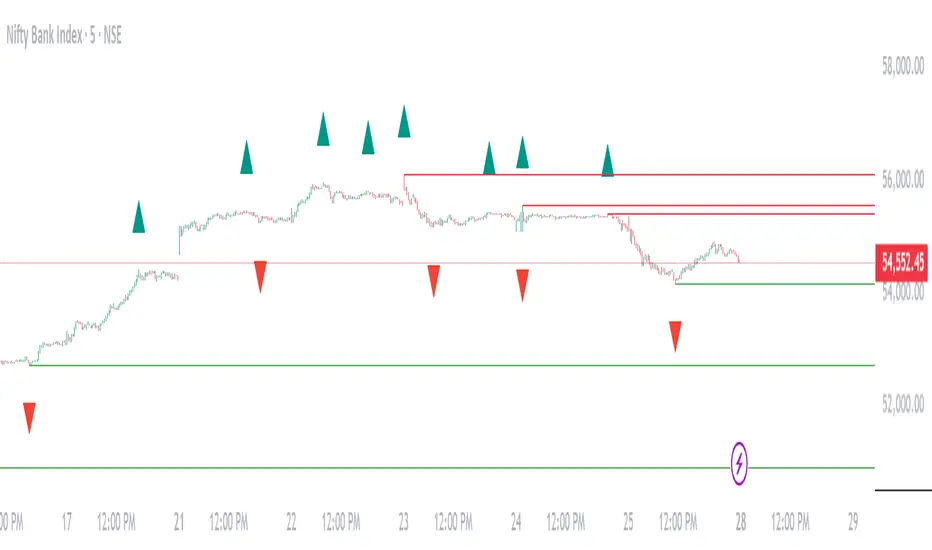
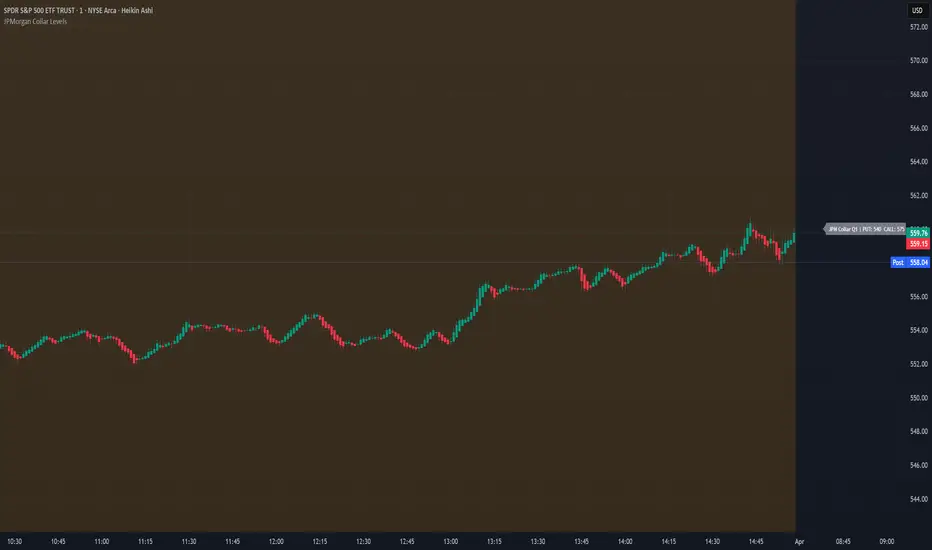
JPMorgan Collar LevelsJPMorgan Collar Levels – SPX/SPY Auto-Responsive (Quarterly Logic)
This script tracks the JPMorgan Hedged Equity Fund collar strategy, one of the most watched institutional positioning tools on SPX/SPY. The strategy rolls quarterly and often acts as a magnet or resistance/support zone for price.
[TABLE] Moving Average Stage Indicator Table📈 MA Stage Indicator Table
🧠 Overview:
This script analyzes market phases based on moving average (MA) crossovers, classifying them into 6 distinct stages and displaying statistical summaries for each.
🔍 Key Features:
• Classifies market condition into Stage 1 to Stage 6 based on the relationship between MA1 (short), MA2 (mid), and MA3 (long)
• Provides detailed stats for each stage:
• Average Duration
• Average Width (MA distance)
• Slope (Angle) - High / Low / Average
• Shows current stage details in real-time
• Supports custom date range filtering
• Choose MA type: SMA or EMA
• Optional background coloring for stages
• Clean summary table displayed on the chart

Supply & Demand Zones + Order Block (Pro Fusion) SuroLevel up your trading edge with this all-in-one Supply and Demand Zones + Order Block TradingView indicator, built for precision traders who focus on price action and smart money concepts.
🔍 Key Features:
Automatic detection of Supply & Demand Zones based on refined swing highs and lows
Dynamic Order Block recognition with customizable thresholds
Highlights Breakout signals with volume confirmation and trend filters
Built-in EMA 50 trend detection
Take Profit (TP1, TP2, TP3) projection levels
Clean visual labels for Demand, Supply, and OB zones
Uses smart box plotting with long extended zones for better zone visibility
🔥 Ideal for:
Traders who follow Smart Money Concepts (SMC)
Supply & Demand strategy practitioners
Breakout & Retest pattern traders
Scalpers, swing, and intraday traders using Order Flow logic
📈 Works on all markets: Forex, Crypto, Stocks, Indices
📊 Recommended timeframes: M15, H1, H4, Daily
✅ Enhance your trading strategy using this powerful zone-based script — bringing structure, clarity, and automation to your chart.
#SupplyAndDemand #OrderBlock #TradingViewScript #SmartMoney #BreakoutStrategy #TPProjection #ForexIndicator #SMC

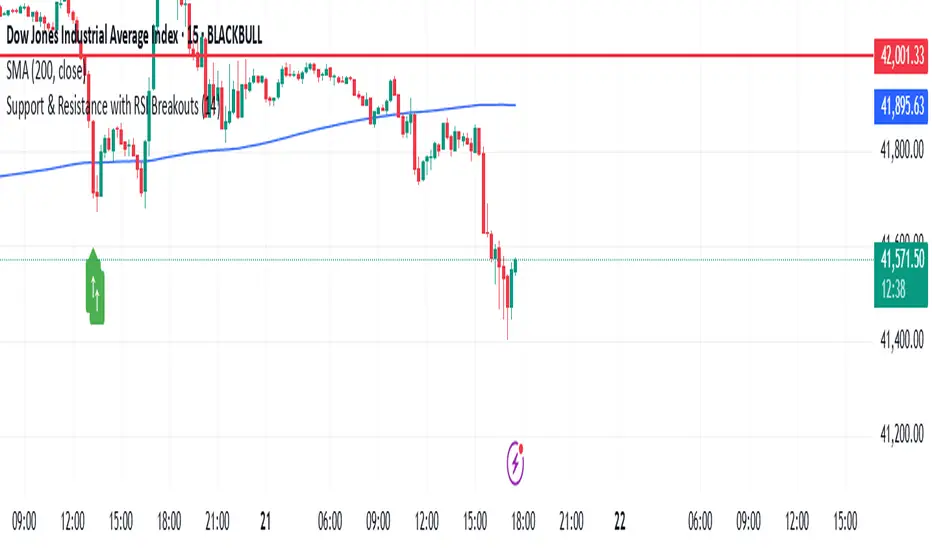
Support & Resistance with RSI BreakoutsThe script is a TradingView Pine Script (v5) indicator that identifies support and resistance levels using RSI (Relative Strength Index) breakouts. Here’s a breakdown of what it does:
Features:
RSI Calculation:
The script calculates the 14-period RSI (default) using the closing price.
The user can modify the RSI period through an input setting.
Buy and Sell Signals:
A buy signal is triggered when RSI drops below 20 (indicating oversold conditions).
A sell signal is triggered when RSI rises above 80 (indicating overbought conditions).
Visual Representation:
Buy signals are marked with a green upward arrow (↑) below the price bars.
Sell signals are marked with a red downward arrow (↓) above the price bars.
The arrows help traders easily spot potential trade opportunities.
Usage:
This script is useful for traders looking to buy at oversold conditions and sell at overbought conditions based on RSI.
It works best when combined with other indicators or price action strategies to confirm signals.
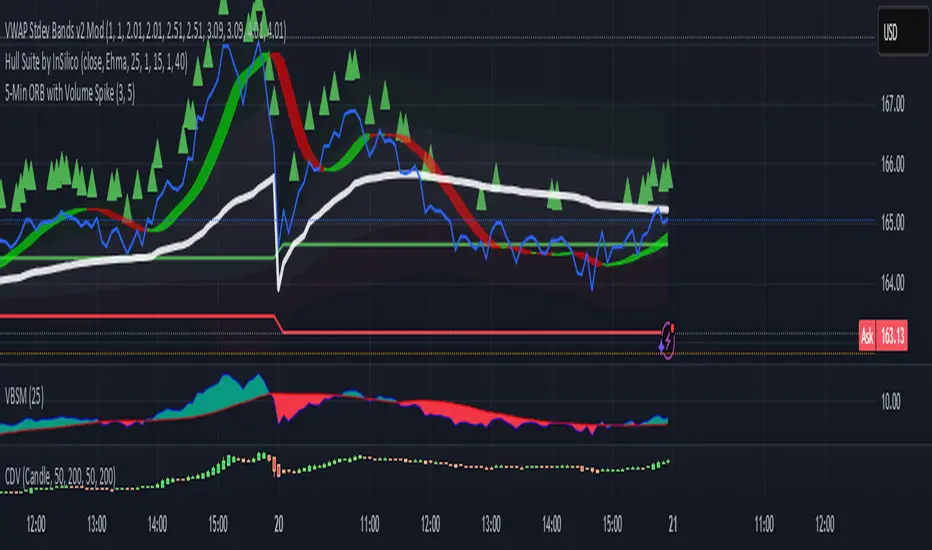
5-Min ORB with Volume SpikeThis indicator identifies Opening Range Breakouts (ORB) based on the high and low of the first 5 minutes of the trading day and confirms the breakout with a volume spike.
🔍 What It Does:
Automatically captures the Opening Range High and Low from 9:30 AM to 9:35 AM (configurable).
Plots green (high) and red (low) lines across the chart once the opening range is set.
Highlights long breakout signals when price breaks above the OR High with above-average volume.
Highlights short breakout signals when price breaks below the OR Low with above-average volume.
Volume confirmation is based on a customizable 20-period simple moving average (SMA) of volume.
⚙️ Best Used On:
5-minute or lower intraday charts (e.g., SPY, QQQ, futures, etc.)
Highly liquid, high-volatility instruments
U.S. equity market open (customizable for other sessions)
📈 Trading Edge: This strategy helps traders identify strong, momentum-driven breakouts early in the trading session — especially when confirmed by increased institutional activity (volume spike).
Williams Fractals Ultimate (Donchian Adjusted)Williams Fractals Ultimate (Donchian Adjusted)
Understanding Williams Fractals
Williams Fractals are a simple yet powerful tool used to identify potential turning points in the market. They highlight local highs (up fractals) and local lows (down fractals) based on a set period.
An up fractal appears when a price peak is higher than the surrounding prices.
A down fractal appears when a price low is lower than the surrounding prices.
Fractals help traders spot support and resistance levels, potential trend reversals, and price breakout zones.
Why Adjust Fractals with the Donchian Channel?
The standard Williams Fractals method identifies local highs and lows without considering broader market context. This script enhances fractal accuracy by integrating the Donchian Channel, which tracks the highest highs and lowest lows over a set period.
- The Donchian Baseline is calculated as the average of the highest high and lowest low over a selected period.
- Fractals are filtered based on this baseline:
Up Fractals are only shown if they are above the Donchian baseline.
Down Fractals are only shown if they are below the Donchian baseline.
This filtering method removes weak signals and ensures that only relevant fractals aligned with market structure are displayed.
Key Features of the Script
Customizable Fractal & Donchian Periods – Allows traders to fine-tune fractal sensitivity.
Donchian-Based Filtering – Reduces noise and highlights meaningful fractals.
Fractal ZigZag Line (Optional) – Helps visualize price swings more clearly.
Why Is This So Effective?
Stronger trend signals – Filtering with the Donchian baseline eliminates unreliable fractals.
Clearer price action – The optional ZigZag line visually connects significant highs and lows.
Easy trend identification – Helps traders confirm breakout zones and key price levels.
This script is a technical analysis tool and does not guarantee profitable trades. Always combine it with other indicators and risk management strategies before making trading decisions.

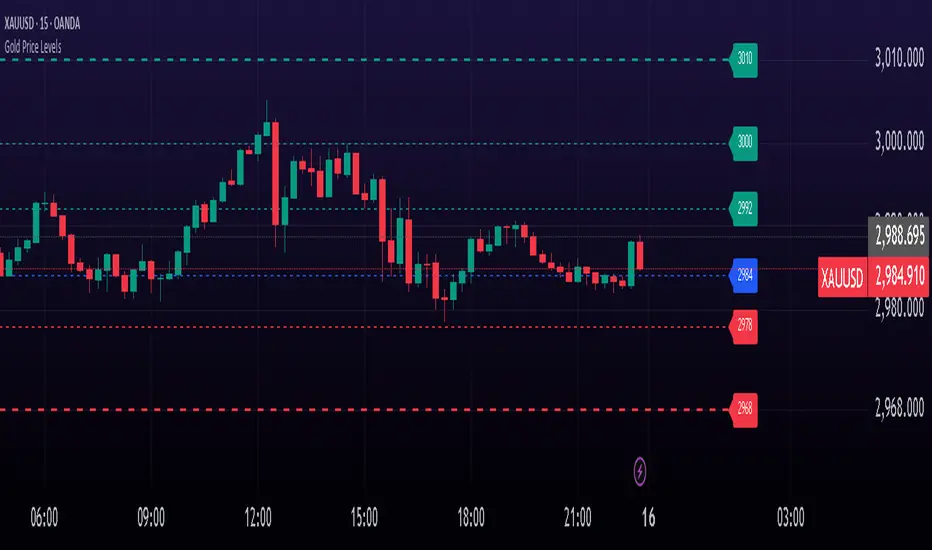
Gold Price LevelsThis indicator identifies and displays key price levels for gold trading. It highlights important psychological and technical price points that often act as support and resistance levels.
Features
Automatically identifies and displays key price levels ending in 92, 84, 78, 55, 42, 27, and 00
Special emphasis on critical levels ending in 68, 32, and 10 with increased line width
Color-coded visualization: green for levels above current price, red for levels below
Customizable line style, width, and label visibility
Automatically adjusts to different price ranges (works with any gold price)
How to Use
This indicator helps gold traders identify potential support and resistance zones. Watch for price reactions at these levels for potential trade entries, exits, or stop placement. The thicker lines (68, 32, 10) often represent more significant price levels where stronger reactions may occur.
Perfect for both day traders and swing traders looking to optimize their gold trading strategy with key price levels.
SMC with Fixed Fibonacci (Last Two Structure Changes) - ModifiedDetailed Indicator Description (English):
This indicator combines SMC market structure analysis with dynamic Fibonacci retracement levels to help traders track market directional changes and identify key support and resistance zones. Below is a detailed explanation of its components and functions:
Timeframe & Market Structure Analysis:
Timeframe Selection:
The indicator uses data from a user-defined timeframe for its analysis. If left blank, it defaults to the chart’s timeframe.
Pivot Calculation:
It calculates swing highs and swing lows using a pivot length (default is 4), which are then used to determine the market structure.
Market Structure Determination:
Based on these swing points, the indicator identifies the market trend as bullish or bearish and plots a market structure line (green for bullish, red for bearish).
Dynamic Fibonacci Retracement Levels:
Dynamic Drawing:
When a market structure change occurs, the indicator sets a starting pivot (prePivot) — the lowest low before a bullish change or the highest high before a bearish change.
PostPivot Updating:
The indicator then dynamically updates the postPivot level with each new bar (using the highest high for bullish moves and the lowest low for bearish moves).
Calculation Method:
For bullish moves, the Fibonacci retracement is calculated in reverse:
Bullish: Level 1 is at the starting low (prePivot) and level 0 is at the current high (postPivot).
For bearish moves, the levels are calculated in the conventional way (level 1 at the prePivot and level 0 at the current low).
Fibonacci Levels:
The retracement levels drawn include 1, 0.79, 0.705, 0.62, 0.5, and 0, with each level clearly labeled on the chart.
Previous Fibonacci Drawing (Historical Reference):
Retention of Past Levels:
Upon a new market structure change, the current Fibonacci drawing is moved to a “previous” group, remaining fixed on the chart as a historical reference.
User Control:
A toggle option ("Show Previous Fibonacci Drawing") allows users to enable or disable the display of the previous Fibonacci retracement levels.
Automated Alerts:
Alert Level Input:
Users can set an alert on a specific Fibonacci level via an input (default is 0.62).
Alert Tolerance:
The alert tolerance is adjustable and is set to 0.0 by default, meaning the alert triggers exactly when the price reaches the selected Fibonacci level.
Alert Trigger:
The indicator automatically issues an alert when the current price is within the defined tolerance of the chosen Fibonacci level.
Practical Benefits:
Market Structure Insight:
The indicator aids in understanding key turning points and directional changes in the market.
Support/Resistance Identification:
Dynamic and previous Fibonacci retracement levels help pinpoint potential support and resistance areas.
Historical Context:
Retaining the previous Fibonacci drawing allows traders to compare current price action with recent historical structure changes.
Timely Alerts:
Automated alerts ensure that traders are promptly notified when price approaches critical Fibonacci levels, facilitating timely decision-making.
you can Add the indicator many times to your charts with different time to find OTE inside OTE which help you get better results
صف المؤشر بالتفصيل:
هذا المؤشر يجمع بين تحليل هيكل السوق وفق منهجية SMC واستخدام مستويات فيبوناتشي لتصحيح الأسعار، مما يُتيح للمتداول تتبع التغيّرات في الاتجاه وتحديد مناطق الدعم والمقاومة المهمة. وفيما يلي توضيح دقيق لجميع مكوناته ووظائفه:
إطار زمني وتحليل السوق:
يعتمد المؤشر على بيانات من إطار زمني يُحدده المستخدم؛ وإذا تُرك فارغًا، فإنه يستخدم إطار الشارت الحالي.
يُحسب المؤشر نقاط التحول (Swing High وSwing Low) باستخدام قيمة pivot تلقائية مُعينة (تُضبط افتراضيًا على 4)، والتي تُستخدم لتحديد الهيكل السوقي.
بناءً على هذه النقاط، يتم تحديد اتجاه السوق (صعودي أو هبوطي) ورسم خط هيكل السوق الملون (أخضر للصعودي، أحمر للهبوطي).
رسم مستويات فيبوناتشي الديناميكية:
عند تغيير هيكل السوق، يقوم المؤشر بتحديد نقطة البداية (prePivot) التي تكون إما أقل قاع قبل التغير (في حالة الهيكل الصعودي) أو أعلى قمة قبل التغير (في حالة الهيكل الهبوطي).
بعد ذلك، يُحدث المؤشر نقطة النهاية (postPivot) بشكل ديناميكي مع كل شمعة بحيث يتم تحديد السعر الجديد (أعلى سعر في حالة الصعود، أو أدنى سعر في حالة الهبوط).
بالنسبة للحالة الصعودية، تُحسب مستويات فيبوناتشي بطريقة معكوسة بحيث يكون المستوى 1 عند نقطة البداية (القاع) والمستوى 0 عند السعر الجديد (القمة). بينما تُحسب مستويات الحالة الهبوطية بالطريقة التقليدية (المستوى 1 عند القمة و0 عند القاع).
تُرسم هذه المستويات على الشارت مع تسميات توضح قيمة كل مستوى (1، 0.79، 0.705، 0.62، 0.5، و0).
احتفاظ بالرسم السابق:
عند حدوث تغيير جديد في هيكل السوق، يُنقل رسم فيبوناتشي الحالي إلى مجموعة "الرسم السابق" ليبقى مرئيًا كمرجع للتغيّر الأخير.
يمكن للمستخدم التحكم في عرض هذا الرسم السابق عبر خيار "Show Previous Fibonacci Drawing"، حيث يمكن تفعيله أو تعطيله حسب الحاجة.
التنبيهات الآلية:
يوفر المؤشر ميزة إطلاق تنبيه عندما يصل السعر إلى مستوى فيبوناتشي محدد.
يُتيح للمستخدم اختيار مستوى فيبوناتشي للتنبيه (افتراضيًا 0.62) عبر إدخال يُمكن تعديله.
يتم حساب مستوى التنبيه وفقًا للاتجاه الحالي (مع استخدام الصيغة المعكوسة في الحالة الصعودية)، ويتم إطلاق التنبيه تلقائيًا عندما يكون الفرق بين السعر الحالي والمستوى المحسوب ضمن قيمة "Alert Tolerance" (والتي تُضبط افتراضيًا على 0.0).
الفوائد العملية للمؤشر:
تحليل هيكل السوق: يساعد المؤشر المتداول على فهم التغيرات الرئيسية في اتجاه السوق من خلال تحديد نقاط التحول الرئيسية.
تحديد مناطق التصحيح: تُظهر مستويات فيبوناتشي مناطق الدعم والمقاومة المحتملة، مما يُمكن المتداول من اتخاذ قرارات تداول أكثر دقة.
المرجعية التاريخية: الاحتفاظ برسم فيبوناتشي سابق يتيح للمتداول مقارنة التغيرات الحالية مع الفترات السابقة.
تنبيهات فورية: ميزة التنبيه تُبقي المتداول على علم عندما يصل السعر إلى مستوى فيبوناتشي مهم، مما يُساعد في اتخاذ إجراءات سريعة.
