Bill Williams Indicators

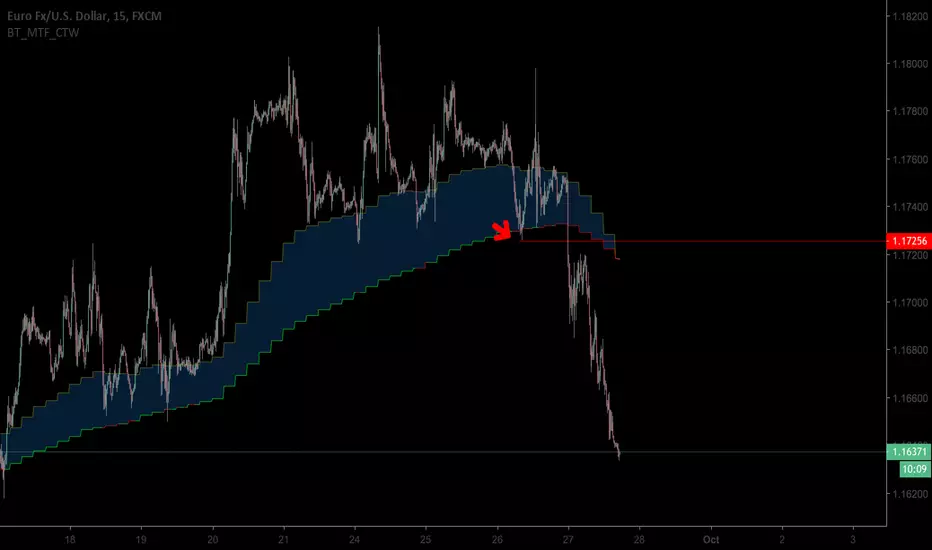
BullTrading MTF Chaos Trend WaveRecently I have received very positive private messages about the "BullTrading MTF Chaos Trend Wave"
So I decided to add Multi Time Frame capabilities. For example, for intraday trading (15') you can use the 240´timeframe as a reference for choosing your technical bias.
If you are not familiar with the previous version BullTrading Chaos Trend Wave is used to trade fractal breakouts like the "Alligator"
The difference is that it combines smoothed and reactive algorithms to plot nice moving averages for trend recognition but at the same time filtering the most significant fractals for reversal levels.
Note: Modifying the standard settings except for the timeframe resolution is not recommended
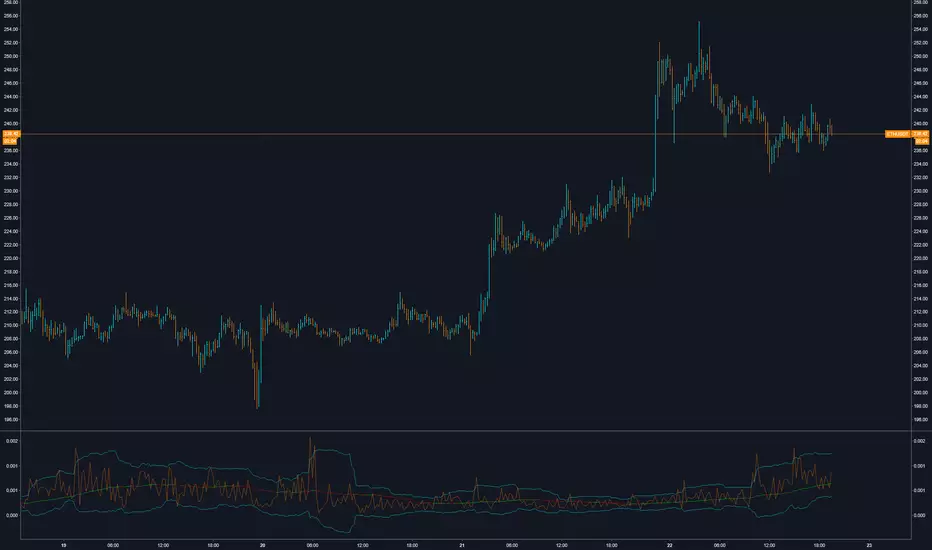
Willams %R with 13 EMA - TRIBased on alexpunct's work.
I simply added a second Willy plot and EMA which allows you to plot Willy and its EMA for a second time frame on the same chart.
The idea is that you will only enter a trade if there is confluence on the two time frames i.e. Willy is stupidly oversold/overbought on both the 4h and 12h or 1h and 4h time frames.
I will be testing this and will adapt

NeoIchi
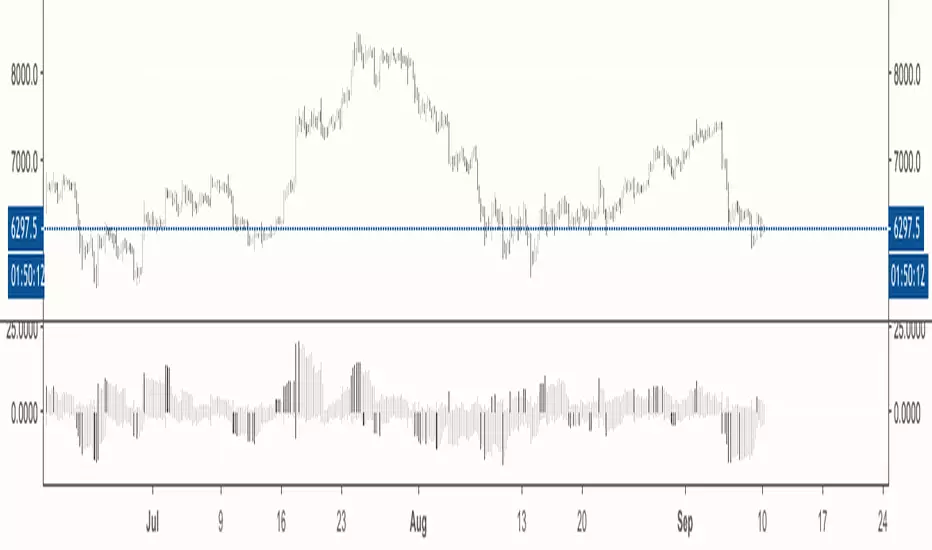
The idea of this oscillator / indicator came from Ichimoku , how it draws and how it calculates different averages in different scales.
The formula used for this indicator is totally different from Ichimoku , as you can compare the left and right charts, with same setting between my indicator and ichimoku , different results show up.
The inputs that you can use for this indicator/oscillator :
1- HLC3 (better to through it on the chart just like ichimoku
2- acceleration - deceleration (set the first parameter to 5 and the second to 34 for standard calculations)
3- pure volume
4- OBV ( On Balance Volume )
5- Bill Williams MFI ( Market Facilitation Index )
6- Momentum : This one can have different options : set with Barry Burn's formula and bar scale for when the charts are 1 to 3 ratio (B 3) or when they are not 1 to 3 (B), Bill William standard (W), Hybrid with barry's input (Would be bar close but I replaced it with HLC3, better results) but Bill William time scale for calculations (H), and finally, use Bill Williams MFI as input but use Barry Burn's time scales in formula (H M)
If you have any specific input in mind that you think would be nice to have in this system, through a comment bellow and I will add it to the system.
This oscillator / indicator is for sale, you can buy a life long licence that would include all updates with 0.01 BTC. Send the BTC + transaction fee to the wallet address bellow :
12EDAYA52DzcXdh9aLC9Pqqfhm1jNMjxNo
after sending the BTC , contact me in pm and send the transaction ID with your trading view's ID and I will give you access to this oscillator / indicator


Williams MFI (Market Facilitation Index)This is an oscillator that shows bill williams MFI (market facilitation index) this value can be used in other parts of bill williams system like calculation of momentum, by having this side by side with my momentum oscillator when it takes mfi as input, you can have better understanding on why the momentum moves in special way.
Keltner Channels+Parabolic Sar+Fractals+MACDA mixture of 4 indicators on the same overlay. Keltner Channels, Parabolic Sar, Fractals. MACD is integrated for yellow candles in order to show huge macd and trigger line gaps. MACD integration focuses on hist line by determining negative upper level and positive bottom level.

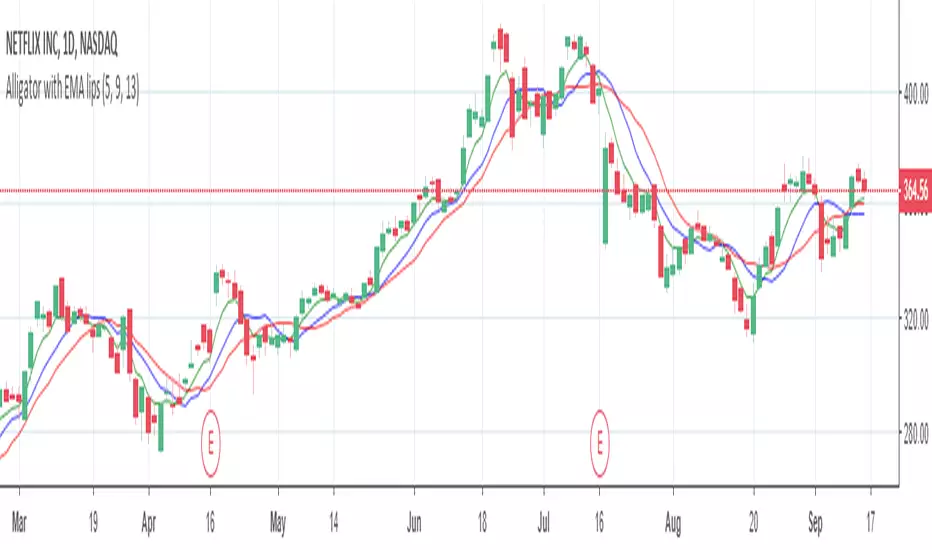
Alligator with EMA lipsI wanted Alligator but with lips, more sensitive to the latest data instead of the whole period. Made alligator with EMA lips.
Cenobar PPHLthis is an script for support and ressitance zone area
i use fib ret and high low to find best zone for entry and exit.

Bill Williams. Candles bear / bullish spread + Alligator.Bill Williams. Candles bear / bullish spread + Alligator.

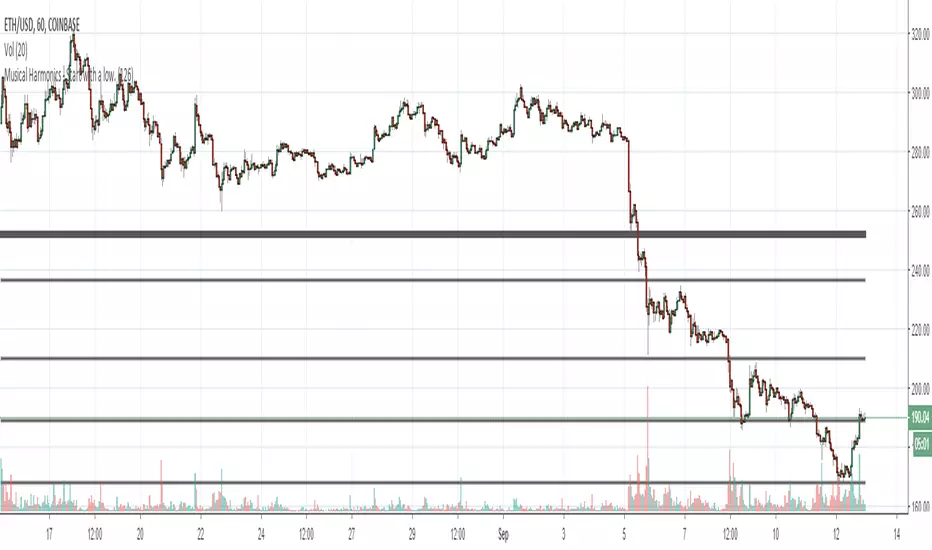
Musical Harmonics - Start with a low.Octaves double from one octave to another, so start with octaves beginning with the number one, for example:
1 doubled is 2, 2 doubled is 4, 4 double is 8 and then we go on to this sequence:
1,2,4,8,16,32,64,126,256,512,1024,2048,etc,etc
Find one of the numbers near a range, so for example on this chart Ethereum was trading at 190.31. That price is in between the octaves of 126 and 256. The number I use as the low for the indicator is 126.
Working on updating with labels and such
Multiple Time Frame Williams Alligator H1M5fractalist scalpers, chaos theorists and traders trading on 5 minute charts in the financial markets are often swamped by too many fractals; switching between charts back and forth can be a headache too; so here's an indicator script coded by yours truly to make our lives easier.
how it works?
apply MTFWA on a 5 minute chart; synchronise it with your 1 hour chart; draw the standard horizontal lines to mark fractals on your 1 hour chart...there you go; better fractals filtered to analyse your 5 minute chart; scalp your hearts out.
Multiple Time Frame Williams Alligator H1M5fractalist scalpers, chaos theorists and traders trading on 5 minute charts in the financial markets are often swamped by too many fractals; switching between charts back and forth to do multi time frame analysis can be a headache too; so here's an indicator script coded by yours truly to make our lives easier.
how it works?
apply MTFWA on a 5 minute chart; synchronise it with your 1 hour chart; draw the standard horizontal lines to mark fractals on your 1 hour chart...there you go; better fractals filtered to analyse your 5 minute chart; scalp your hearts out.

Multi Time Frame Williams Alligator H1M5fractalist scalpers, chaos theorists and traders trading on 5 minute charts in the financial markets are often swamped by too many fractals; switching between charts back and forth to do multi time frame analysis can be a headache too; so here's an indicator script coded by yours truly to make our lives easier.
how it works?
apply MTFWA on a 5 minute chart; synchronise it with your 1 hour chart; draw the standard horizontal lines to mark fractals on your 1 hour chart...there you go; better fractals filtered to analyse your 5 minute chart; scalp your hearts out.

Multi Time Frame Williams Alligator H1M5fractalist scalpers and chaos theorists traders trading on 5 minute charts in the financial markets are often swamped by too many fractals; switching between charts back and forth to do multi time frame analysis can be a headache too; so here's an indicator script coded by yours truly to make our lives easier.
how it works?
apply MTFWA on a 5 minute chart; synchronise it with your 1 hour chart; draw the standard horizontal lines to mark fractals on your 1 hour chart...there you go; better fractals filtered to analyse your 5 minute chart; scalp your hearts out.

Multi Time Frame Williams Alligator H1M5
fractalist scalpers and traders on 5 minute charts in the financial markets are often swamped by too many fractals; switching charts back and forth to do multi time frame analysis can be a headache too; so here's an indicator script coded by yours truly to make our lives easier.
how it works?
apply MTFWA on a 5 minute chart; sychronise it with your 1 hour chart; draw the standard horizontal line to mark fractals on your 1 hour chart...there you go; better fractals filtered to analyse your 5 minute chart; scalp your hearts out.

Multi Time Frame Williams Alligator H1M5specifically for fractalist scalpers; apply H1 MTFWA on M5 chart.

Time Pattern IndicatorHigh Priority = Gold Diamonds
Medium Priority = Silver Circles
Leading Priority = Fuchsia Crosses


FILBFILBv3- Components:
1)
EMA 8 moves above 24: Candles Flip Green
EMA 8 moves Below 24: Candles Flip Pink
2)
Bull Div - Blue Candle
Bear Div - Red Candle
(On Mac D)
3)
Williams Fractals
Was designed on the 6 Hour Chart.
- Settings need to be adjusted:
Deslect the normal candles by right clicking the chart description in the top left and select "hide"
Hide the EMAs (i sometimes show the EMA 24) in the FILBFILB settings
Select the wick colour to grey in the FILBFILB settings
The Way i use this to:
- Use Stops based on Fractal points
- Enter Trades Long when flip Green Bear when flip Pink
- Hedge on Red Candles when in bull trend, unhedge when Blue (vica - versa in bear trend)

ULTIMATE ICHIMOKU TRADING SUITEThis is an update of "Uncle Mo's Ultimate Ichimoku V1"
Main features:
2 x Ichimoku Cloud
5 x EMA
2 x MA
1 x HullMA
Williams Fractal
Bollinger Bands - ***NEW***
ATR - ***NEW***
PSAR - ***NEW***
Candlestick Patterns - ***NEW***
Price Action Bars- ***NEW***
List of credits:
@br0qn for the Ichimoku
@RicardoSantos for the Bill Williams Fractal
@EmilianoMesa for the EMAs/MAs
@mohamed982 for the HullMA
@ymaheshreddy4u for the Bollinger Bands
@ChrisMoody for the Price Action Bars and PSAR
@HPotter for the ATR
@repo32 for the Candlestick Patterns
The script is open source and free to use. Feel free to change it around to suit your needs.
***If you copy & paste code from other traders to make your own script, please do remember to give them credit for their amazing work.***
Happy trading!
