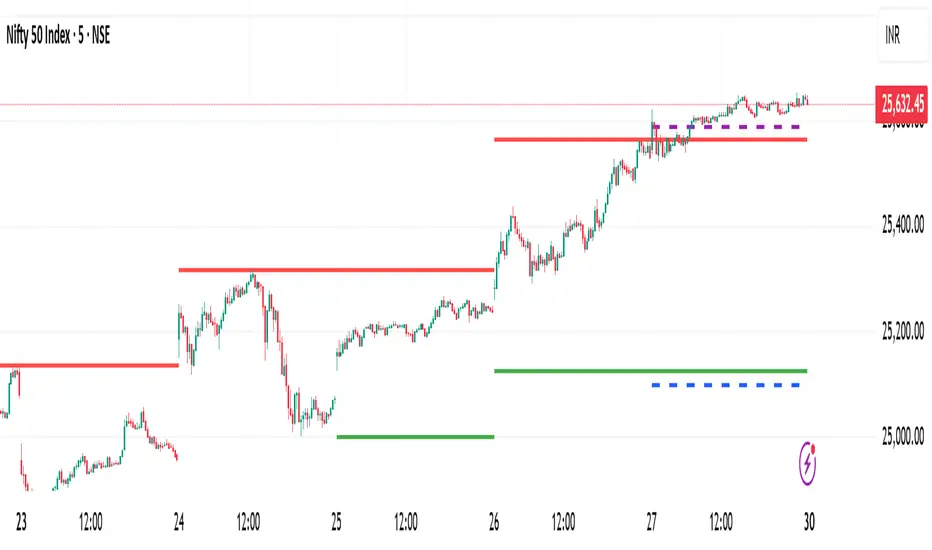
Multi-Timeframe Horizontal LinesThis Pine Script indicator plots horizontal lines at the high and low prices of the most recent 1-hour and 15-minute candles. Users can customize the color and width of the lines for each timeframe. The lines are updated dynamically, with previous lines removed to keep the chart clean.
Cycles

X HL QA market structure tool designed to frame price action within a defined context of prior session dynamics. It accomplishes this by anchoring a set of reference levels to the high, low, and open prices of a user-specified higher timeframe (e.g., 4H, 1D, etc.) and projecting those levels onto the current chart for ongoing analysis.
At its core, the indicator establishes a reference range—derived from the previous completed instance of the selected timeframe—and overlays this on the current timeframe. This range serves as a foundational structure for price interpretation in the current session.
Building upon this framework, the script constructs a set of symmetrical quadrants (or deviation zones) both inside and outside of the prior range. These include:
The midpoint (EQ) of the prior range
Levels at ±0.25x, ±0.75x, ±1.0x, ±1.5x, and ±2.0x the range height
These levels act as contextual zones that traders can use to interpret price behavior—whether it's consolidating within the prior range, approaching fair value (EQ), or expanding into directional continuation or reversal zones beyond the range.
The script operates in both real-time and historical contexts. On live bars, it dynamically updates the key levels to provide an evolving view of current price positioning. Simultaneously, it supports the display of historical levels for past sessions, enabling robust backtesting and comparative analysis of price behavior relative to previous quadrant structures.
Ultimately, this tool serves as a positional map, helping traders assess where price is trading relative to significant levels from the prior session, offering insights into potential support/resistance, overextension, or mean reversion scenarios.
Key Technical Features
Multi-Timeframe Support:
request.security() is used to pull data from a user-defined higher timeframe regardless of the current chart interval.
Visual Flexibility:
Toggle between "line" and "channel" mode.
Line color, width, and visibility are all user-controlled.
Anchoring Options:
Deviation levels can be calculated from either the previous period's open or its EQ (midpoint), giving flexibility depending on analytical preference.
Efficient Labeling:
Labels are only rendered on the last bar and are automatically cleared and redrawn to prevent duplication.
Label style, size, text color, and background color are all user-configurable.
Trading Application
This indicator is especially suited for:
1. Mean Reversion Strategies
When price moves beyond +1.0 or +1.5 deviations from the EQ or open, it may signal overextension and a potential snap back to the midpoint or range.
2. Breakout Confirmation
Sustained price action beyond ±1.0 levels may indicate trend strength or continuation beyond historical balance zones.
3. Contextual Range Awareness
EQ and Open provide structure from which traders can judge whether price is in a state of balance or imbalance.
Labels offer at-a-glance interpretation of key levels across any chosen timeframe.
4. Fractal and Multi-Session Analysis
Analysts can layer daily, weekly, and monthly versions of this indicator to observe confluence or divergence of higher timeframe structure.

Price Density Strategy ScoreBased on the rules we defined, a composite score (-3 to +3) is calculated and displayed as colored bars below the chart:
Dark green (+3): Strong buy signal
Light green (+1, +2): Mildly bullish
Gray (0): Neutral
Light red (-1, -2): Mildly bearish
Dark red (-3): Strong sell signal
根据我们定义的规则,计算一个综合分数(-3 到 +3),并在图表下方用不同颜色的柱状图显示出来:
深绿色 (+3):强力买入信号
浅绿色 (+1, +2):温和看涨
灰色 (0):中性
浅红色 (-1, -2):温和看跌
深红色 (-3):强力卖出信号

MACD Triple divergence signalsThis script is a basic combination of several scripts that I found very useful. It's a MACD divergence on steroids. Instead of using only one plot as a source for detecting divergence, I use all of the plots.
The idea is that if more divergence signals appear—especially after a prolonged downtrend or uptrend—they can be interpreted as a strong divergence signal.
The third divergence signal is taken from the MACD signal line. It has a longer-term lookback range, which could provide a more reliable divergence signal.
The default minimum lookback range is 15, much greater than the usual value of 5. This makes it more suitable for long-term trading or for lower timeframes (lower than 4H) to reduce noise from excessive signals. For timeframes higher than 4H, the setting can be reduced to around 10 or even 5.
For the 1W (weekly) timeframe, try using a value of 3.
I also added a band to give a clear visual of overbought and oversold areas. It works similarly to Bollinger Bands (BB). You can spot when the price is ranging or when a stop-loss hunt occurs (i.e., the price breaks the band).
Please do your homework—backtest it yourself to find which timeframe suits you best. You can also tweak the settings if you find the default values too aggressive or too mild.
I’ve found that MACD is more reliable on timeframes greater than 1H. Personally, I use it on the 4H and 1D timeframes.
in bahasa:
MACD dengan 3 sinyal divergence, kalau muncul lebih banyak, bisa jadi sinyal lebih menyakinkan.
Minimum lookback range default-nya 15 agar tidak muncul terlalu banyak sinyal. 15 lebih panjang, lebih ok. Kalau main di higher timeframe seperti 1D, bisa 5-10, kalau weeky timeframe = 3.
Untuk band, cek ketika plot-nya keluar dari band, itu bisa jadi jackpot, apalagi kalau plot-nya membentuk double bottom.
Backtest sendiri, siapa tahu kalian bisa dapet setting sendiri.
MACD with upper and lower band will give you a clear visual of price movements
More divergence signals are generated and when the price breaks out of the oversold band = jackpot.

Step 1: Draw Thursday HighScript Description: Thursday High Marker
This is an automated charting tool designed to identify the high of each Thursday and display it as a key reference level for future trading sessions.
Core Functionality:
The script's logic is simple and precise. It waits for the trading session on Thursday to complete. At the very beginning of Friday, it looks back, finds the highest price from Thursday, and draws a clean, white horizontal line at that level.
Key Features:
Automatic: You don't need to do anything. The script finds and draws the level on its own every week.
Forward-Looking: The line extends to the right indefinitely, allowing you to see how future price action interacts with this key level.
Self-Cleaning: To keep your chart uncluttered, the script automatically deletes the previous week's line when it draws the new one.
Lightweight: It performs a single, simple task, so it doesn't slow down your chart.
Purpose in Trading:
Traders use this kind of indicator to track significant weekly price points. The high of a late-week session like Thursday is often considered an important liquidity level. A break above this line can signal bullish strength or a "liquidity sweep," making it a valuable point of interest for making trading decisions on Friday and into the following week.

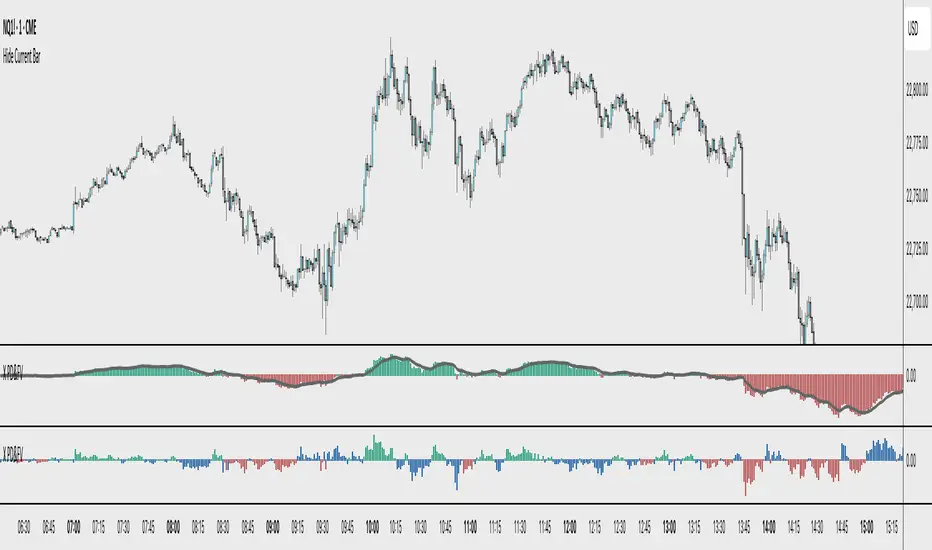
Cumulative Volume Delta with MAfor higher timeframes , i use 9 or 11 ema , and 5 seconds on 1 day. moving average of the cvd not the raw volume . i use it with the impulse macd and find momentum trades or selloffs when moving averages cross .

X PD&FVVisualizes the price's premium or discount relative to a moving average benchmark, highlighting mean-reversion and trend-continuation opportunities. While the underlying math is simple, the application is nuanced and can enhance decision-making in both trending and ranging market conditions.
Core Logic:
This tool calculates a custom **spread value**, defined as the distance between the current price and a chosen exponential moving average (EMA). Specifically:
When the current price is **above** the EMA, the spread is calculated as `low - EMA`.
When the price is **below** the EMA, the spread is calculated as `high - EMA`.
This approach creates a dynamic spread that reflects deviation from the EMA, with histogram bars:
Green when the spread is positive (suggesting a price premium),
Red when the spread is negative (suggesting a discount).
A secondary EMA (default 9-period) is applied to the spread itself, plotted as a smoother line over the histogram. This "EMA of spread" line can be interpreted as a moving reference level for detecting directional shifts in momentum.
Interpretation:
Zero Line = Fair Value: The horizontal zero axis represents equilibrium relative to the moving average. Movement toward or away from this line signals potential shifts in market bias.
Trend Following Use: In trending markets, traders can:
Buy when the spread dips below its EMA (discount within uptrend),
Sell when the spread rises above its EMA (premium within downtrend).
Mean Reversion Use: A return to the zero line (fair value) often acts as an **inflection point**, which traders can monitor for either:
Trend continuation (bounce away from zero), or
Reversal (cross through zero).
Customization:
EMA length (default 50) is adjustable to fit different timeframes or asset volatility.
Altcoins + ETH (brez stablecoinov) / BTCWhen chart hits cca 0.3 of value it's sign the beginning ALT season.

VWAP + HL + EMAsVWAP
Yesterday’s High and Low
Today’s High and Low
EMAs (20, 50, 100, 200)
VWAP
Yesterday’s High and Low
Today’s High and Low
EMAs (20, 50, 100, 200)

MSFT Bias at NYSE Open (9:30 ET)have an 85% bias accuracy rate with this indicator. wait for market open


Mutant Cycle - Volatility DriverMutant cycle _ volatility Driver
Punti di volatilità settimanali massimo e minimi forti

MA Bands with Dynamic ColorsThe chart displays the 50-day, 100-day, and 200-day moving averages (MAs).
When the 50-day MA is above both the 100-day and 200-day MAs, the chart turns green, indicating a bullish trend with increasing positive momentum.
Conversely, when the 50-day MA is below the 100-day and 200-day MAs, the chart turns red, signaling a bearish trend with negative momentum.
This color-coded system, with green and red clouds, helps traders identify the trend direction and gauge positive or negative momentum for potential trading opportunities.

3-Candle HH/HL or LH/LL (Number Labels Over Candles)What This Script Does:
This Pine Script detects 3 consecutive candlesticks that show:
Higher Highs and Higher Lows → a bullish structure
Lower Highs and Lower Lows → a bearish structure
When such a pattern is found, the script:
Marks each of the 3 candles with a number: 1, 2, and 3
Labels appear centered on each candle (at the close price)
You can adjust:
Label size (tiny → huge)
Background color (bullish/bearish)
Text color
Example:
If candles form:
Candle A: higher high & higher low
Candle B: higher than A
Candle C: higher than B
Then you’ll see 1, 2, 3 labels on those candles in green (or your selected color).
Same goes for a bearish pattern in red.

Heatmap w/ ATRThis script combines Heatmap Volume with a scaled ATR (Average True Range) overlay for dynamic market insight. Volume bars are color-coded based on how many standard deviations they deviate from a moving average, helping identify spikes, absorption, or anomalies.
The ATR is scaled relative to the maximum volume observed to maintain visual alignment in the same pane. This allows traders to compare price volatility (ATR) against real market activity (volume) in one view.
Use this overlay to:
Spot high-volatility, high-conviction moves (rising ATR + red/orange bars)
Detect low-volume fakeouts (high ATR, cool-colored bars)
Identify compression zones before expansion (low ATR + normal volume)

Saty ATR Levels// Saty ATR Levels
// Copyright (C) 2022 Saty Mahajan
// Author is not responsible for your trading using this script.
// Data provided in this script is not financial advice.
//
// Features:
// - Day, Multiday, Swing, Position, Long-term, Keltner trading modes
// - Range against ATR for each period
// - Put and call trigger idea levels
// - Intermediate levels
// - Full-range levels
// - Extension levels
// - Trend label based on the 8-21-34 Pivot Ribbon
//
// Special thanks to Gabriel Viana.
// Based on my own ideas and ideas from Ripster, drippy2hard,
// Adam Sliver, and others.
//@version=5
indicator('Saty ATR Levels', shorttitle='Saty ATR Levels', overlay=true)
// Options
day_trading = 'Day'
multiday_trading = 'Multiday'
swing_trading = 'Swing'
position_trading = 'Position'
longterm_trading = 'Long-term'
trading_type = input.string(day_trading, 'Trading Type', options= )
use_options_labels = input(true, 'Use Options Labels')
atr_length = input(14, 'ATR Length')
trigger_percentage = input(0.236, 'Trigger Percentage')
previous_close_level_color = input(color.white, 'Previous Close Level Color')
lower_trigger_level_color = input(color.yellow, 'Lower Trigger Level Color')
upper_trigger_level_color = input(color.aqua, 'Upper Trigger Level Color')
key_target_level_color = input(color.silver, 'Key Target Level Color')
atr_target_level_color = input(color.white, 'ATR Target Level Color')
intermediate_target_level_color = input(color.gray, 'Intermediate Target Level Color')
show_all_fibonacci_levels = input(true, 'Show All Fibonacci Levels')
show_extensions = input(false, 'Show Extensions')
level_size = input(2, 'Level Size')
show_info = input(true, 'Show Info Label')
use_current_close = input(false, 'Use Current Close')
fast_ema = input(8, 'Fast EMA')
pivot_ema = input(21, 'Pivot EMA')
slow_ema = input(34, 'Slow EMA')
// Set the appropriate timeframe based on trading mode
timeframe_func() =>
timeframe = 'D'
if trading_type == day_trading
timeframe := 'D'
else if trading_type == multiday_trading
timeframe := 'W'
else if trading_type == swing_trading
timeframe := 'M'
else if trading_type == position_trading
timeframe := '3M'
else if trading_type == longterm_trading
timeframe := '12M'
else
timeframe := 'D'
// Trend
price = close
fast_ema_value = ta.ema(price, fast_ema)
pivot_ema_value = ta.ema(price, pivot_ema)
slow_ema_value = ta.ema(price, slow_ema)
bullish = price >= fast_ema_value and fast_ema_value >= pivot_ema_value and pivot_ema_value >= slow_ema_value
bearish = price <= fast_ema_value and fast_ema_value <= pivot_ema_value and pivot_ema_value <= slow_ema_value
// Data
period_index = use_current_close ? 0 : 1
ticker = ticker.new(syminfo.prefix, syminfo.ticker, session=session.extended)
previous_close = request.security(ticker, timeframe_func(), close , gaps=barmerge.gaps_off, lookahead=barmerge.lookahead_on)
atr = request.security(ticker, timeframe_func(), ta.atr(atr_length) , gaps=barmerge.gaps_off, lookahead=barmerge.lookahead_on)
period_high = request.security(ticker, timeframe_func(), high, gaps=barmerge.gaps_off, lookahead=barmerge.lookahead_on)
period_low = request.security(ticker, timeframe_func(), low, gaps=barmerge.gaps_off, lookahead=barmerge.lookahead_on)
range_1 = period_high - period_low
tr_percent_of_atr = range_1 / atr * 100
lower_trigger = previous_close - trigger_percentage * atr
upper_trigger = previous_close + trigger_percentage * atr
lower_0382 = previous_close - atr * 0.382
upper_0382 = previous_close + atr * 0.382
lower_0500 = previous_close - atr * 0.5
upper_0500 = previous_close + atr * 0.5
lower_0618 = previous_close - atr * 0.618
upper_0618 = previous_close + atr * 0.618
lower_0786 = previous_close - atr * 0.786
upper_0786 = previous_close + atr * 0.786
lower_1000 = previous_close - atr
upper_1000 = previous_close + atr
lower_1236 = lower_1000 - atr * 0.236
upper_1236 = upper_1000 + atr * 0.236
lower_1382 = lower_1000 - atr * 0.382
upper_1382 = upper_1000 + atr * 0.382
lower_1500 = lower_1000 - atr * 0.5
upper_1500 = upper_1000 + atr * 0.5
lower_1618 = lower_1000 - atr * 0.618
upper_1618 = upper_1000 + atr * 0.618
lower_1786 = lower_1000 - atr * 0.786
upper_1786 = upper_1000 + atr * 0.786
lower_2000 = lower_1000 - atr
upper_2000 = upper_1000 + atr
lower_2236 = lower_2000 - atr * 0.236
upper_2236 = upper_2000 + atr * 0.236
lower_2382 = lower_2000 - atr * 0.382
upper_2382 = upper_2000 + atr * 0.382
lower_2500 = lower_2000 - atr * 0.5
upper_2500 = upper_2000 + atr * 0.5
lower_2618 = lower_2000 - atr * 0.618
upper_2618 = upper_2000 + atr * 0.618
lower_2786 = lower_2000 - atr * 0.786
upper_2786 = upper_2000 + atr * 0.786
lower_3000 = lower_2000 - atr
upper_3000 = upper_2000 + atr
// Add Labels
tr_vs_atr_color = color.green
if tr_percent_of_atr <= 70
tr_vs_atr_color := color.green
else if tr_percent_of_atr >= 90
tr_vs_atr_color := color.red
else
tr_vs_atr_color := color.orange
trading_mode = 'Day'
if trading_type == day_trading
trading_mode := 'Day'
else if trading_type == multiday_trading
trading_mode := 'Multiday'
else if trading_type == swing_trading
trading_mode := 'Swing'
else if trading_type == position_trading
trading_mode := 'Position'
else if trading_type == longterm_trading
trading_mode := 'Long-term'
else
trading_mode := ''
long_label = ''
short_label = ''
if use_options_labels
long_label := 'Calls'
short_label := 'Puts'
else
long_label := 'Long'
short_label := 'Short'
trend_color = color.orange
if bullish
trend_color := color.green
else if bearish
trend_color := color.red
else
trend_color := color.orange
var tbl = table.new(position.top_right, 1, 4)
if barstate.islast and show_info
table.cell(tbl, 0, 0, 'Saty ATR Levels', bgcolor=trend_color)
table.cell(tbl, 0, 1, trading_mode + ' Range ($' + str.tostring(range_1, '#.##') + ') is ' + str.tostring(tr_percent_of_atr, '#.#') + '% of ATR ($' + str.tostring(atr, '#.##') + ')', bgcolor=tr_vs_atr_color)
table.cell(tbl, 0, 2, long_label + ' > $' + str.tostring(upper_trigger, '#.##') + ' | +1 ATR $' + str.tostring(upper_1000, '#.##'), bgcolor=upper_trigger_level_color)
table.cell(tbl, 0, 3, short_label + ' < $' + str.tostring(lower_trigger, '#.##') + ' | -1 ATR: $' + str.tostring(lower_1000, '#.##'), bgcolor=lower_trigger_level_color)
// Add levels
plot(show_extensions ? lower_3000 : na, color=color.new(atr_target_level_color, 40), linewidth=level_size, title='-300.0%', style=plot.style_stepline)
//plot(show_all_fibonacci_levels and show_extensions ? lower_2786 : na, color=color.new(intermediate_target_level_color, 40), linewidth=level_size, title='-278.6%', style=plot.style_stepline)
plot(show_extensions ? lower_2618 : na, color=color.new(key_target_level_color, 40), linewidth=level_size, title='-261.8%', style=plot.style_stepline)
//plot(show_all_fibonacci_levels and show_extensions ? lower_2500 : na, color=color.new(intermediate_target_level_color, 40), linewidth=level_size, title='-250.0%', style=plot.style_stepline)
//plot(show_all_fibonacci_levels and show_extensions ? lower_2382 : na, color=color.new(intermediate_target_level_color, 40), linewidth=level_size, title='-238.2%', style=plot.style_stepline)
plot(show_extensions ? lower_2236 : na, color=color.new(key_target_level_color, 40), linewidth=level_size, title='-223.6%', style=plot.style_stepline)
plot(show_extensions ? lower_2000 : na, color=color.new(atr_target_level_color, 40), linewidth=level_size, title='-200.0%', style=plot.style_stepline)
plot(show_all_fibonacci_levels and show_extensions ? lower_1786 : na, color=color.new(intermediate_target_level_color, 40), linewidth=level_size, title='-178.6%', style=plot.style_stepline)
plot(show_extensions ? lower_1618 : na, color=color.new(key_target_level_color, 40), linewidth=level_size, title='-161.8%', style=plot.style_stepline)
plot(show_all_fibonacci_levels and show_extensions ? lower_1500 : na, color=color.new(intermediate_target_level_color, 40), linewidth=level_size, title='-150.0%', style=plot.style_stepline)
plot(show_all_fibonacci_levels and show_extensions ? lower_1382 : na, color=color.new(intermediate_target_level_color, 40), linewidth=level_size, title='-138.2%', style=plot.style_stepline)
plot(show_extensions ? lower_1236 : na, color=color.new(key_target_level_color, 40), linewidth=level_size, title='-123.6%', style=plot.style_stepline)
plot(lower_1000, color=color.new(atr_target_level_color, 40), linewidth=level_size, title='-100%', style=plot.style_stepline)
plot(show_all_fibonacci_levels ? lower_0786 : na, color=color.new(intermediate_target_level_color, 40), linewidth=level_size, title='-78.6%', style=plot.style_stepline)
plot(lower_0618, color=color.new(key_target_level_color, 40), linewidth=level_size, title='-61.8%', style=plot.style_stepline)
plot(show_all_fibonacci_levels ? lower_0500 : na, color=color.new(intermediate_target_level_color, 40), linewidth=level_size, title='-50.0%', style=plot.style_stepline)
plot(show_all_fibonacci_levels ? lower_0382 : na, color=color.new(intermediate_target_level_color, 40), linewidth=level_size, title='-38.2%', style=plot.style_stepline)
plot(lower_trigger, color=color.new(lower_trigger_level_color, 40), linewidth=level_size, title='Lower Trigger', style=plot.style_stepline)
plot(previous_close, color=color.new(previous_close_level_color, 40), linewidth=level_size, title='Previous Close', style=plot.style_stepline)
plot(upper_trigger, color=color.new(upper_trigger_level_color, 40), linewidth=level_size, title='Upper Trigger', style=plot.style_stepline)
plot(show_all_fibonacci_levels ? upper_0382 : na, color=color.new(intermediate_target_level_color, 40), linewidth=level_size, title='38.2%', style=plot.style_stepline)
plot(show_all_fibonacci_levels ? upper_0500 : na, color=color.new(intermediate_target_level_color, 40), linewidth=level_size, title='50.0%', style=plot.style_stepline)
plot(upper_0618, color=color.new(key_target_level_color, 40), linewidth=level_size, title='61.8%', style=plot.style_stepline)
plot(show_all_fibonacci_levels ? upper_0786 : na, color=color.new(intermediate_target_level_color, 40), linewidth=level_size, title='78.6%', style=plot.style_stepline)
plot(upper_1000, color=color.new(atr_target_level_color, 40), linewidth=level_size, title='100%', style=plot.style_stepline)
plot(show_extensions ? upper_1236 : na, color=color.new(key_target_level_color, 40), linewidth=level_size, title='123.6%', style=plot.style_stepline)
plot(show_all_fibonacci_levels and show_extensions ? upper_1382 : na, color=color.new(intermediate_target_level_color, 40), linewidth=level_size, title='138.2%', style=plot.style_stepline)
plot(show_all_fibonacci_levels and show_extensions ? upper_1500 : na, color=color.new(intermediate_target_level_color, 40), linewidth=level_size, title='150.0%', style=plot.style_stepline)
plot(show_extensions ? upper_1618 : na, color=color.new(key_target_level_color, 40), linewidth=level_size, title='161.8%', style=plot.style_stepline)
plot(show_all_fibonacci_levels and show_extensions ? upper_1786 : na, color=color.new(intermediate_target_level_color, 40), linewidth=level_size, title='178.6%', style=plot.style_stepline)
plot(show_extensions ? upper_2000 : na, color=color.new(atr_target_level_color, 40), linewidth=level_size, title='200.0%', style=plot.style_stepline)
plot(show_extensions ? upper_2236 : na, color=color.new(key_target_level_color, 40), linewidth=level_size, title='223.6%', style=plot.style_stepline)
//plot(show_all_fibonacci_levels and show_extensions ? upper_2382 : na, color=color.new(intermediate_target_level_color, 40), linewidth=level_size, title='238.2%', style=plot.style_stepline)
//plot(show_all_fibonacci_levels and show_extensions ? upper_2500 : na, color=color.new(intermediate_target_level_color, 40), linewidth=level_size, title='250.0%', style=plot.style_stepline)
plot(show_extensions ? upper_2618 : na, color=color.new(key_target_level_color, 40), linewidth=level_size, title='261.8%', style=plot.style_stepline)
//plot(show_all_fibonacci_levels and show_extensions ? upper_2786 : na, color=color.new(intermediate_target_level_color, 40), linewidth=level_size, title='278.6%', style=plot.style_stepline)
plot(show_extensions ? upper_3000 : na, color=color.new(atr_target_level_color, 40), linewidth=level_size, title='300%', style=plot.style_stepline)

Opening Range Breakout (ORB) with Fib RetracementOverview
“ORB with Fib Retracement” is a Pine Script indicator that anchors a full Fibonacci framework to the first minutes of the trading day (the opening-range breakout, or ORB).
After the ORB window closes the script:
Locks-in that session’s high and low.
Calculates a complete ladder of Fibonacci retracement levels between them (0 → 100 %).
Projects symmetric extension levels above and below the range (±1.618, ±2.618, ±3.618, ±4.618 by default).
Sub-divides every extension slice with additional 23.6 %, 38.2 %, 50 %, 61.8 % and 78.6 % mid-lines so each “zone” has its own inner fib grid.
Plots the whole structure and—optionally—extends every line into the future for ongoing reference.
**Session time / timezone** – Defines the ORB window (defaults 09:30–09:45 EST).
**Show All Fib Levels** – Toggles every retracement and extension line on or off.
**Show Extended Lines** – Draws dotted, extend-right projections of every level.
**Color group** – Assigns colors to buy-side (green), sell-side (red), and internal fibs (gray).
**Extension value inputs** – Allows custom +/- 1.618 to 4.618 fib levels for personalized projection zones.

Market Structure + VIX long & shortThis indicator is an indicator for the dominance of Bigs long and short trading. I added all the indicators of CNN's put call ratio, cpc, and pcce. Bigs long is dangerous, so take a conservative approach with LL or HL, and use it for alert purposes. If possible, try to check CNN's put call ratio directly. The Bigs Short indicator is quite useful. In particular, strong short signals will be useful.

Previous 2 Days High/LowCan you give me a summary of this indicator
The "Previous 2 Days High/Low" indicator, written in Pine Script v5 for TradingView, plots horizontal lines representing the combined high and low prices of the previous two trading days on a chart. Here's a summary of its functionality, purpose, and key features:
Purpose
The indicator helps traders identify significant price levels by displaying the highest high and lowest low from the previous two days, which can act as potential support or resistance levels. These levels are plotted as lines that extend across the current trading day, making it easier to visualize key price zones for trading decisions.
Key Features
Calculates Combined High and Low:
Retrieves the high and low prices of the previous day and the day before using request.security on the daily timeframe ("D").
Computes the combined high as the maximum of the two days' highs and the combined low as the minimum of the two days' lows.
Dynamic Line Plotting:
Draws two horizontal lines:
Red Line: Represents the combined high, plotted at the highest price of the previous two days.
Green Line: Represents the combined low, plotted at the lowest price of the previous two days.
Lines are created at the start of a new trading day and extended to the right edge of the chart using line.set_x2, ensuring they span the entire current day.
Labels for Clarity:
Adds labels to the right of the chart, displaying the exact price values of the combined high ("Combined High: ") and combined low ("Combined Low: ").
Labels are updated to move with the lines, maintaining alignment at the current bar.
Clutter Prevention:
Deletes old lines and labels at the start of each new trading day to avoid overlapping or excessive objects on the chart.
Dynamic Requests:
Uses dynamic_requests=true in the indicator() function to allow request.security calls within conditional blocks (if ta.change(time("D"))), enabling daily data retrieval within the script's logic.
Vertical Lines at 8AM, 9AM, 8PM & 9PMVertical lines at 8am, 8pm, 9am and 9pm on SGT. Vertical lines at 8am, 8pm, 9am and 9pm on SGT. Vertical lines at 8am, 8pm, 9am and 9pm on SGT. Vertical lines at 8am, 8pm, 9am and 9pm on SGT. Vertical lines at 8am, 8pm, 9am and 9pm on SGT. Vertical lines at 8am, 8pm, 9am and 9pm on SGT. Vertical lines at 8am, 8pm, 9am and 9pm on SGT. Vertical lines at 8am, 8pm, 9am and 9pm on SGT. Vertical lines at 8am, 8pm, 9am and 9pm on SGT. Vertical lines at 8am, 8pm, 9am and 9pm on SGT. Vertical lines at 8am, 8pm, 9am and 9pm on SGT. Vertical lines at 8am, 8pm, 9am and 9pm on SGT. Vertical lines at 8am, 8pm, 9am and 9pm on SGT. Vertical lines at 8am, 8pm, 9am and 9pm on SGT. Vertical lines at 8am, 8pm, 9am and 9pm on SGT. Vertical lines at 8am, 8pm, 9am and 9pm on SGT. Vertical lines at 8am, 8pm, 9am and 9pm on SGT. Vertical lines at 8am, 8pm, 9am and 9pm on SGT. Vertical lines at 8am, 8pm, 9am and 9pm on SGT. Vertical lines at 8am, 8pm, 9am and 9pm on SGT. Vertical lines at 8am, 8pm, 9am and 9pm on SGT. Vertical lines at 8am, 8pm, 9am and 9pm on SGT.

Session SeparatorAn indicator that adds a vertical line for each of the following sessions start times:
Tokyo Session: 7pm EST
London Session: 3am EST
US Session: 8am EST
The purpose of this indicator is to have a minimalistic separation of the different time zones without cluttering the chart!

First Candle🕯️ First Candle Indicator (First 5-Minute Candle High/Low)
The First Candle indicator automatically marks the high and low of the first 5-minute candle of the U.S. trading session . These levels can act as key intraday support and resistance zones, often used in breakout, scalping, or opening-range trading strategies.
📌 Key Features:
Automatic detection of the first candle of the U.S. session based on the selected timeframe (default is 5 minutes).
Horizontal lines are plotted at the high and low of that candle, with fully customizable colors and thickness.
Labels show the exact level and timeframe used for the high and low.
Resets daily, removing previous session data at the start of a new session.
Displays a visual marker (blue triangle) when the first candle is detected.
Allows users to select different timeframes for defining the "first candle" (e.g., 1, 5, 15 minutes).
⚙️ Customizable Inputs:
Show First Candle Lines: toggle the display of high/low lines.
Timeframe for Marking: choose the timeframe to detect the first candle (e.g., 5 minutes).
High Line Color / Low Line Color: set the color of each level line.
Line Thickness: adjust the width of the lines (1 to 5 pixels).
🧠 Strategic Applications:
Identify breakout zones right after the market opens.
Define opening range for pullback or continuation setups.
Set clear reference levels for intraday trading decisions.

King 3EMA Trader CryptoShorter EMA Periods: The 13/55/21-period EMAs are more responsive than the original 21/89/34, better capturing the rapid price movements in BTC and ETH markets.
