40 Ticker Cross-Sectional Z-Scores [BackQuant]40 Ticker Cross-Sectional Z-Scores
BackQuant’s 40 Ticker Cross-Sectional Z-Scores is a powerful portfolio management strategy that analyzes the relative performance of up to 40 different assets, comparing them on a cross-sectional basis to identify the top and bottom performers. This indicator computes Z-scores for each asset based on their log returns and evaluates them relative to the mean and standard deviation over a rolling window. The Z-scores represent how far an asset's return deviates from the average, and these values are used to rank the assets, allowing for dynamic asset allocation based on performance.
By focusing on the strongest-performing assets and avoiding the weakest, this strategy aims to enhance returns while managing risk. Additionally, by adjusting for standard deviations, the system offers a risk-adjusted method of ranking assets, making it suitable for traders who want to dynamically allocate capital based on performance metrics rather than just price movements.
Key Features
1. Cross-Sectional Z-Score Calculation:
The system calculates Z-scores for 40 different assets, evaluating their log returns against the mean and standard deviation over a rolling window. This enables users to assess the relative performance of each asset dynamically, highlighting which assets are performing better or worse compared to their historical norms. The Z-score is a useful statistical tool for identifying outliers in asset performance.
2. Asset Ranking and Allocation:
The system ranks assets based on their Z-scores and allocates capital to the top performers. It identifies the top and bottom assets, and traders can allocate capital to the top-performing assets, ensuring that their portfolio is aligned with the best performers. Conversely, the bottom assets are removed from the portfolio, reducing exposure to underperforming assets.
3. Rolling Window for Mean and Standard Deviation Calculations:
The Z-scores are calculated based on rolling means and standard deviations, making the system adaptive to changing market conditions. This rolling calculation window allows the strategy to adjust to recent performance trends and minimize the impact of outdated data.
4. Mean and Standard Deviation Visualization:
The script provides real-time visualizations of the mean (x̄) and standard deviation (σ) of asset returns, helping traders quickly identify trends and volatility in their portfolio. These visual indicators are useful for understanding the current market environment and making more informed allocation decisions.
5. Top & Bottom Performer Tables:
The system generates tables that display the top and bottom performers, ranked by their Z-scores. Traders can quickly see which assets are outperforming and underperforming. These tables provide clear and actionable insights, helping traders make informed decisions about which assets to include in their portfolio.
6. Customizable Parameters:
The strategy allows traders to customize several key parameters, including:
Rolling Calculation Window: Set the window size for the rolling mean and standard deviation calculations.
Top & Bottom Tickers: Choose how many of the top and bottom assets to display and allocate capital to.
Table Orientation: Select between vertical or horizontal table formats to suit the user’s preference.
7. Forward Test & Out-of-Sample Testing:
The system includes out-of-sample forward tests, ensuring that the strategy is evaluated based on real-time performance, not just historical data. This forward testing approach helps validate the robustness of the strategy in dynamic market conditions.
8. Visual Feedback and Alerts:
The system provides visual feedback on the current asset rankings and allocations, with dynamic labels and plots on the chart. Additionally, users receive alerts when allocations change, keeping them informed of important adjustments.
9. Risk Management via Z-Scores and Std Dev:
The system’s approach to asset selection is based on Z-scores, which normalize performance relative to the historical mean. By incorporating standard deviation, it accounts for the volatility and risk associated with each asset. This allows for more precise risk management and portfolio construction.
10. Note on Mean Reversion Strategy:
If you take the inverse of the signals provided by this indicator, the strategy can be used for mean-reversion rather than trend-following. This would involve buying the underperforming assets and selling the outperforming ones. However, it's important to note that this approach does not work well with highly correlated assets, as the relationship between the assets could result in the same directional movement, undermining the effectiveness of the mean-reversion strategy.
References
www.uts.edu.au
onlinelibrary.wiley.com
www.cmegroup.com
Final Thoughts
The 40 Ticker Cross-Sectional Z-Scores strategy offers a data-driven approach to portfolio management, dynamically allocating capital based on the relative performance of assets. By using Z-scores and standard deviations, this strategy ensures that capital is directed to the strongest performers while avoiding weaker assets, ultimately improving the risk-adjusted returns of the portfolio. Whether you’re focused on trend-following or looking to explore mean-reversion strategies, this flexible system can be tailored to suit your investment goals.
Volatility

Performance Metrics With Bracketed Rebalacing [BackQuant]Performance Metrics With Bracketed Rebalancing
The Performance Metrics With Bracketed Rebalancing script offers a robust method for assessing portfolio performance, integrating advanced portfolio metrics with different rebalancing strategies. With a focus on adaptability, the script allows traders to monitor and adjust portfolio weights, equity, and other key financial metrics dynamically. This script provides a versatile approach for evaluating different trading strategies, considering factors like risk-adjusted returns, volatility, and the impact of portfolio rebalancing.
Please take the time to read the following:
Key Features and Benefits of Portfolio Methods
Bracketed Rebalancing:
Bracketed Rebalancing is an advanced strategy designed to trigger portfolio adjustments when an asset's weight surpasses a predefined threshold. This approach minimizes overexposure to any single asset while maintaining flexibility in response to market changes. The strategy is particularly beneficial for mitigating risks that arise from significant asset weight fluctuations. The following image illustrates how this method reacts when asset weights cross the threshold:
Daily Rebalancing:
Unlike the bracketed method, Daily Rebalancing adjusts portfolio weights every trading day, ensuring consistent asset allocation. This method aims for a more even distribution of portfolio weights, making it a suitable option for traders who prefer less sensitivity to individual asset volatility. Here's an example of Daily Rebalancing in action:
No Rebalancing:
For traders who prefer a passive approach, the "No Rebalancing" option allows the portfolio to remain static, without any adjustments to asset weights. This method may appeal to long-term investors or those who believe in the inherent stability of their selected assets. Here’s how the portfolio looks when no rebalancing is applied:
Portfolio Weights Visualization:
One of the standout features of this script is the visual representation of portfolio weights. With adjustable settings, users can track the current allocation of assets in real-time, making it easier to analyze shifts and trends. The following image shows the real-time weight distribution across three assets:
Rolling Drawdown Plot:
Managing drawdown risk is a critical aspect of portfolio management. The Rolling Drawdown Plot visually tracks the drawdown over time, helping traders monitor the risk exposure and performance relative to the peak equity levels. This feature is essential for assessing the portfolio's resilience during market downturns:
Daily Portfolio Returns:
Tracking daily returns is crucial for evaluating the short-term performance of the portfolio. The script allows users to plot daily portfolio returns to gain insights into daily profit or loss, helping traders stay updated on their portfolio’s progress:
Performance Metrics
Net Profit (%):
This metric represents the total return on investment as a percentage of the initial capital. A positive net profit indicates that the portfolio has gained value over the evaluation period, while a negative value suggests a loss. It's a fundamental indicator of overall portfolio performance.
Maximum Drawdown (Max DD):
Maximum Drawdown measures the largest peak-to-trough decline in portfolio value during a specified period. It quantifies the most significant loss an investor would have experienced if they had invested at the highest point and sold at the lowest point within the timeframe. A smaller Max DD indicates better risk management and less exposure to significant losses.
Annual Mean Returns (% p/y):
This metric calculates the average annual return of the portfolio over the evaluation period. It provides insight into the portfolio's ability to generate returns on an annual basis, aiding in performance comparison with other investment opportunities.
Annual Standard Deviation of Returns (% p/y):
This measure indicates the volatility of the portfolio's returns on an annual basis. A higher standard deviation signifies greater variability in returns, implying higher risk, while a lower value suggests more stable returns.
Variance:
Variance is the square of the standard deviation and provides a measure of the dispersion of returns. It helps in understanding the degree of risk associated with the portfolio's returns.
Sortino Ratio:
The Sortino Ratio is a variation of the Sharpe Ratio that only considers downside risk, focusing on negative volatility. It is calculated as the difference between the portfolio's return and the minimum acceptable return (MAR), divided by the downside deviation. A higher Sortino Ratio indicates better risk-adjusted performance, emphasizing the importance of avoiding negative returns.
Sharpe Ratio:
The Sharpe Ratio measures the portfolio's excess return per unit of total risk, as represented by standard deviation. It is calculated by subtracting the risk-free rate from the portfolio's return and dividing by the standard deviation of the portfolio's excess return. A higher Sharpe Ratio indicates more favorable risk-adjusted returns.
Omega Ratio:
The Omega Ratio evaluates the probability of achieving returns above a certain threshold relative to the probability of experiencing returns below that threshold. It is calculated by dividing the cumulative probability of positive returns by the cumulative probability of negative returns. An Omega Ratio greater than 1 indicates a higher likelihood of achieving favorable returns.
Gain-to-Pain Ratio:
The Gain-to-Pain Ratio measures the return per unit of risk, focusing on the magnitude of gains relative to the severity of losses. It is calculated by dividing the total gains by the total losses experienced during the evaluation period. A higher ratio suggests a more favorable balance between reward and risk.
www.linkedin.com
Compound Annual Growth Rate (CAGR) (% p/y):
CAGR represents the mean annual growth rate of the portfolio over a specified period, assuming the investment has been compounding over that time. It provides a smoothed annual rate of growth, eliminating the effects of volatility and offering a clearer picture of long-term performance.
Portfolio Alpha (% p/y):
Portfolio Alpha measures the portfolio's performance relative to a benchmark index, adjusting for risk. It is calculated using the Capital Asset Pricing Model (CAPM) and represents the excess return of the portfolio over the expected return based on its beta and the benchmark's performance. A positive alpha indicates outperformance, while a negative alpha suggests underperformance.
Portfolio Beta:
Portfolio Beta assesses the portfolio's sensitivity to market movements, indicating its exposure to systematic risk. A beta greater than 1 suggests the portfolio is more volatile than the market, while a beta less than 1 indicates lower volatility. Beta is used to understand the portfolio's potential for gains or losses in relation to market fluctuations.
Skewness of Returns:
Skewness measures the asymmetry of the return distribution. A positive skew indicates a distribution with a long right tail, suggesting more frequent small losses and fewer large gains. A negative skew indicates a long left tail, implying more frequent small gains and fewer large losses. Understanding skewness helps in assessing the likelihood of extreme outcomes.
Value at Risk (VaR) 95th Percentile:
VaR at the 95th percentile estimates the maximum potential loss over a specified period, given a 95% confidence level. It provides a threshold value such that there is a 95% probability that the portfolio will not experience a loss greater than this amount.
Conditional Value at Risk (CVaR):
CVaR, also known as Expected Shortfall, measures the average loss exceeding the VaR threshold. It provides insight into the tail risk of the portfolio, indicating the expected loss in the worst-case scenarios beyond the VaR level.
These metrics collectively offer a comprehensive view of the portfolio's performance, risk exposure, and efficiency. By analyzing these indicators, investors can make informed decisions, balancing potential returns with acceptable levels of risk.
Conclusion
The Performance Metrics With Bracketed Rebalancing script provides a comprehensive framework for evaluating and optimizing portfolio performance. By integrating advanced metrics, adaptive rebalancing strategies, and visual analytics, it empowers traders to make informed decisions in managing their investment portfolios. However, it's crucial to consider the implications of rebalancing strategies, as academic research indicates that predictable rebalancing can lead to market impact costs. Therefore, adopting flexible and less predictable rebalancing approaches may enhance portfolio performance and reduce associated costs.

Heikin-Ashi Mean Reversion Oscillator [Alpha Extract]The Heikin-Ashi Mean Reversion Oscillator combines the smoothing characteristics of Heikin-Ashi candlesticks with mean reversion analysis to create a powerful momentum oscillator. This indicator applies Heikin-Ashi transformation twice - first to price data and then to the oscillator itself - resulting in smoother signals while maintaining sensitivity to trend changes and potential reversal points.
🔶 CALCULATION
Heikin-Ashi Transformation: Converts regular OHLC data to smoothed Heikin-Ashi values
Component Analysis: Calculates trend strength, body deviation, and price deviation from mean
Oscillator Construction: Combines components with weighted formula (40% trend strength, 30% body deviation, 30% price deviation)
Double Smoothing: Applies EMA smoothing and second Heikin-Ashi transformation to oscillator values
Signal Generation: Identifies trend changes and crossover points with overbought/oversold levels
Formula:
HA Close = (Open + High + Low + Close) / 4
HA Open = (Previous HA Open + Previous HA Close) / 2
Trend Strength = Normalized consecutive HA candle direction
Body Deviation = (HA Body - Mean Body) / Mean Body * 100
Price Deviation = ((HA Close - Price Mean) / Price Mean * 100) / Standard Deviation * 25
Raw Oscillator = (Trend Strength * 0.4) + (Body Deviation * 0.3) + (Price Deviation * 0.3)
Final Oscillator = 50 + (EMA(Raw Oscillator) / 2)
🔶 DETAILS Visual Features:
Heikin-Ashi Candlesticks: Smoothed oscillator representation using HA transformation with vibrant teal/red coloring
Overbought/Oversold Zones: Horizontal lines at customizable levels (default 70/30) with background highlighting in extreme zones
Moving Averages: Optional fast and slow EMA overlays for additional trend confirmation
Signal Dashboard: Real-time table showing current oscillator status (Overbought/Oversold/Bullish/Bearish) and buy/sell signals
Reference Lines: Middle line at 50 (neutral), with 0 and 100 boundaries for range visualization
Interpretation:
Above 70: Overbought conditions, potential selling opportunity
Below 30: Oversold conditions, potential buying opportunity
Bullish HA Candles: Green/teal candles indicate upward momentum
Bearish HA Candles: Red candles indicate downward momentum
MA Crossovers: Fast EMA above slow EMA suggests bullish momentum, below suggests bearish momentum
Zone Exits: Price moving out of extreme zones (above 70 or below 30) often signals trend continuation
🔶 EXAMPLES
Mean Reversion Signals: When the oscillator reaches extreme levels (above 70 or below 30), it identifies potential reversal points where price may revert to the mean.
Example: Oscillator reaching 80+ levels during strong uptrends often precedes short-term pullbacks, providing profit-taking opportunities.
Trend Change Detection: The double Heikin-Ashi smoothing helps identify genuine trend changes while filtering out market noise.
Example: When oscillator HA candles change from red to teal after oversold readings, this confirms potential trend reversal from bearish to bullish.
Moving Average Confirmation: Fast and slow EMA crossovers on the oscillator provide additional confirmation of momentum shifts.
Example: Fast EMA crossing above slow EMA while oscillator is rising from oversold levels provides strong bullish confirmation signal.
Dashboard Signal Integration: The real-time dashboard combines oscillator status with directional signals for quick decision-making.
Example: Dashboard showing "Oversold" status with "BUY" signal when HA candles turn bullish provides clear entry timing.
🔶 SETTINGS
Customization Options:
Calculation: Oscillator period (default 14), smoothing factor (1-50, default 2)
Levels: Overbought threshold (50-100, default 70), oversold threshold (0-50, default 30)
Moving Averages: Toggle display, fast EMA length (default 9), slow EMA length (default 21)
Visual Enhancements: Show/hide signal dashboard, customizable table position
Alert Conditions: Oversold bounce, overbought reversal, bullish/bearish MA crossovers
The Heikin-Ashi Mean Reversion Oscillator provides traders with a sophisticated momentum tool that combines the smoothing benefits of Heikin-Ashi analysis with mean reversion principles. The double transformation process creates cleaner signals while the integrated dashboard and multiple confirmation methods help traders identify high-probability entry and exit points during both trending and ranging market conditions.

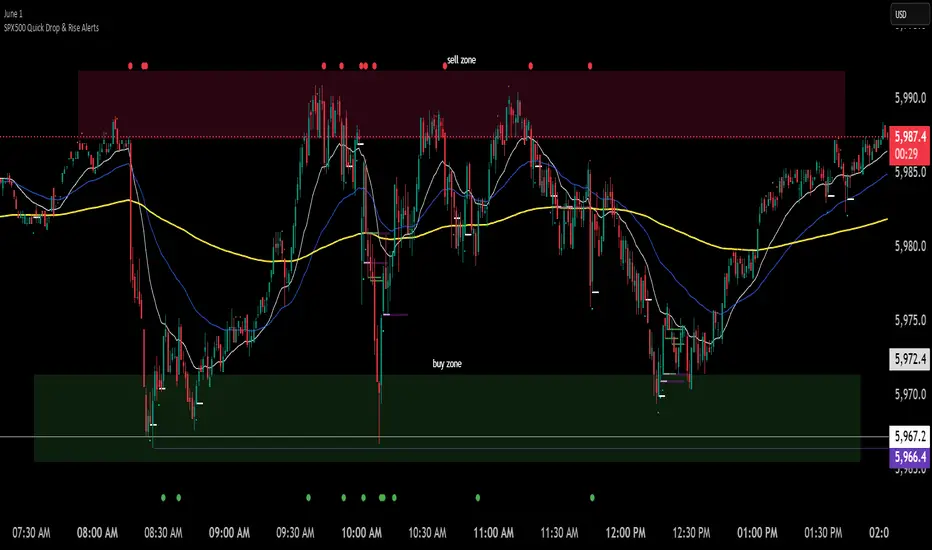
SPX500 Quick Drop & Rise AlertsSimple script thats been adjusted for 1 minute trading on spx500.
It will show you and signal to you:
dropThreshold: how much the price must rise or fall (in percent) to trigger a signal. Default is 0.05 → 5%.
lookbackBars: how many bars back to compare against. Default is 1 (i.e., compare the current close to the previous bar’s close).
Theirs a few ways to use this, you might want to use your MA 238 as a reference point. Use it as a target or a level to bounce or reject from. Then use this indicator to help show you where the market energy is flowing.
Do some backtesting and see what you see. Only use it for New York open times would probably be best.
Youll have to change your mentality depending on if the market is trending / ranging ect of course.
Standard Deviation ExpectationStandard Deviation Expectation
- First off I want to thank and give credit to #Stockmarketupdate for introducing this idea to me while stumbling across his script for plotting the standard deviation above each candle/price.
Applying Standard Deviation Expectation can aide traders with insight to price projection, expectation, as well as, give hint to price exhaustion.
This indicator helps you identify dynamic support and resistance levels based on price volatility — specifically using standard deviation — on your chosen time frame or a higher time frame (multi-time frame).
It calculates a range around recent price action that adapts based on how volatile the market is.
It plots three lines:
Resistance line (upper boundary)
Support line (lower boundary)
Mid-line (middle of support and resistance)
It colors the area between support and resistance green or red depending on whether the current price is above or below the mid-line.
It alerts you when price crosses the mid-line either upward or downward.
Explanation of Components
Standard deviation is a statistical measure that tells you how much prices vary from the average.
This script calculates Standard Dev. on a selected price source (usually close price) over a specified length (default 8 bars).
Then it multiplies this by a “multiplier” (default 1.75) to set how wide the expected range should be.
More volatility → wider range; less volatility → tighter range.
2. Multi-Timeframe (MTF) Input
You can select a different timeframe (like 1H, 4H, daily) to base calculations on, even if you’re viewing a lower timeframe chart (like 15 min).
This helps smooth out noise and get more meaningful levels from higher timeframes.
3. Calculating Deviation High and Low
Based on whether the higher timeframe candle is bearish or bullish, the indicator adjusts the expected high and low by adding or subtracting the standard deviation.
This creates a dynamic “band” or range around the price on the higher timeframe.
4. Support and Resistance Lines
It calculates the highest deviation high and the lowest deviation low over a look-back period.
Then it smooths these extremes using an Exponential Moving Average (EMA) to avoid choppy lines.
The result is two smooth, adaptive lines — resistance and support.
5. Mid-line
Simply the average of the support and resistance lines.
Acts as a pivot or equilibrium point between support and resistance.
6. Offset
Allows you to shift the lines forwards by a number of bars, which can help with visual alignment or back-testing.
7. Color Fill
The space between support and resistance is filled with a transparent green color if price is above the midline, red if below.
This gives a quick visual cue of bullish or bearish bias.
8. Alerts on Midline Cross
The indicator generates alert conditions when price crosses the midline:
Crosses above → possible bullish sign
Crosses below → possible bearish sign
You can set alerts in Trading-view using these to get notified.
*Don’t rely solely on this indicator. Use it alongside price action and other indicators.
Play with the multiplier and length inputs to see what fits your trading style and the asset’s volatility.
The multi-time frame option is powerful — try using daily or 4H on a 15-min chart to get smoother levels.
Use alerts for mid-line crosses to help you catch potential trade setups without staring at the screen constantly. *
Disclaimer: The information contained in this script does not constitute financial advice or a solicitation to buy or sell any securities of any type. I will not accept liability for any loss or damage, including without limitation any loss of profit, which may arise directly or indirectly from the use of or reliance on such information.
All investments involve risk, and the past performance of a security, industry, sector, market, financial product, trading strategy, back-test, or individual's trading does not guarantee future results or returns. Investors are fully responsible for any investment decisions they make. Such decisions should be based solely on an evaluation of their financial circumstances, investment objectives, risk tolerance, and liquidity needs.
This script was produced for educational purposes!
Enjoy!
Vix_Fix Enhanced MTF [Cometreon]The VIX Fix Enhanced is designed to detect market bottoms and spikes in volatility, helping traders anticipate major reversals with precision. Unlike standard VIX Fix tools, this version allows you to control the standard deviation logic, switch between chart styles, customize visual outputs, and set up advanced alerts — all with no repainting.
🧠 Logic and Calculation
This indicator is based on Larry Williams' VIX Fix and integrates features derived from community requests/advice, such as inverse VIX logic.
It calculates volatility spikes using a customizable standard deviation of the lows and compares it to a moving high to identify potential reversal points.
All moving average logic is based on Cometreon's proprietary library, ensuring accurate and optimized calculations on all 15 moving average types.
🔷 New Features and Improvements
🟩 Custom Visual Styles
Choose how you want your VIX data displayed:
Line
Step Line
Histogram
Area
Column
You can also flip the orientation (bottom-up or top-down), change the source ticker, and tailor the display to match your charting preferences.
🟩 Multi-MA Standard Deviation Calculation
Customize the standard deviation formula by selecting from 15 different moving averages:
SMA (Simple Moving Average)
EMA (Exponential Moving Average)
WMA (Weighted Moving Average)
RMA (Smoothed Moving Average)
HMA (Hull Moving Average)
JMA (Jurik Moving Average)
DEMA (Double Exponential Moving Average)
TEMA (Triple Exponential Moving Average)
LSMA (Least Squares Moving Average)
VWMA (Volume-Weighted Moving Average)
SMMA (Smoothed Moving Average)
KAMA (Kaufman’s Adaptive Moving Average)
ALMA (Arnaud Legoux Moving Average)
FRAMA (Fractal Adaptive Moving Average)
VIDYA (Variable Index Dynamic Average)
This gives you fine control over how volatility is measured and allows tuning the sensitivity for different market conditions.
🟩 Full Control Over Percentile and Deviation Conditions
You can enable or disable lines for standard deviation and percentile conditions, and define whether you want to trigger on over or under levels — adapting the indicator to your exact logic and style.
🟩 Chart Type Selection
You're no longer limited to candlestick charts! Now you can use Vix_Fix with different chart formats, including:
Candlestick
Heikin Ashi
Renko
Kagi
Line Break
Point & Figure
🟩 Multi-Timeframe Compatibility Without Repainting
Use a different timeframe from your chart with confidence. Signals remain stable and do not repaint. Perfect for spotting long-term reversal setups on lower timeframes.
🟩 Alert System Ready
Configure alerts directly from the indicator’s panel when conditions for over/under signals are met. Stay informed without needing to monitor the chart constantly.
🔷 Technical Details and Customizable Inputs
This indicator includes full control over the logic and appearance:
1️⃣ Length Deviation High - Adjusts the lookback period used to calculate the high deviation level of the VIX logic. Shorter values make it more reactive; longer values smooth out the signal.
2️⃣ Ticker - Choose a different chart type for the calculation, including Heikin Ashi, Renko, Kagi, Line Break, and Point & Figure.
3️⃣ Style VIX - Change the visual style (Line, Histogram, Column, etc.), adjust line width, and optionally invert the display (bottom-to-top).
📌 Fill zones for deviation and percentile are active only in Line and Step Line modes
4️⃣ Use Standard Deviation Up / Down - Enable the overbought and oversold zone logic based on upper and lower standard deviation bands.
5️⃣ Different Type MA (for StdDev) - Choose from 15 different moving averages to define the calculation method for standard deviation (SMA, EMA, HMA, JMA, etc.), with dedicated parameters like Phase, Sigma, and Offset for optimized responsiveness.
6️⃣ BB Length & Multiplier - Adjust the period and multiplier for the standard deviation bands, similar to how Bollinger Bands work.
7️⃣ Show StdDev Up / Down Line - Enable or disable the visibility of upper and lower standard deviation boundaries.
8️⃣ Use Percentile & Length High - Activate the percentile-based logic to detect extreme values in historical volatility using a customizable lookback length.
9️⃣ Highest % / Lowest % - Set the high and low percentile thresholds (e.g., 85 for high, 99 for low) that will be used to trigger over/under signals.
🔟 Show High / Low Percentile Line - Toggle the visual display of the percentile boundaries directly on the chart for clearer signal reference.
1️⃣1️⃣ Ticker Settings – Customize parameters for special chart types such as Renko, Heikin Ashi, Kagi, Line Break, and Point & Figure, adjusting reversal, number of lines, ATR length, etc.
1️⃣2️⃣ Timeframe – Enables using SuperTrend on a higher timeframe.
1️⃣3️⃣ Wait for Timeframe Closes -
✅ Enabled – Displays Vix_Fix smoothly with interruptions.
❌ Disabled – Displays Vix_Fix smoothly without interruptions.
☄️ If you find this indicator useful, leave a Boost to support its development!
Every feedback helps to continuously improve the tool, offering an even more effective trading experience. Share your thoughts in the comments! 🚀🔥

time-specific standard devs [keypoems]Time-Specific Net Change Percentage Standard Deviations Extensions
A candlestick is the story of how price moved during a single period: it opens, explores a high and a low, and finally closes.
The indicator asks one question:
“By what percentage did price change from open to close?”
That single percentage value – called the net-change % – is the raw material for everything that follows.
Why net-change % matters
If you collect that percentage for thousands of finished candles (daily candles, 1-hour, 4-hour – whatever you close) you get a probability distribution: most candles move only a little, a few move a lot. When you plot those percentages you get the familiar bell-curve. From any bell-curve you can read two key statistics:
Mean – the “typical” net-change.
Standard Deviation (σ) – how far a candle normally wanders from that mean.
A well-known property of a bell-curve is that ≈68 % of all observations stay between –1 σ and +1 σ, and ≈95 % stay within ±2 σ.
For traders that translates into a probabilistic map of where an unfinished candle is likely to close.
What the indicator draws
Open-anchored levels
Every box is centred on the candle’s open price.
The indicator draws boxes that mark +σ, +½ σ, –½ σ, –σ … as selected in the Inputs.
Time-specific calculation
Instead of mixing all 1-hour candles together, the script isolates only the 09:00-10:00 New-York hour (or any other slot you are at that moment) and builds a bell-curve from that subset.
The result is a set of expectations truly tailored to that exact hour’s behaviour.
Generic and Specific Std Dev Box
Indicator computes both generic levels – the classic “all candles aggregated” standard deviations, and specific levels – the refined, hour-by-hour (or 4-hour-by-4-hour, etc.) deviations.
The indicator shows Boxes that represent both aggregated values and "per period" standard deviation projection levels.
Mirrored levels (optional)
Negative σ levels are drawn automatically so you have symmetrical upside & downside projections.
Math behind the scenes
For each chosen higher-timeframe (HTF):
Collect the last N net-change % values (user-defined look-back, default 5 000 candles).
Compute:
μ = mean(net-change %)
σ = stdev(net-change %)
Project prices:
LevelPrice = Open × (1 + k × σ)
where k is 0 , ±0.5 , ±1 , ±1.5 … as enabled in the inputs.
Because everything is done in percentage space the technique adapts automatically to instruments that trade at very different absolute prices (equities, futures, crypto, FX).
How to read it in real time
When a developing candle races straight into +1 σ with plenty of time left, statistics say “68 % of the time it will finish back inside the box.”
A tag of +2 σ is an even rarer event (~5 % probability) – a natural place to look for exhaustion or take-profit cues.
Conversely, if price refuses to reverse at +1 σ and instead sticks above that edge, it is signalling an unusually strong session and may warrant trend-continuation tactics.
Key Inputs
Higher Timeframe Choose 5m to H8 reference frame
Show levels for last X periods
Look-back length Sample size for σ
StdDev Fibs Fib1 … Fib9 toggles & values: Decide which σ multiples to plot
Mirror levels Draw matching negative projections
Extend boxes Keep boxes visible beyond their candle
Best-practice usage
Combine with structure – treat σ edges as context, not automatic entry.
Mind the sample size – if you choose extremely narrow windows (e.g., Sunday 18:00-19:00 futures open) make sure your look-back still captures hundreds of cases.
Disclaimer
Trading involves risk. The author and this indicator simply display historical probability ranges; they do not assure profits or prevent losses. Always perform your own due diligence and, if necessary, consult a licensed financial professional before dealing in any financial instrument.

Options Volatility Strategy Analyzer [TradeDots]The Options Volatility Strategy Analyzer is a specialized tool designed to help traders assess market conditions through a detailed examination of historical volatility, market benchmarks, and percentile-based thresholds. By integrating multiple volatility metrics (including VIX and VIX9D) with color-coded regime detection, the script provides users with clear, actionable insights for selecting appropriate options strategies.
📝 HOW IT WORKS
1. Historical Volatility & Percentile Calculations
Annualized Historical Volatility (HV): The script automatically computes the asset’s historical volatility using log returns over a user-defined period. It then annualizes these values based on the chart’s timeframe, helping you understand the asset’s typical volatility profile.
Dynamic Percentile Ranks: To gauge where the current volatility level stands relative to past behavior, historical volatility values are compared against short, medium, and long lookback periods. Tracking these percentile ranks allows you to quickly see if volatility is high or low compared to historical norms.
2. Multi-Market Benchmark Comparison
VIX and VIX9D Integration: The script tracks market volatility through the VIX and VIX9D indices, comparing them to the asset’s historical volatility. This reveals whether the asset’s volatility is outpacing, lagging, or remaining in sync with broader market volatility conditions.
Market Context Analysis: A built-in term-structure check can detect market stress or relative calm by measuring how VIX compares to shorter-dated volatility (VIX9D). This helps you decide if the present environment is risk-prone or relatively stable.
3. Volatility Regime Detection
Color-Coded Background: The analyzer assigns a volatility regime (e.g., “High Asset Vol,” “Low Asset Vol,” “Outpacing Market,” etc.) based on current historical volatility percentile levels and asset vs. market ratios. A color-coded background highlights the regime, enabling traders to quickly interpret the market’s mood.
Alerts on Regime Changes & Spikes: Automated alerts warn you about any significant expansions or contractions in volatility, allowing you to react swiftly in changing conditions.
4. Strategy Forecast Table
Real-Time Strategy Suggestions: At the close of each bar, an on-chart table generates suggested options strategies (e.g., selling premium in high volatility or buying premium in low volatility). These suggestions provide a quick summary of potential tactics suited to the current regime.
Contextual Market Data: The table also displays key statistics, such as VIX levels, asset historical volatility percentile, or ratio comparisons, helping you confirm whether volatility conditions warrant more conservative or more aggressive strategies.
🛠️ HOW TO USE
1. Select Your Timeframe: The script supports multiple timeframes. For short-term trading, intraday charts often reveal faster shifts in volatility. For swing or position trading, daily or weekly charts may be more stable and produce fewer false signals.
2. Check the Volatility Regime: Observe the background color and on-chart labels to identify the current regime (e.g., “HIGH ASSET VOL,” “LOW VOL + LAGGING,” etc.).
3. Review the Forecast Table: The table suggests strategy ideas (e.g., iron condors, long straddles, ratio spreads) depending on whether volatility is elevated, subdued, or spiking. Use these as a starting point for designing trades that match your risk tolerance.
4. Combine with Additional Analysis: For optimal results, confirm signals with your broader trading plan, technical tools (moving averages, price action), and fundamental research. This script is most effective when viewed as one component in a comprehensive decision-making process.
❗️LIMITATIONS
Directional Neutrality: This indicator analyzes volatility environments but does not predict price direction (up/down). Traders must combine with directional analysis for complete strategy selection.
Late or Missed Signals: Since all calculations require a bar to close, sharp intrabar volatility moves may not appear in real-time.
False Positives in Choppy Markets: Rapid changes in percentile ranks or VIX movements can generate conflicting or premature regime shifts.
Data Sensitivity: Accuracy depends on the availability and stability of volatility data. Significant gaps or unusual market conditions may skew results.
Market Correlation Assumptions: The system assumes assets generally correlate with S&P 500 volatility patterns. May be less effective for:
Small-cap stocks with unique volatility drivers
International stocks with different market dynamics
Sector-specific events disconnected from broad market
Cryptocurrency-related assets with independent volatility patterns
RISK DISCLAIMER
Options trading involves substantial risk and is not suitable for all investors. Options strategies can result in significant losses, including the total loss of premium paid. The complexity of options strategies requires thorough understanding of the risks involved.
This indicator provides volatility analysis for educational and informational purposes only and should not be considered as investment advice. Past volatility patterns do not guarantee future performance. Market conditions can change rapidly, and volatility regimes may shift without warning.
No trading system can guarantee profits, and all trading involves the risk of loss. The indicator's regime classifications and strategy suggestions should be used as part of a comprehensive trading plan that includes proper risk management, directional analysis, and consideration of broader market conditions.

BBS – Bond Breadth Signal"When bonds scream, breadth collapses, and fear spikes — BBS listens."
🧠 BBS – Bond Breadth Signal
A reversal timing tool built on macro conviction, not price noise.
The Bond Breadth Signal (BBS) was developed to identify major market inflection points by combining four key market stress indicators:
1) 10-Year Yield ROC – Measures sharp moves in the bond market
2) Z-Score of the 10Y – Captures statistical extremes
3) NSHF (Net Highs–Lows) – Signals internal market strength or weakness
4) TLT ROC + VIX – Confirmations of flight to safety and volatility-driven fear
When all conditions align, BBS marks either a For-Sure Buy or For-Sure Sell — these are rare, high-confidence signals designed to cut through noise and focus on true market dislocations.
🔧 Features:
-Background color and signal arrows on confirmation days
-Signals remain visually active for 3 days for added clarity
-Fully adjustable thresholds and alert toggles
-Plot panel for yield, TLT, NSHF, VIX, and Z-score visuals
This tool isn’t designed to fire every day. It’s meant to wait for those moments when the market truly bends — not just wiggles.
Best used on major indices (SPY, QQQ, IWM) to assess macro turning points.

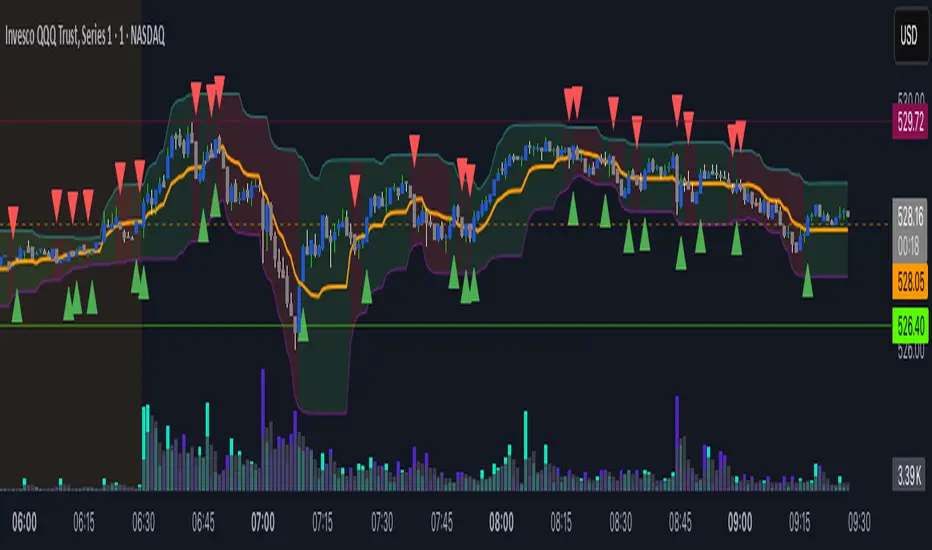
OA - SMESSmart Money Entry Signals (SMES)
The SMES indicator is developed to identify potential turning points in market behavior by analyzing internal price dynamics, rather than relying on external volume or sentiment data. It leverages normalized price movement, directional volatility, and smoothing algorithms to detect potential areas of accumulation or distribution by market participants.
Core Concepts
Smart Money Flow calculation based on normalized price positioning
Directional VHF (Vertical Horizontal Filter) used to enhance signal directionality
Overbought and Oversold regions defined with optional glow visualization
Entry and Exit signals based on dynamic crossovers
Highly customizable input parameters for precision control
Key Inputs
Smart Money Flow Period
Smoothing Period
Price Analysis Length
Fibonacci Lookback Length
Visual toggle options (zones, glow effects, signal display)
Usage
This tool plots the smoothed smart money flow as a standalone oscillator, designed to help traders identify potential momentum shifts or extremes in market sentiment. Entry signals are generated through crossover logic, while optional filters based on price behavior can refine those signals. Exit signals are shown when the smart money line exits extreme regions.
Important Notes
This indicator does not repaint
Works on all timeframes and instruments
Best used as a confirmation tool with other technical frameworks
All calculations are based strictly on price data
Disclaimer
This script is intended for educational purposes only. It does not provide financial advice or guarantee performance. Please do your own research and apply appropriate risk management before making any trading decisions.

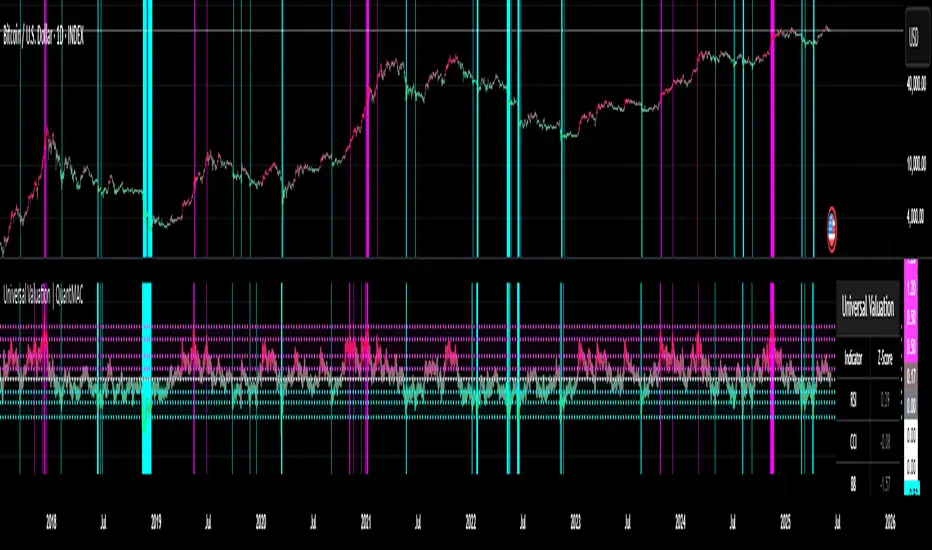
Universal Valuation | QuantMAC🎯 Universal Valuation | QuantMAC
🚀 Professional-Grade Valuation Engine with 14+ Technical Components
The Universal Valuation indicator is a sophisticated composite analysis tool that combines multiple technical indicators, statistical measures, and risk ratios to provide a comprehensive assessment of asset valuation across all market conditions and timeframes.
📊 Core Architecture & Methodology
🔬 Z-Score Normalization System
Each component is normalized using statistical Z-scores, which measure how many standard deviations a value is from its historical mean. This standardization allows different indicators to be combined meaningfully:
Positive Z-scores indicate values above historical average (potentially overvalued)
Negative Z-scores indicate values below historical average (potentially undervalued)
Individual lookback periods for each component ensure optimal sensitivity
Real-time statistical calculations with dynamic standard deviation adjustments
📈 Composite Scoring Algorithm
The final valuation score is calculated as the weighted average of all enabled components, providing a unified view of market conditions while maintaining granular control over individual inputs.
🛠️ Technical Components Breakdown
📊 Momentum & Oscillator Components
🎯 RSI (Relative Strength Index)
Function: Measures price momentum and overbought/oversold conditions
Default Settings: 21-period RSI with 150-period Z-score normalization
Analysis: Values above 70 (traditional) become positive Z-scores, indicating potential overvaluation
Edge: Z-score normalization adapts to changing market volatility unlike fixed thresholds
🌊 CCI (Commodity Channel Index)
Function: Identifies cyclical price patterns and extreme price levels
Default Settings: 30-period CCI with 150-period Z-score normalization
Analysis: Measures price deviation from statistical mean using typical price (HLC/3)
Edge: Excellent for identifying price extremes in trending and ranging markets
🔵 Chande Momentum Oscillator
Function: Advanced momentum indicator using sum of gains vs. sum of losses
Default Settings: 50-period calculation with 50-period Z-score normalization
Analysis: Formula: 100 * (Sum_Gains - Sum_Losses) / (Sum_Gains + Sum_Losses)
Edge: Less prone to whipsaws compared to RSI, better momentum persistence detection
🎭 IMI (Intraday Momentum Index)
Function: Combines RSI concept with intraday price action analysis
Default Settings: 100-period calculation with 150-period Z-score normalization
Analysis: Uses gains/losses based on close vs. open rather than close-to-close
Edge: Captures intraday sentiment and gap behavior effectively
📈 Price Action & Trend Components
📊 Bollinger Bands Position
Function: Measures price position relative to volatility-adjusted bands
Default Settings: 30-period bands with 50-period Z-score normalization
Analysis: (Price - SMA) / (2 * Standard_Deviation) normalized to Z-score
Edge: Adapts to volatility changes, providing context-aware overbought/oversold levels
💹 Price Z-Score
Function: Direct statistical analysis of price deviation from historical mean
Default Settings: 150-period lookback for Z-score calculation
Analysis: Pure price momentum without indicator lag or smoothing
Edge: Unfiltered price analysis, excellent for mean reversion strategies
📊 Disparity Index
Function: Measures percentage deviation of price from its moving average
Default Settings: 10-period SMA with 150-period Z-score normalization
Analysis: 100 * (Price - SMA) / SMA, then normalized to Z-score
Edge: Highly sensitive to short-term price deviations, excellent for timing entries
🎯 TEMA (Triple Exponential Moving Average)
Function: Advanced moving average with reduced lag and improved responsiveness
Default Settings: 10-period TEMA with 150-period Z-score normalization
Analysis: Triple-smoothed EMA that maintains trend-following capability with less noise
Edge: Superior trend identification with minimal lag compared to traditional MAs
📊 Volume & Market Structure Components
📈 VWAP (Volume Weighted Average Price)
Function: Incorporates volume into price analysis for institutional perspective
Default Settings: Standard VWAP with 300-period Z-score normalization
Analysis: Compares current price to volume-weighted institutional benchmark
Edge: Reveals institutional sentiment and identifies fair value zones
⚡ Intraday Momentum
Function: Measures session-based momentum using open-to-close movement
Default Settings: (Close - Open) / Open * 100 with 250-period Z-score normalization
Analysis: Captures daily sentiment and gap behavior in percentage terms
Edge: Excellent for intraday trading and gap analysis strategies
🎲 Advanced Statistical Components
🌊 Hurst Exponent (Optional)
Function: Measures market efficiency and trend persistence characteristics
Default Settings: 100-period calculation with 200-period Z-score normalization
Analysis: Values > 0.5 indicate trending markets, < 0.5 indicate mean-reverting markets
Edge: Identifies market regime changes and optimal strategy selection
Note: Computationally intensive, disabled by default for performance
📊 Risk-Adjusted Performance Ratios
⚡ Sharpe Ratio
Function: Risk-adjusted return measurement using total volatility
Default Settings: 400-period calculation with 120-period Z-score normalization
Analysis: (Return - Risk_Free_Rate) / Standard_Deviation of returns
Edge: Identifies periods of superior risk-adjusted performance
🎯 Sortino Ratio
Function: Risk-adjusted return using only downside deviation (superior to Sharpe)
Default Settings: 400-period calculation with 120-period Z-score normalization
Analysis: (Return - Risk_Free_Rate) / Downside_Deviation
Edge: More accurate risk assessment as it ignores upside volatility
🌟 Omega Ratio
Function: Advanced risk measure comparing gains above threshold to losses below
Default Settings: 400-period calculation with 200-period Z-score normalization
Analysis: Sum_of_Gains_Above_Threshold / Sum_of_Losses_Below_Threshold
Edge: Captures full return distribution, not just mean and variance
🎨 Visualization & Interface
🌈 Dual Color Schemes
Bright Mode: Vibrant colors for clear daylight visibility
Dark Mode: Muted tones for low-light trading environments
Adaptive Gradients: Color intensity scales with Z-score magnitude
Background Highlighting: Optional panel and chart background coloring for extreme conditions
📊 Comprehensive Data Table
Real-time Z-scores for each enabled component
Composite score with gradient coloring
Valuation phase classification (6 distinct levels)
Toggle individual components on/off for custom analysis
🎯 Valuation Phase Classifications
📈 Systematic Valuation Levels
Extremely Undervalued: Z-score ≤ -2.0 (Exceptional buying opportunity)
Strongly Undervalued: Z-score ≤ -1.3 (Strong buying signal)
Moderately Undervalued: Z-score < -0.65 (Potential buying opportunity)
Fairly Valued: Z-score -0.65 to 0.5 (Neutral zone)
Slightly Overvalued: Z-score 0.5 to 1.2 (Caution zone)
Moderately Overvalued: Z-score 1.2 to 2.0 (Potential selling zone)
Strongly Overvalued: Z-score ≥ 2.0 (Strong selling signal)
🌍 Universal Asset Compatibility
✅ Equity Markets - Individual stocks, ETFs, indices, sector rotation analysis
✅ Cryptocurrency - Bitcoin, altcoins, DeFi tokens, NFT projects
8H
12H
4H
🚀 Key Strategic Advantages
🔬 Scientific Approach
Unlike traditional indicators that use fixed thresholds, the Universal Valuation employs dynamic statistical normalization that adapts to changing market conditions and volatility regimes.
⚡ Multi-Dimensional Analysis
Combines momentum, trend, volume, and risk-adjusted metrics to provide a 360-degree view of market valuation, reducing false signals and improving decision accuracy.
🎯 Customizable Framework
Enable or disable individual components to create custom valuation models tailored to specific assets, strategies, or market conditions.
📊 Institutional-Grade Metrics
Incorporates sophisticated risk ratios (Sharpe, Sortino, Omega) typically used by hedge funds and institutional investors.
💡 Professional Trading Applications
🎯 Mean Reversion Strategies
Identify extreme valuation levels for contrarian entries
Use composite Z-score thresholds for systematic signal generation
Combine with volume analysis for confirmation
📈 Trend Following Enhancement
Avoid trend entries during overvalued conditions
Use undervalued readings to add to existing positions
Time trend continuation trades with valuation support
🔄 Portfolio Management
Asset allocation based on relative valuation scores
Risk management using integrated Sharpe/Sortino ratios
Sector rotation timing using cross-asset comparison
⚡High-Frequency Applications
Intraday momentum component for scalping strategies
VWAP analysis for institutional order flow
Real-time composite scoring for algorithmic systems
🛠️ Configuration Best Practices
📊 Conservative Setup (Long-term)
Enable all components except Hurst Exponent
Use longer Z-score periods (200+) for stability
Focus on -1.3/+2.0 thresholds for major signals
⚡ Aggressive Setup (Short-term)
Emphasize momentum components (RSI, CCI, Chande)
Shorter Z-score periods (50-100) for responsiveness
Use -0.65/+1.2 thresholds for frequent signals
🎯 Risk-Focused Setup
Prioritize Sharpe, Sortino, and Omega ratios
Enable VWAP and price components
Use conservative thresholds with position sizing guidance
---
🏆 Professional Multi-Asset Valuation System
The Universal Valuation indicator represents a quantum leap in technical analysis sophistication, combining academic rigor with practical trading applications. By normalizing diverse technical components through statistical Z-scores, it provides objective, data-driven valuation assessments that adapt to any market condition.
---
📝 Disclaimer: This indicator is for educational and informational purposes only. The statistical models and risk ratios do not guarantee future performance. Always conduct thorough analysis and implement proper risk management practices.
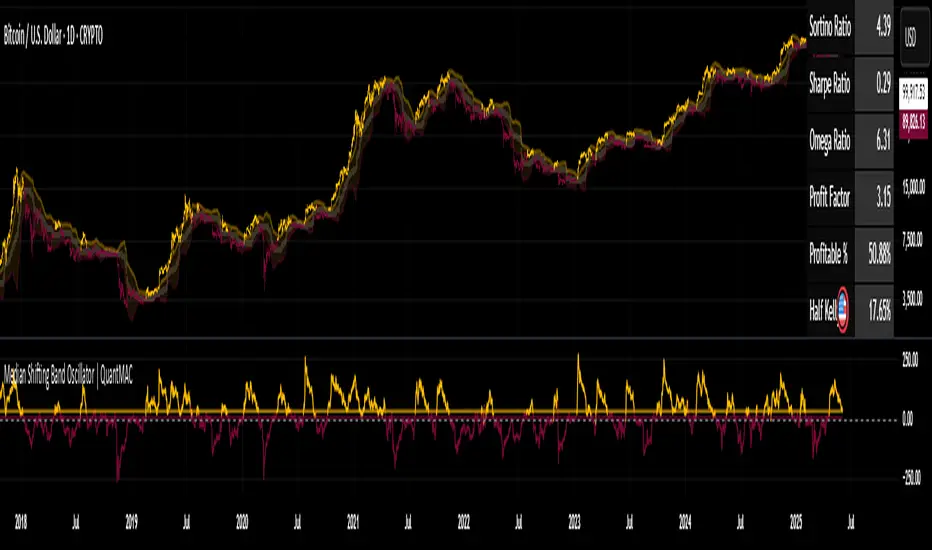
Median Shifting Band Oscillator | QuantMAC📊 Median Shifting Band Oscillator | QuantMAC
🚀 Revolutionary Trend Analysis with Integrated Performance Metrics
The Median Shifting Band Oscillator (MSBO) is a sophisticated technical analysis tool that combines dynamic median-based band calculations with a powerful oscillator to deliver precise trend identification across all market conditions and asset classes.
🎯 Core Features & Functionality
📈 Advanced Median Band Technology
Dynamic median calculation using customizable lookback periods (default 54 bars)
Adaptive standard deviation bands that adjust to market volatility
Real-time band positioning with visual overlay on price charts
Intelligent band fill visualization for enhanced trend clarity
⚡Precision Oscillator System
Normalized oscillator ranging from -50 to +50 for consistent readings
Customizable threshold levels for long (80) and short (54) signals
Multi-timeframe compatibility with real-time signal generation
Color-coded visualization with 9 professional color schemes
📊 Integrated Performance Dashboard
Real-time metrics calculation with professional statistics
Comprehensive risk metrics: Sharpe, Sortino, Omega ratios
Advanced position sizing with Half Kelly percentage
Maximum drawdown tracking and profit factor analysis
Customizable metrics table positioning (6 locations available)
🛠️ Trading Modes & Flexibility
🎭 Dual Trading Strategies
Long/Short Mode: Full bidirectional trading with short positions
Long/Cash Mode: Conservative approach with cash positions during bearish signals
🎨 Visual Customization
9 professional color schemes (Classic through Classic9)
Configurable date range limiter for backtesting
Force overlay plots for seamless chart integration
Dynamic bar coloring based on trend direction
📈 Performance Metrics Suite
The MSBO includes a comprehensive metrics table displaying:
Risk Analysis: Maximum Drawdown %, Sharpe Ratio, Sortino Ratio
Performance Metrics: Net Profit %, Profit Factor, Win Rate %
Advanced Statistics: Omega Ratio, Half Kelly %, Total Trades
Real-time Updates: Live calculation with every bar confirmation
🌍 Universal Asset Compatibility
✅ Cryptocurrencies - Bitcoin, altcoins, and DeFi tokens
✅ Stock Markets - Individual stocks, ETFs, and indices
🎯 Key Advantages
🔄 Adaptive Intelligence
The median-based approach provides superior noise filtering compared to traditional moving averages, automatically adjusting to changing market volatility patterns.
⚡ Real-time Precision
Advanced signal generation with customizable thresholds ensures optimal entry and exit timing while minimizing false signals.
📊 Professional Analytics
Built-in performance tracking eliminates the need for external backtesting tools, providing instant strategy validation and optimization insights.
🎨 User Experience
Intuitive interface with professional-grade customization options suitable for both retail traders and institutional analysts.
🚀 Getting Started
Add the indicator to your chart
Configure your preferred color scheme and trading mode
Adjust threshold levels based on your risk tolerance
Enable the metrics table for performance tracking
Set date range for historical analysis (optional)
💡 Pro Tips
Trend Confirmation: Use oscillator position relative to zero line for primary trend bias
Signal Quality: Higher threshold values reduce signal frequency but increase accuracy
Multi-Timeframe: Combine with higher timeframe analysis for enhanced precision
Risk Management: Monitor Half Kelly % for optimal position sizing guidance
---
🏆 Professional-Grade Tool for Serious Traders
The Median Shifting Band Oscillator represents the evolution of technical analysis, combining time-tested statistical methods with modern computational power to deliver actionable trading insights across all market conditions.
💬 Questions? Comments? Share your them below! 👇
---
📝 Disclaimer: This indicator is for educational and informational purposes only. Past performance does not guarantee future results. Always conduct your own analysis and manage risk appropriately.
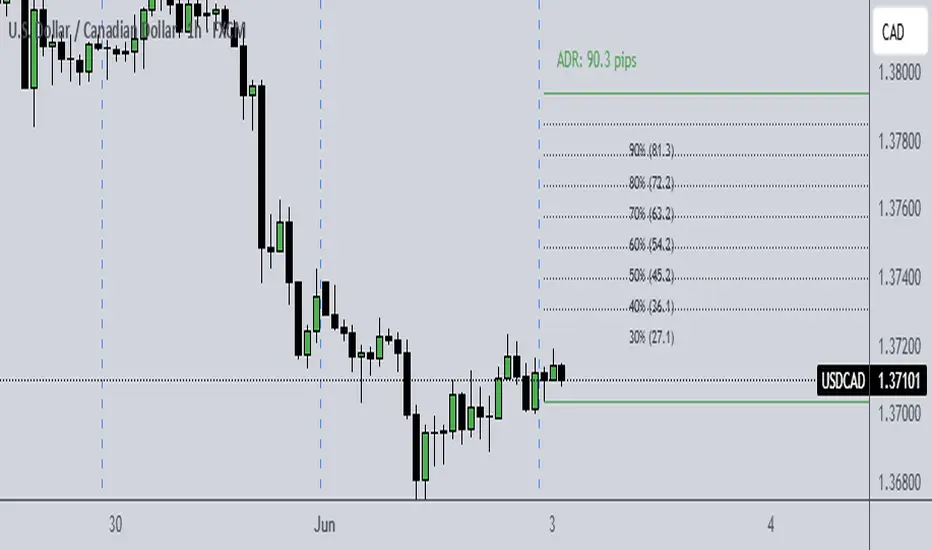
Average Daily Range [Dova Lazarus]Title: Average Daily Range
Description:
The Average Daily Range (ADR) indicator by Mantique Capital is designed to help traders assess the potential volatility of a trading day. It calculates the average range between daily highs and lows over a user-defined period and plots projected high/low zones based on that range.
Key Features:
📊 Plots ADR-based high and low levels for the current day
🎯 Choose between bullish and bearish bias for level calculation
📈 Optional 30% to 90% intermediate levels with customizable style and color
🏷️ Display percentage labels showing distance in pips
🔁 Adjustable ADR period length and number of days displayed
This indicator is useful for determining how much price movement (volatility) to expect in a given trading day, making it an excellent tool for setting targets, managing risk, and identifying overextension zones.
Inspired by the popular "Best ADR Indicator for MT4"
System 0530 - Stoch RSI Strategy with ATR filterStrategy Description: System 0530 - Multi-Timeframe Stochastic RSI with ATR Filter
Overview:
This strategy, "System 0530," is designed to identify trading opportunities by leveraging the Stochastic RSI indicator across two different timeframes: a shorter timeframe for initial signal triggers (assumed to be the chart's current timeframe, e.g., 5-minute) and a longer timeframe (15-minute) for signal confirmation. It incorporates an ATR (Average True Range) filter to help ensure trades are taken during periods of adequate market volatility and includes a cooldown mechanism to prevent rapid, successive signals in the same direction. Trade exits are primarily handled by reversing signals.
How It Works:
1. Signal Initiation (e.g., 5-Minute Timeframe):
Long Signal Wait: A potential long entry is considered when the 5-minute Stochastic RSI %K line crosses above its %D line, AND the %K value at the time of the cross is at or below a user-defined oversold level (default: 30).
Short Signal Wait: A potential short entry is considered when the 5-minute Stochastic RSI %K line crosses below its %D line, AND the %K value at the time of the cross is at or above a user-defined overbought level (default: 70). When these conditions are met, the strategy enters a "waiting state" for confirmation from the 15-minute timeframe.
2. Signal Confirmation (15-Minute Timeframe):
Once in a waiting state, the strategy looks for confirmation on the 15-minute Stochastic RSI within a user-defined number of 5-minute bars (wait_window_5min_bars, default: 5 bars).
Long Confirmation:
The 15-minute Stochastic RSI %K must be greater than or equal to its %D line.
The 15-minute Stochastic RSI %K value must be below a user-defined threshold (stoch_15min_long_entry_level, default: 40).
Short Confirmation:
The 15-minute Stochastic RSI %K must be less than or equal to its %D line.
The 15-minute Stochastic RSI %K value must be above a user-defined threshold (stoch_15min_short_entry_level, default: 60).
3. Filters:
ATR Volatility Filter: If enabled, trades are only confirmed if the current ATR value (converted to ticks) is above a user-defined minimum threshold (min_atr_value_ticks). This helps to avoid taking signals during periods of very low market volatility. If the ATR condition is not met, the strategy continues to wait for the condition to be met within the confirmation window, provided other conditions still hold.
Signal Cooldown Filter: If enabled, after a signal is generated, the strategy will wait for a minimum number of bars (min_bars_between_signals) before allowing another signal in the same direction. This aims to reduce overtrading.
4. Entry and Exit Logic:
Entry: A strategy.entry() order is placed when all trigger, confirmation, and filter conditions are met.
Exit: This strategy primarily uses reversing signals for exits. For example, if a long position is open, a confirmed short signal will close the long position and open a new short position. There are no explicit take profit or stop loss orders programmed into this version of the script.
Key User-Adjustable Parameters:
Stochastic RSI Parameters: RSI Length, Stochastic RSI Length, %K Smoothing, %D Smoothing.
Signal Trigger & Confirmation:
5-minute %K trigger levels for long and short.
15-minute %K confirmation thresholds for long and short.
Wait window (in 5-minute bars) for 15-minute confirmation.
Filters:
Enable/disable and configure the Signal Cooldown filter (minimum bars between signals).
Enable/disable and configure the ATR Volatility filter (ATR period, minimum ATR value in ticks).
Strategy Parameters:
Leverage Multiplier (Note: This primarily affects theoretical position sizing for backtesting calculations in TradingView and does not simulate actual leveraged trading risks).
Recommendations for Users:
Thorough Backtesting: Test this strategy extensively on historical data for the instruments and timeframes you intend to trade.
Parameter Optimization: Experiment with different parameter settings to find what works best for your trading style and chosen markets. The default values are starting points and may not be optimal for all conditions.
Understand the Logic: Ensure you understand how each component (Stochastic RSI on different timeframes, ATR filter, cooldown) interacts to generate signals.
Risk Management: Since this version does not include explicit stop-loss orders, ensure you have a clear risk management plan in place if trading this strategy live. You might consider manually adding stop-loss orders through your broker or using TradingView's separate strategy order settings for stop-loss if applicable.
Disclaimer:
This strategy description is for informational purposes only and does not constitute financial advice. Past performance is not indicative of future results. Trading involves significant risk of loss. Always do your own research and understand the risks before trading.

ATR% Multiple from MAThis indicator builds upon the original idea by jfsrevg of using the ATR% multiple from a daily 50-period moving average to highlight when a stock or instrument is extended relative to its own volatility. My version expands on this by incorporating an ADR% (Average Daily Range percentage) volatility filter, which helps refine the signals to adapt better to different instruments and timeframes.
What it does:
• Calculates the 50-period simple moving average (SMA) using daily data as the baseline trend reference.
• Measures the instrument’s Average True Range (ATR) relative to the current close (ATR%).
• Uses this ratio to identify when an instrument is significantly extended above its average volatility-based range.
• Adds a dynamic ADR% filter — computed as the average daily range divided by the daily close — to adjust the extension threshold dynamically based on recent price volatility.
• Plots small circles above price bars when extension conditions are met, signaling potential overbought conditions.
•The script works on both daily and weekly timeframes, but all volatility calculations are based on daily data to ensure consistency.
How to use:
• Traders can use this indicator to spot when a stock or instrument is significantly stretched relative to its own volatility, which may signal a good time to scale out or manage risk.
• The dynamic ADR% filter helps reduce false positives by adjusting thresholds based on market conditions.
• Use the customizable settings for ATR length, SMA length, and ADR length to fine-tune the indicator for your preferred instruments.
Original Contributions:
• Integrated an ADR% filter that refines the extension threshold based on real-time volatility.
• Added dynamic thresholds that adapt to market conditions, making the indicator more reliable across different instruments and timeframes.
• Maintained daily volatility calculations while allowing signals to appear on both daily and weekly charts.

Low Volatility Breakout Detector)This indicator is designed to visually identify potential breakouts from consolidation during periods of low volatility. It is based on classic Bollinger Bands and relative volume. Its primary purpose is not to generate buy or sell signals but to assist in spotting moments when the market exits a stagnation phase.
Arrows appear only when the price breaks above the upper or below the lower Bollinger Band, the band width is below a specified threshold (expressed in percentage), and volume is above its moving average multiplied by a chosen multiplier (default is 1). This combination may indicate the start of a new impulse following a period of low activity.
The chart background during low volatility is colored based on volume strength—the lower the volume during stagnation, the less transparent the background. This helps quickly spot unusual market behavior under seemingly calm conditions. The background opacity is dynamically scaled relative to the range of volumes over a selected period, which can be set manually (default is 50 bars).
The indicator works best in classic horizontal consolidations, where price moves within a narrow range and volatility and volume clearly decline. It is not intended to detect breakouts from formations such as triangles or wedges, which may not always exhibit low volatility relative to Bollinger Bands.
Settings allow you to adjust:
Bollinger Band length and multiplier,
Volatility threshold (in %),
Background and arrow colors,
Volume moving average length and multiplier,
Bar range used for background opacity scaling.
Note: For reliable results, it’s advisable to tailor the volatility threshold and volume/background ranges to the specific market and timeframe, as different instruments have distinct dynamics. If you want the background color to closely match the color of breakout arrows, you should set the same volume analysis period as the volume moving average length.
Additional note: To achieve a cleaner chart and focus solely on breakout signals, you can disable the background and Bollinger Bands display in the settings. This will leave only the breakout arrows visible on the chart, providing a clearer and more readable market picture.

Consolidation Range with Signals (Zeiierman)█ Overview
Consolidation Range with Signals (Zeiierman) is a precision tool for identifying and trading market consolidation zones, where price contracts into tight ranges before significant movement. It provides dynamic range detection using either ADX-based trend strength or volatility compression metrics, and offers built-in take profit and stop loss signals based on breakout dynamics.
Whether you trade breakouts, range reversals, or trend continuation setups, this indicator visualizes the balance between supply and demand with clearly defined mid-bands, breakout zones, and momentum-sensitive TP/SL placements.
█ How It Works
⚪ Multi-Method Range Detection
ADX Mode
Uses the Average Directional Index (ADX) to detect low-trend-strength environments. When ADX is below your selected threshold, price is considered to be in consolidation.
Volatility Mode
This mode detects consolidation by identifying periods of volatility compression. It evaluates whether the following metrics are simultaneously below their respective historical rolling averages:
Standard Deviation
Variance
Average True Range (ATR)
⚪ Dynamic Range Band System
Once a range is confirmed, the system builds a dynamic band structure using a volatility-based filter and price-jump logic:
Middle Line (Trend Filter): Reacts to price imbalance using adaptive jump logic.
Upper & Lower Bands: Calculated by expanding from the middle line using a configurable multiplier.
This creates a clean, visual box that reflects current consolidation conditions and adapts as price fluctuates within or escapes the zone.
⚪ SL/TP Signal Engine
On detection of a breakout from the range, the indicator generates up to 3 Take Profit levels and one Stop Loss, based on the breakout direction:
All TP/SL levels are calculated using the filtered base range and multipliers.
Cooldown logic ensures signals are not spammed bar-to-bar.
Entries are visualized with colored lines and labeled levels.
This feature is ideal for traders who want automated risk and reward reference points for range breakout plays.
█ How to Use
⚪ Breakout Traders
Use the SL/TP signals when the price breaks above or below the range bands, especially after extended sideways movement. You can customize how far TP1, TP2, and TP3 sit from the entry using your own risk/reward profile.
⚪ Mean Reversion Traders
Use the bands to locate high-probability reversion zones. These serve as reference zones for scalping or fade entries within stable consolidation phases.
█ Settings
Range Detection Method – Choose between ADX or Volatility compression to define range criteria.
Range Period – Determines how many bars are used to compute trend/volatility.
Range Multiplier – Scales the width of the consolidation zone.
SL/TP System – Optional levels that project TP1/TP2/TP3 and SL from the base price using multipliers.
Cooldown – Prevents repeated SL/TP signals from triggering too frequently.
ADX Threshold & Smoothing – Adjusts sensitivity of trend strength detection.
StdDev / Variance / ATR Multipliers – Fine-tune compression detection logic.
-----------------
Disclaimer
The content provided in my scripts, indicators, ideas, algorithms, and systems is for educational and informational purposes only. It does not constitute financial advice, investment recommendations, or a solicitation to buy or sell any financial instruments. I will not accept liability for any loss or damage, including without limitation any loss of profit, which may arise directly or indirectly from the use of or reliance on such information.
All investments involve risk, and the past performance of a security, industry, sector, market, financial product, trading strategy, backtest, or individual's trading does not guarantee future results or returns. Investors are fully responsible for any investment decisions they make. Such decisions should be based solely on an evaluation of their financial circumstances, investment objectives, risk tolerance, and liquidity needs.

Interpolated Median Volatility LSMA | OttoThis indicator combines trend-following and volatility analysis by enhancing traditional LSMA with percentile-based linear interpolation applied to both the Least Squares Moving Average (LSMA) and standard deviation. Rather than relying on raw values, it uses the interpolated median (50th percentile) to smooth out noise while preserving sensitivity to significant price shifts. This approach produces a cleaner trend signal that remains responsive to real market changes, adapts to evolving volatility conditions, and improves the accuracy of breakout detection.
Core Concept
The indicator builds on these core components:
LSMA (Least Squares Moving Average): A linear regression-based moving average that fits line using user selected source over user defined period. It offers a smoother and more reactive trend signal compared to standard moving averages.
Standard Deviation shows how much price varies from the mean. In this indicator, it’s used to measure market volatility.
Volatility Bands: Instead of traditional Bollinger-style bands, this script calculates custom upper and lower bands using percentile-based linear interpolation on both the LSMA and standard deviation. This method produces smoother bands that filter out noise while remaining adaptive to meaningful price movements, making them more aligned with real market behavior and helping reduce false signals.
Percentile interpolation estimates a specific percentile (like the median — the 50th percentile) from a set of values — even when that percentile doesn't fall exactly on one data point. Instead of selecting a single nearest value, it calculates a smoothed value between nearby points. In this script, it’s used to find the median of past LSMA and standard deviation values, reducing the impact of outliers and smoothing the trend and volatility signals for more robust results.
Signal Logic: A long signal is identified when close price goes above the upper band, and a short signal when close price goes below the lower band.
⚙️ Inputs
Source: The price source used in calculations
LSMA Length: Period for calculating LSMA
Standard Deviation Length: Period for calculating volatility
Percentile Length: Period used for interpolating percentile values of LSMA and standard deviation
Multiplier: Controls the width of the bands by scaling the interpolated standard deviation
📈 Visual Output
Colored LSMA Line: Changes color based on signal (green for bullish, purple for bearish)
Upper & Lower Bands: Volatility bands calculated using interpolated values (green for bullish, purple for bearish)
Bar Coloring: Price bars are colored to reflect signal state (green for bullish, purple for bearish)
Optional Candlestick Overlay: Enhances visual context by coloring candles to match the signal state (green for bullish, purple for bearish)
How to Use
Add the indicator to your chart and look for signals when close price goes above or below the bands.
Long Signal: close Price goes above the upper band
Short Signal: close Price goes below the lower band
🔔 Alerts:
This script supports alert conditions for long and short signals. You can set alerts based on band crossovers to be notified of potential entries/exits.
⚠️ Disclaimer:
This indicator is intended for educational and informational purposes only. Trading/investing involves risk, and past performance does not guarantee future results. Always test and evaluate strategies before applying them in live markets. Use at your own risk.

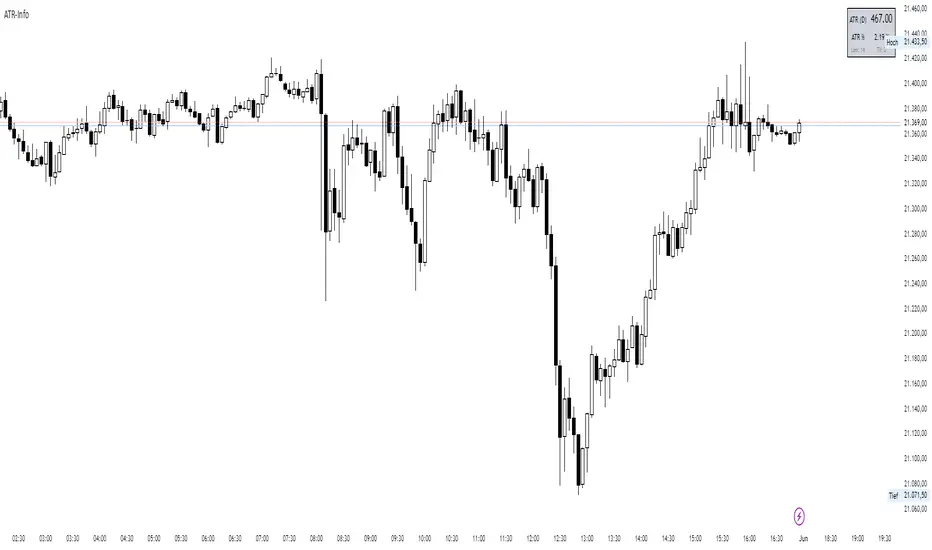
ATR-InfoWHAT IT SHOWS
- ATR (): Average True Range of the chosen timeframe, printed with the instrument’s native tick precision (format.mintick).
- ATR % PRICE: ATR divided by the latest close, multiplied by 100 – the range as a percentage of current price.
- LEN / TF: The ATR length and timeframe you selected (shown in small print).
INPUTS
- ATR Length (default 14)
- ATR Timeframe (for example 60, D, W)
- Design settings: table position, font size, colours, border
EXAMPLES
BTC-USD: price 67 800, ATR 2 450, ATR % 3.6
NQ E-Mini: price 18 230, ATR 355, ATR % 1.9
CL WTI: price 76.40, ATR 2.10, ATR % 2.8
EUR-USD: price 1.0860, ATR 0.0075, ATR % 0.69
USE CASES
Volatility-adjusted stops: place your stop roughly one ATR beyond the entry price.
Position sizing: money at risk divided by ATR gives the number of contracts or coins.
Market selection: trade assets only when their ATR % sits in your preferred range.
Strategy filter: trigger entries or exits only when ATR % crosses a chosen threshold.
LIMITS
ATR is descriptive; it does not predict future moves.
Illiquid symbols may show exaggerated ATR spikes.
ATR % ignores differing session lengths (24/7 crypto versus exchange-traded hours).
BK AK-Scope🔭 Introducing BK AK-Scope — Target Locked. Signal Acquired. 🔭
After building five precision weapons for traders, I’m proud to unveil the sixth.
BK AK-Scope — the eye of the arsenal.
This is not just an indicator. It’s an intelligence system for volatility, signal clarity, and rate-of-change dynamics — forged for elite vision in any market terrain.
🧠 Why “Scope”? And Why “AK”?
Every shooter knows: you can’t hit what you can’t see.
The Scope brings range, clarity, and target distinction. It filters motion from noise. Purpose from panic.
“AK” continues to honor the man who trained my sight — my mentor, A.K.
His discipline taught me to wait for alignment. To move with reason, not emotion.
His vision lives in every code line here.
🔬 What Is BK AK-Scope?
A Triple-Tier TSI Correlation Engine, fused with adaptive opacity logic, a volatility scoring system, and real-time signal clarity. It’s momentum dissected — by speed, depth, and rate of change.
Built to serve traders who:
Need visual hierarchy between fast, mid, and slow TSI responses.
Want adaptive fills that pulse with volatility — not static zones.
Require a volatility scoring overlay that reads the battlefield in real time.
⚙️ Core Systems: How BK AK-Scope Works
✅ Fast/Mid/Slow TSI →
Three layers of correlation: like scopes with zoom levels.
You track micro moves, mid swings, and macro flow simultaneously.
✅ Rate-of-Change Adaptive Opacity →
Momentum fills fade or flash based on speed — giving you movement density at a glance.
Bull vs. Bear zones adapt to strength. You feel the market’s pulse.
✅ Volatility Score Intelligence →
Custom algorithm measuring:
Range expansion
Rate-of-change differentials
ATR dynamics
Standard deviation pressure
All combined into a score from 0–100 with live icons:
🔥 = Extreme Heat (70+)
🧊 = Cold Zone (<30)
⚠️ = ROC Warning
• = Neutral drift
✅ Auto-Detect Volatility Modes →
Scalp = <15min
Swing = intraday/hourly
Macro = daily/weekly
Or override manually with total control.
🎯 How To Use BK AK-Scope
🔹 Trend Continuation → When all three TSI layers align in direction + volatility score climbs, ride with the trend.
🔹 Early Reversals → Opposing TSI + rapid opacity change + volatility shift = sniper reversal zone.
🔹 Consolidation Filter → Neutral fills + score < 30 = stay out, wait for signal surge.
🔹 Signal Confluence → Pair with:
• Gann fans or angles
• Fib time/price clusters
• Elliott Wave structure
• Harmonics or divergence
To isolate entry perfection.
🛡️ Why This Indicator Changes the Game
It's not just momentum. It’s TSI with depth hierarchy.
It’s not just color. It’s real-time strength visualization.
It’s not just volatility. It’s rate-weighted market intelligence.
This is market optics for the advanced trader — built for vision, clarity, and discipline.
🙏 Final Thoughts
🔹 In honor of A.K., my mentor. The man who taught me to see what others miss.
🔹 Inspired by the power of vision — because execution without clarity is chaos.
🔹 Powered by faith — because Gd alone gives sight beyond the visible.
“He gives sight to the blind and wisdom to the humble.” — Psalms 146
Every tool I build is a prayer in code — that it helps someone trade with clarity, integrity, and precision.
⚡ Zoom In. Focus Deep. Trade Clean.
BK AK-Scope — Lock on the target. See what others don’t.
🔫 Clarity is power. 🔫
Gd bless. 🙏
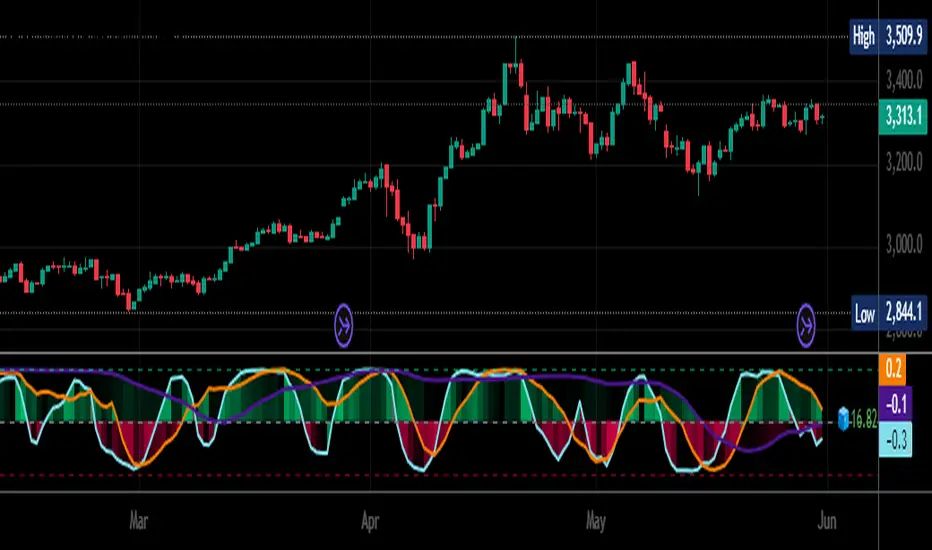
AXR-VolSD-Loc📈 AXR-VolSD-Loc — Volatility & Range Mapping Tool for Smart Traders
The AXR-VolSD-Loc indicator is a professional-grade tool designed for traders who rely on precise volatility analysis and structured range-based levels. It combines dynamic volatility bands with configurable price ranges such as ADR, AWR, AMR, and AQR — offering strategic clarity across all timeframes.
🔍 Key Features
Multi-Timeframe Range Calculation
Supports Daily (ADR), Weekly (AWR), Monthly (AMR), and Quarterly (AQR) ranges — each with independent period controls.
Standard Deviation Volatility Bands
Automatically or manually calculate standard deviation (%) to plot multiple upper/lower levels from a base price reference.
Fully Customizable Lines & Labels
Choose the number of bands, enable half-volatility levels, apply color gradients, customize line styles, widths, label positions, font sizes and offsets.
Flexible Anchor Logic
Set the base line for volatility from Hi/Lo/50%/0% of AXR, or input your own manual price — ideal for ICT model alignment.
Smart Visuals & Optimized Drawing
Clean line and label management using line.new() and label.new() with efficient updates only when required.
Data Table & Summary Panel
Floating table displays key metrics like high/low range, midpoint, volatility settings, and source references.
Built-In Alerts
Receive alerts when price approaches key volatility levels or AXR range extremes — ideal for anticipating institutional behavior.
🛠️ How to Use & Configure
1. Choose the Range Mode
In "AXR Mode & Period Settings", select your preferred range type:
Daily (ADR) – Short-term or intraday.
Weekly (AWR) – Medium swing positions.
Monthly (AMR) – Optimal for higher-timeframe structure.
Quarterly (AQR) – Best for macro-level zones.
Then define the number of days/weeks/months/quarters used to calculate each.
2. Define the Volatility Base Line
Under "Volatility Base Line Settings", configure the anchor:
Use 0% AXR for midpoint, or Hi/Lo/50% for edges.
Manual mode allows custom price input.
Adjust the line color, style, and thickness.
3. Configure Standard Deviation
In "Standard Deviation - Calculation & Levels", select the source:
Automatic AXR — calculates % based on AXR range.
Manual — allows custom % input.
Define how many levels above/below the base line.
Use the scale factor to adjust relative strength (e.g., 0.5 = 50% of AXR).
4. Adjust Visual Display
In "Display & Labels":
Enable or disable volatility lines.
Use color progression for intensity from blue to red.
Show or hide intermediate lines (half deviation).
Choose label alignment: right, center, or left.
Fine-tune label position with candle offset and text size.
5. Extend Lines and Define Visibility
You can choose to extend the lines left, right or both directions — or use a fixed number of bars when not extended.
This applies to both volatility lines and AXR levels.
6. Show AXR Hi/Lo/50%/0% Lines
In "AXR Levels":
Enable display of Hi, Lo, midpoint, and 50% levels.
Toggle display of AXR open levels (MO-based).
Customize style, color and width of each line.
7. Enable the Table (Optional)
Turn on the floating data table to see a quick summary:
Range high/low/midpoint.
Volatility multiplier.
Source (manual vs automatic).
Period length.
Useful for fast review during market sessions.
8. Alerts
Receive automated alerts when price approaches:
AXR Hi/Lo
0% midpoint level
Custom-defined deviation bands
✅ Use Cases
Define and monitor volatility zones around structured ranges.
Combine AMR or AQR with deviation bands for swing setups.
React to price imbalances at 50% or 0% AXR zones.
Integrate with order blocks, liquidity zones or ICT-based confluences.
Questions or suggestions? Contact us via TradingView message or in the comments.
Happy trading!

RTI Shifting Band Oscillator | QuantMAC📊 RTI Shifting Band Oscillator | QuantMAC - Revolutionary Adaptive Trading Indicator
🎯 Overview
The RTI Shifting Band Oscillator represents a breakthrough in adaptive technical analysis, combining the innovative Range Transition Index (RTI) with dynamic volatility bands to create an oscillator that automatically adjusts to changing market conditions. This cutting-edge indicator goes beyond traditional static approaches by using RTI to dynamically shift band width based on market volatility transitions, providing superior signal accuracy across different market regimes.
🔧 Key Features
Revolutionary RTI Technology : Proprietary Range Transition Index that measures volatility transitions in real-time
Dynamic Adaptive Bands : Self-adjusting volatility bands that expand and contract based on RTI readings
Dual Trading Modes : Flexible Long/Short or Long/Cash strategies for different trading preferences
Advanced Performance Analytics : Comprehensive metrics including Sharpe, Sortino, and Omega ratios
Smart Visual System : Dynamic color coding with 9 professional color schemes
Precision Backtesting : Date range filtering with detailed historical performance analysis
Real-time Signal Generation : Clear entry/exit signals with customizable threshold sensitivity
Position Sizing Intelligence : Half Kelly criterion for optimal risk management
📈 How The RTI Technology Works
The Range Transition Index (RTI) is the heart of this indicator's innovation. Unlike traditional volatility measures, RTI analyzes the transitions between different volatility states, providing early warning signals for market regime changes.
RTI Calculation Process:
Calculate True Range for each period using high, low, and previous close
Compute Average True Range over the RTI Length period
Sum absolute differences between consecutive True Range values
Normalize by dividing by ATR to create the raw RTI
Apply smoothing to reduce noise and create the final RTI value
Use RTI to dynamically adjust standard deviation multipliers
The genius of RTI lies in its ability to detect when markets are transitioning between calm and volatile periods before traditional indicators catch up. This provides traders with a significant edge in timing entries and exits.
⚙️ Comprehensive Parameter Control
RTI Settings:
RTI Length : Controls the lookback period for volatility analysis (default: 25)
RTI Smoothing : Reduces noise in RTI calculations (default: 12)
Base MA Length : Foundation moving average for band calculations (default: 40)
Source : Price input selection (close, open, high, low, etc.)
Oscillator Settings:
Standard Deviation Length : Period for volatility measurement (default: 27)
SD Multiplier : Base band width adjustment (default: 1.5)
Oscillator Multiplier : Scaling factor for oscillator values (default: 100)
Signal Thresholds:
Long Threshold : Bullish signal trigger level (default: 82)
Short Threshold : Bearish signal trigger level (default: 55)
🎨 Advanced Visual System
Main Chart Elements:
Dynamic Shifting Bands : Upper and lower bands that automatically adjust width based on RTI
Adaptive Fill Zone : Color-coded area between bands showing current market state
Basis Line : Moving average foundation displayed as subtle reference points
Smart Bar Coloring : Candles change color based on oscillator state for instant visual feedback
Oscillator Pane:
Normalized RTI Oscillator : Main signal line centered around zero with dynamic coloring
Threshold Lines : Horizontal reference lines for entry/exit levels
Zero Line : Central reference for oscillator neutrality
Color State Indication : Line colors change based on bullish/bearish conditions
📊 Professional Performance Metrics
The built-in analytics suite provides institutional-grade performance measurement:
Net Profit % : Total strategy return percentage
Maximum Drawdown % : Worst peak-to-trough decline
Win Rate % : Percentage of profitable trades
Profit Factor : Ratio of gross profits to gross losses
Sharpe Ratio : Risk-adjusted return measurement
Sortino Ratio : Downside-focused risk adjustment
Omega Ratio : Probability-weighted performance ratio
Half Kelly % : Optimal position sizing recommendation
Total Trades : Complete transaction count
🎯 Strategic Trading Applications
Long/Short Mode: ⚡
Maximizes profit potential by capturing both upward and downward price movements. The RTI technology helps identify when trends are strengthening or weakening, allowing for optimal position switches between long and short.
Long/Cash Mode: 🛡️
Conservative approach ideal for retirement accounts or risk-averse traders. The indicator's adaptive nature helps identify the best times to be invested versus sitting in cash, protecting capital during adverse market conditions.
🚀 Unique Advantages
Traditional Indicators vs RTI Shifting Bands:
Static vs Dynamic : While most indicators use fixed parameters, RTI bands adapt in real-time
Lagging vs Leading : RTI detects volatility transitions before they fully manifest
One-Size vs Adaptive : The same settings work across different market conditions
Simple vs Intelligent : Advanced volatility analysis provides superior market insight
💡 Professional Setup Guide
For Day Trading (Short-term):
RTI Length: 15-20
RTI Smoothing: 8-10
Base MA Length: 20-30
Thresholds: Long 80, Short 60
For Swing Trading (Medium-term):
RTI Length: 25-35 (default range)
RTI Smoothing: 12-15
Base MA Length: 40-50
Thresholds: Long 83, Short 55 (defaults)
For Position Trading (Long-term):
RTI Length: 40-50
RTI Smoothing: 15-20
Base MA Length: 60-80
Thresholds: Long 85, Short 50
🧠 Advanced Trading Techniques
RTI Divergence Analysis:
Watch for divergences between price action and RTI readings. When price makes new highs/lows but RTI doesn't confirm, it often signals upcoming reversals.
Band Width Interpretation:
Expanding Bands : Increasing volatility, expect larger price moves
Contracting Bands : Decreasing volatility, prepare for potential breakouts
Band Touches : Price touching outer bands often signals reversal opportunities
Multi-Timeframe Analysis:
Use RTI on higher timeframes for trend direction and lower timeframes for precise entry timing.
⚠️ Important Risk Disclaimers
Past performance is not indicative of future results. This indicator represents advanced technical analysis but should never be used as the sole basis for trading decisions.
Critical Risk Factors:
Market Conditions : No indicator performs equally well in all market environments
Backtesting Limitations : Historical performance may not reflect future market behavior
Volatility Risk : Adaptive indicators can be sensitive to extreme market conditions
Parameter Sensitivity : Different settings may produce significantly different results
Capital Risk : Always use appropriate position sizing and stop-loss protection
📚 Educational Benefits
This indicator provides exceptional learning opportunities for understanding:
Advanced volatility analysis and measurement techniques
Adaptive indicator design and implementation
The relationship between volatility transitions and price movements
Professional risk management using Kelly Criterion principles
Modern oscillator interpretation and signal generation
🔍 Market Applications
The RTI Shifting Band Oscillator works across various markets:
Forex : Excellent for currency pair volatility analysis
Stocks : Individual equity and index trading
Commodities : Adaptive to commodity market volatility cycles
Cryptocurrencies : Handles extreme volatility variations effectively
Futures : Professional derivatives trading applications
🔧 Technical Innovation
The RTI Shifting Band Oscillator represents years of research into adaptive technical analysis. The proprietary RTI calculation method has been optimized for:
Computational Efficiency : Fast calculation even on high-frequency data
Noise Reduction : Advanced smoothing without excessive lag
Market Adaptability : Automatic adjustment to changing conditions
Signal Clarity : Clear, actionable trading signals
🔔 Updates and Evolution
The RTI Shifting Band Oscillator | QuantMAC continues to evolve with regular updates incorporating the latest research in adaptive technical analysis. The code is thoroughly documented for transparency and educational purposes.
Trading Notice: Financial markets involve substantial risk of loss. The RTI Shifting Band Oscillator is a sophisticated technical analysis tool designed to assist in trading decisions but cannot guarantee profitable outcomes. Always conduct thorough testing, implement proper risk management, and consider seeking advice from qualified financial professionals. Only trade with capital you can afford to lose.
---
Master The Markets With Adaptive Intelligence! 🎯📈

Bollinger Bands Oscillator | QuantMAC📊 Bollinger Bands Oscillator | QuantMAC
🎯 Overview
The Bollinger Bands Oscillator is a sophisticated technical analysis tool that combines the power of traditional Bollinger Bands with an oscillator-based approach for enhanced signal generation. This indicator transforms the classic Bollinger Bands into a percentage-based oscillator, providing clearer entry and exit signals for both trending and ranging markets.
🔧 Key Features
Dual Trading Modes : Choose between Long/Short or Long/Cash strategies
Advanced BB% Calculation : Enhanced Bollinger Band percentage with customizable multipliers
Comprehensive Metrics : Built-in performance analytics including Sharpe Ratio, Sortino Ratio, and Profit Factor
Visual Color Coding : Dynamic bar coloring and 9 different color schemes for optimal chart visibility
Date Range Filtering : Backtest specific time periods with customizable start dates
Real-time Signal Generation : Clear long and short entry signals with threshold customization
Advanced Risk Management : Half Kelly criterion calculation for optimal position sizing
📈 How It Works
The indicator operates by calculating a modified Bollinger Band percentage that oscillates between values, typically ranging from 0 to 100+. When the BB% crosses above the Long Threshold (default: 83), it generates a bullish signal. Conversely, when it crosses below the Short Threshold (default: 55), it produces a bearish signal.
Core Calculation Process:
Calculate the moving average basis using the specified Base Length (default: 40 periods)
Determine standard deviation using a separate SD Length (default: 27 periods)
Create upper and lower bands using the SD Multiplier (default: 2.6)
Convert to percentage oscillator with BB% Multiplier (default: 100)
Generate signals based on threshold crossovers
⚙️ Customizable Parameters
BMD Settings:
Base Length : Controls the moving average period (default: 40)
Standard Deviation Length : Determines volatility calculation period (default: 27)
SD Multiplier : Adjusts band width sensitivity (default: 2.6)
BB% Multiplier : Scales the oscillator values (default: 100)
Source : Choose price source (close, open, high, low, etc.)
Signal Thresholds:
Long Threshold : Entry level for bullish positions (default: 83)
Short Threshold : Entry level for bearish positions (default: 55)
🎨 Visual Elements
Main Chart Overlay:
Bollinger Bands : Upper and lower bands with customizable colors and transparency
Middle Line : Basis line displayed as subtle dots
Band Fill : Colored area between bands for easy visualization
Bar Coloring : Candles change color based on current signal state
Separate Oscillator Pane:
BB% Line : Main oscillator line with dynamic coloring
Threshold Lines : Horizontal lines marking entry/exit levels
Color Coding : Line colors change based on bullish/bearish state
📊 Performance Metrics
The indicator includes a comprehensive metrics table displaying:
Net Profit % : Total return percentage
Max Drawdown % : Maximum peak-to-trough decline
Win Rate % : Percentage of profitable trades
Profit Factor : Ratio of gross profit to gross loss
Sharpe Ratio : Risk-adjusted return measure
Sortino Ratio : Downside risk-adjusted return
Omega Ratio : Probability-weighted ratio of gains vs losses
Half Kelly % : Optimal position sizing recommendation
Total Trades : Number of completed transactions
🎯 Trading Strategies
Long/Short Mode: 🔄
The indicator alternates between long and short positions based on threshold crossovers. This mode is ideal for traders who can profit from both rising and falling markets.
Long/Cash Mode: 💰
This conservative approach only takes long positions, moving to cash during bearish signals. Perfect for traders in accounts that don't allow short selling or those preferring a buy-and-hold approach with strategic exits.
🚀 Getting Started
Add the indicator to your chart
Choose your preferred Trading Mode (Long/Short or Long/Cash)
Adjust the Base Length and SD Length to match your trading timeframe
Fine-tune the Long Threshold and Short Threshold based on your risk tolerance
Select your preferred color scheme from 9 available options
Enable the metrics table to monitor performance in real-time
💡 Pro Tips
Lower thresholds (e.g., Long: 75, Short: 60) generate more frequent but potentially less reliable signals
Higher thresholds (e.g., Long: 90, Short: 45) produce fewer but potentially higher-quality signals
Shorter base lengths make the indicator more responsive to recent price action
Longer base lengths smooth out noise but may lag market turns
Use the Half Kelly % metric to guide position sizing decisions
⚠️ Important Disclaimers
Past performance is not indicative of future results . This indicator is a technical analysis tool designed to assist in trading decisions but should not be used as the sole basis for investment choices.
Key Risk Considerations:
Market Conditions : No indicator works perfectly in all market environments
Backtesting Bias : Historical performance may not reflect future market behavior
Risk Management : Always use proper position sizing and stop-loss orders
Multiple Confirmations : Consider using additional indicators and analysis methods
📚 Educational Value
This indicator serves as an excellent learning tool for understanding:
Bollinger Band mechanics and interpretation
Oscillator-based trading strategies
Performance metrics and risk assessment
Position sizing using Kelly Criterion principles
The relationship between volatility and price movement
🔔 Updates and Support
The Bollinger Bands Oscillator | QuantMAC is regularly updated to ensure compatibility with TradingView's latest features. The code is thoroughly commented for educational purposes and transparency.
Remember: Trading involves substantial risk of loss and is not suitable for all investors. The value of investments may go down as well as up, and you may not get back the amount you invested. Always conduct your own research and consider seeking advice from a qualified financial advisor.
