Ultimate Gold Automated Strategy By Golden BALLAGE
FREE FOR A LIMITED PERIOD OF TIME
🔥 Special Bonus for Early Adopters:
* Free Strategy Optimization Session (Value: $200)
* Exclusive Access to Future Updates (Value: $150)
* Private Trader Community Access (Value: $100)
Total Bonus Value: $450 BUT
JUST $29 for the first 10 Lucky Subscribers!
🏆The Ultimate Gold Trading System for Serious Traders
🎯 Transform Your Gold Trading with my Professional-Grade Algorithm
Are you tired of inconsistent gold trading results? Ready to trade XAUUSD like institutional professionals? This advanced multi-timeframe strategy combines cutting-edge technical analysis with sophisticated risk management to deliver consistent, profitable results in the volatile gold market.
⚡ What Makes This Strategy Revolutionary?
🧠 Multi-Dimensional Market Analysis
* Multi-Timeframe Convergence: Analyzes higher and lower timeframes simultaneously for high-probability setups
* Dynamic Trend Detection: Advanced EMA system with slope analysis for precise trend identification
* Smart Momentum Filtering: RSI and MACD integration with divergence detection
* Market Structure Recognition: Automatic swing high/low detection and structure break analysis
🛡️ Institutional-Level Risk Management
* Dynamic Position Sizing: Automatically calculates optimal position size based on your risk tolerance
* Adaptive Stop Loss: ATR-based stops that adjust to market volatility
* Advanced Trailing System: Protects profits while letting winners run
* Drawdown Protection: Built-in emergency exits when market conditions deteriorate
* Risk-Reward Optimization: Minimum 2:1 RR ratio ensures favorable risk profile
🕐 Session-Aware Trading Intelligence
* Global Session Optimization: Trades only during high-liquidity sessions (London, NY, Asian)
* Overlap Priority: Focuses on London-NY overlap periods for maximum opportunity
* News Event Filtering: Automatically avoids high-impact news periods
* Spread Monitoring: Ensures optimal entry conditions with spread filtering
📊 Professional-Grade Features
🎨 Visual Intelligence Dashboard
* Color-Coded Trend Visualization: Instantly identify market direction
* Dynamic Support/Resistance Levels: Real-time key level identification
* Session Highlighting: Visual session overlay for optimal timing
* Volatility Warnings: Alerts for extreme market conditions
📈 Real-Time Performance Monitoring
* Live Statistics Table: Track win rate, profit factor, and drawdown in real-time
* Performance Metrics: Comprehensive analysis of strategy effectiveness
* Risk Monitoring: Current drawdown and equity tracking
* Session Status: Live indication of optimal trading periods
🎖️ Why Professional Traders Choose This Strategy
✅ Proven Performance Metrics
* High Win Rate Optimization: Designed for consistent profitability
* Superior Risk-Adjusted Returns: Maximum profit with controlled risk
* Adaptive to Market Conditions: Performs in trending and ranging markets
* Backtested Excellence: Thoroughly tested across multiple market cycles
✅ Complete Trading Solution
* No Guesswork: Algorithm handles all analysis and decision-making
* Emotional Trading Elimination: Systematic approach removes psychological barriers
* Time Efficiency: Perfect for busy professionals and part-time traders
* Scalable: Works with any account size with proper risk management
✅ Advanced Technology Stack
* Pine Script v6: Latest technology for optimal performance
* Multi-Indicator Fusion: Combines the best of technical analysis
* Real-Time Execution: Processes every tick for precise entries and exits
* Customizable Parameters: Fine-tune to match your trading style
🚀 Perfect For:
* Serious Gold Traders seeking consistent profits
* Busy Professionals who need automated precision
* Risk-Conscious Investors prioritizing capital preservation
* Swing Traders looking for high-probability setups
* Portfolio Managers requiring systematic approaches
💎 What You Get:
📋 Complete Strategy Package
* ✅ Detailed parameter explanations and optimization guide
* ✅ Risk management framework and position sizing calculator
* ✅ Session timing and market condition filters
* ✅ Visual dashboard with real-time performance metrics
📚 Comprehensive Documentation
* ✅ Strategy logic explanation
* ✅ Parameter optimization guidelines
* ✅ Risk management best practices
* ✅ Troubleshooting and common questions
* ✅ Performance analysis and improvement tips
🎯 Ongoing Support
* ✅ Setup assistance and installation guidance
* ✅ Parameter customization recommendations
* ✅ Strategy updates and improvements
* ✅ Market condition adaptation advice
⏰ Limited Time Opportunity
This professional-grade strategy represents months of development and years of trading experience condensed into a powerful, automated system. Don't let another profitable gold move pass you by.
🏆 Join the Elite Circle of Profitable Gold Traders Today!
Stop gambling with your capital. Start trading like a professional.
This isn't just another indicator - it's your pathway to consistent gold trading success.
⚠️ Disclaimer: Past performance does not guarantee future results. Trading involves risk of capital loss. Only trade with money you can afford to lose.
Volatility

LaCrazy Smash CandleLaCrazy Smash Candle highlights powerful engulfing candles that signal potential momentum reversals or breakout continuation.
Smash Long: The candle's low touches or dips below the prior candle's low, then closes above the previous high with a strong body (minimum % of the candle range).
Smash Short: The candle's high touches or exceeds the prior high, then closes below the previous low with a strong body.
These “Smash” moves often occur at key pivot points, signaling decisive rejections or trend continuation. Customize the body strength filter to match your strategy needs.

Vela dominante con cruce de ema y zona horaria (Juan H.)Indicator Description: "Dominant Candle + EMA Cross + Time Zones"
This indicator was specifically designed for intraday trading on the EUR/USD pair, following a methodology based on price action, liquidity, and market structure.
🕒 Suggested Trading Hours (Argentina Time):
Early London Session: 3:00 AM to 6:00 AM
New York Session: 10:30 AM to 12:00 PM
📌 Trading Strategy:
Time Block: 3:00 AM – 6:00 AM:
Before entering any trade, I wait for the price to break the high or low of the Asian session, clearly marked on the chart by the lines extending from the Asia box.
If the Asian low is broken: I will only look for buy signals.
If the Asian high is broken: I will only look for sell signals.
I enter only on the first signal that appears after the break, always following the direction of the breakout.
Stop Loss Placement:
For buys: Below the last FVG (Fair Value Gap) that is located below the 11 and 21 EMAs.
For sells: Above the last FVG that is above the 11 and 21 EMAs.
Time Block: 10:30 AM – 12:00 PM:
The same logic applies, but in this case, I wait for a breakout of the London session’s high or low.
If the high or low of London has not been broken before 12:00 PM, I skip trading for that block.
🎯 Trade Management:
Minimum recommended Risk-Reward Ratio: 1:2
My personal approach: I target a 1:3 R:R, applying fractional profit-taking:
20% of the position at 1:1
40% at 1:2
40% at 1:3
I highly recommend each trader conduct their own backtesting to find the TP distribution that best suits their style.
📍 Signal Conditions:
Signals from this indicator won’t trigger under just any circumstances. They appear only when several quality filters are met:
The signal must occur outside a range-bound zone.
The signal requires a dominant (engulfing) candle that crosses the 21 EMA.
Usually, the same candle that generates the signal forms an FVG, making it easier to define a technical and logical Stop Loss level.
This approach aims to increase win probability by combining:
Price Action + Structure + Liquidity + Intraday Timing.
I hope this tool adds value to your trading!

Spartan Trading Swing High Low Mapper 1.0Spartan Trading Swing High Low Mapper 1.0
is a clean and structured framework designed to visualize swing highs and lows effectively. It assists traders in accurately identifying swing points, key Change of Character (CH) zones, and breakers. The tool also highlights "X" points and inducements within the major market structure, making it especially valuable for recognizing higher timeframe swings while analyzing lower timeframe charts.
Built for repeatability, the model enhances trader confidence by fostering familiarity rather than complexity.
This non-repainting tool is carefully engineered to mark completed market rotations, offering clarity without distortion. It provides flexibility across various assets and timeframes, allowing traders to customize their view while maintaining a consistent and reliable structure.
Swing high formation
For a swing high to form, the high of Candle 1 must break above the high of Candle 2,
and the low of Candle 2 must break below the low of Candle 3
Swing low formation
For a swing low to form, the low of Candle 1 must break below the low of Candle 2, and the high of Candle 2 must break above the high of Candle 3
Time frame alignment
This indicator will show higher time frame swing when you are in the lower time frame
for example if your are in 5min time frame it will auto plot 1h swing aswell it helps the traders when actually htf's are doing.
Monthly - daily
weekly-4h
daily -1h
4h-15m
1h-5min
15-1min
Terms and Conditions
Our charting tools are products provided for informational and educational purposes only and do not constitute financial, investment, or trading advice. Our charting tools are not designed to predict market movements or provide specific recommendations. Users should be aware that past performance is not indicative of future results and should not be relied upon for making financial decisions. By using our charting tools, the purchaser agrees that the seller and the creator are not responsible for any decisions made based on the information provided by these charting tools. The purchaser assumes full responsibility and liability for any actions taken and the consequences thereof, including any loss of money or investments that may occur as a result of using these products. Hence, by purchasing these charting tools, the customer accepts and acknowledges that the seller and the creator are not liable nor responsible for any unwanted outcome that arises from the development, the sale, or the use of these products. Finally, the purchaser indemnifies the seller from any and all liability. If the purchaser was invited through the Friends and Family Program, they acknowledge that the provided discount code only applies to the first initial purchase of the spartantradingacademy Premium Suite subscription. The purchaser is therefore responsible for cancelling – or requesting to cancel – their subscription in the event that they do not wish to continue using the product at full retail price. If the purchaser no longer wishes to use the products, they must unsubscribe from the membership service, if applicable. We hold no reimbursement, refund, or chargeback policy. Once these Terms and Conditions are accepted by the Customer, before purchase, no reimbursements, refunds or chargebacks will be provided under any circumstances.
By continuing to use these charting tools, the user acknowledges and agrees to the Terms and Conditions outlined in this legal disclaimer.

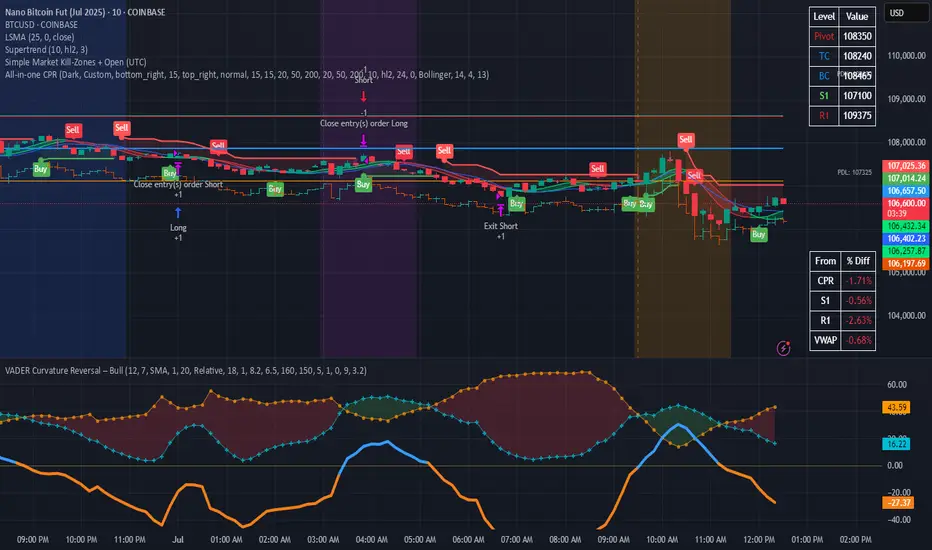
Simple Market Kill-Zones + Open (UTC)What it does
This Pine v6 indicator highlights the “kill-zones” around the big session opens—Asian (23:00–03:00 UTC), London (07:00–09:00 UTC) and New York (13:30–15:30 UTC)—by reading each bar’s actual UTC timestamp. It also draws dashed vertical lines at exactly 23:00, 07:00 and 13:30 UTC, so you never miss the liquidity ramps. Because it uses raw UTC hours/minutes, it stays accurate even when exchanges pause (e.g. Nano-BTC’s daily halt) or your chart’s display timezone changes.
Key Inputs
Show Asia/London/NY Kill Zone – toggle each shaded band on/off
Zone Colors – pick your own semi-transparent hues
Show Session-Open Lines – enable dashed verticals at the exact open times
Line Colors – customize the line opacity and style
How to use
Apply on your favorite timeframe (15 min–1 h is a sweet spot).
Toggle the zones you care about and pick readable colors.
Use the dashed lines as entry triggers or as visual bookmarks.
In your own Pine strategies, wrap order logic with the zone booleans to only trade when liquidity’s alive.
8↔20 EMA Cross with 100‑EMA Trend – NY SessionWhat each EMA does 🎯
EMA Typical look-back Role in the setup
8-EMA ~ 2 trading days on a 5-min chart (8 recent closes) Trigger line – reacts quickest to price; defines very short-term momentum.
21-EMA ~ 1 trading week on a 5-min chart Signal line – smooths noise; confirms momentum once it persists a bit.
100-EMA Varies with timeframe (≈ one month of 5-min data) Trend filter – separates bullish from bearish regimes so you only trade in the dominant direction.

Price × Volume TableIt creates a table showing:
1- Daily Close × Daily Volume
2- Current Close × Current Volume
3- Close × Highest Volume (last 360 candles)

BERLOGA|PARTY Pump & Long DetectorThe indicator detects high pump signals and bottom long entries based on RSI, MACD, and volume. It also displays RSI, volume, MACD values, and percentage price change for the latest candle. (Индикатор определяет сигналы хай пампа и донные значения для лонга на основе RSI, MACD, объема, а также отображает показания RSI,Vol,MACD и изменение цены в % в последней свече.)

Avg daily rangeThe Average Daily Range (ADR) is a technical indicator that measures the average price movement of a financial instrument over a specific period.

Volume Change Price NATR Correlation BTC by vadimka77712Volume Change Price NATR Correlation BTC by vadimka77712

Daily/Weekly/Monthly Levels as per INDVIX By Biswaranjan_MDescription: This indicator dynamically draws Daily, Weekly, and Monthly range levels based on the INDIAVIX volatility index. It helps traders visualize potential price zones derived from market volatility and trend behavior.
Note: The indicator dynamically pulls the INDIAVIX value for the previous day and the previous day close of Index (Nifty 50/Bank Nifty/Sensex etc.), then calculates the daily/weekly/monthly ranges as per the user input and draws the levels on the chart as support and resistance.
Key Features:
1. INDIAVIX-Based Range Levels
Calculates projected range levels using the current or past INDIAVIX value, combined with the closing price of the stock or index.
2. Timeframe Flexibility
Choose to display Daily, Weekly, or Monthly levels — each derived from either:
- Today’s close and INDIAVIX, or
- Previous Week/Month close with the corresponding historical INDIAVIX value.
3. Historical Context Mode
Toggle historical mode to project how past levels would have looked using actual INDIAVIX values at the time.
Additional Tools:
* Day Open Line – Marks the opening price of the current trading day.
* Option to add 4 EMAs/SMAs – Moving average for trend following.
* VWAP – Volume-Weighted Average Price for intraday bias and mean reversion analysis.
* Open Range - This option plots the Open Range Box based on the first N minutes of the trading session (e.g., 15, 30, or 60 minutes) and automatically extends the range zone across the entire intraday session up to 3:30 PM.
It is designed for intraday traders, particularly those trading NSE stocks, F&O scripts, and index futures, but works globally on any market with regular intraday sessions.
This all-in-one tool gives you a volatility-informed structure for understanding intraday and positional market dynamics. Designed for any equity/index where INDIAVIX relevance applies.
Release Notes:
In this release, added an option to include a mid level between support and resistance levels.
This mid level option can be enabled or disables from indicators Input tab
Release Notes:
Just rounding down the IndiaVix number.
Release Notes:
Removed the Zero-Lag EMAs and added 4 Moving options to the indicator.
Release Notes:
Added ORB Range to this indicator
Release Notes:
Increased the support and resistance levels from maximum 5 to 10. No other changes to the indicator.

ADX & ATR Display (Table) - Percentage ATROverview:
The "ADX & ATR Display (Table)" is a custom Pine Script indicator designed to provide real-time insights into market trend strength and volatility directly on your chart, presented in a clean, non-intrusive table format. It combines two powerful technical analysis tools: the Average Directional Index (ADX) and the Average True Range (ATR), helping traders quickly grasp current market conditions.
Key Features:
Average Directional Index (ADX):
Purpose: ADX quantifies the strength of a trend, regardless of its direction (up or down). It helps identify if a market is trending strongly or if it's in a ranging (sideways) phase.
Calculation: It is derived from positive (+DI) and negative (-DI) directional indicators, which measure the strength of upward and downward price movements respectively. The indicator then smooths the absolute difference between +DI and -DI.
Interpretation:
ADX values below 25 generally suggest a weak or ranging market.
Values between 25 and 50 indicate the presence of a trending market.
Values above 50 signify a strong trend.
A rising ADX line indicates increasing trend strength, while a falling ADX suggests the trend is weakening.
Display: Your indicator displays the ADX value as a direct numerical score (e.g., 56.5).
Average True Range (ATR):
Purpose: ATR measures the volatility of a market, providing a clearer understanding of the typical price fluctuation over a given period.
Calculation: ATR considers the "true range," which is the largest of three measures: the current high minus the current low, the absolute value of the current high minus the previous close, or the absolute value of the current low minus the previous close. This true range is then averaged over a specified period.
Interpretation:
Higher ATR values indicate higher volatility, meaning prices are experiencing more dramatic movements.
Lower ATR values suggest lower volatility, indicating more stable price action.
Display: Your indicator uniquely displays the ATR value as a percentage (%) of the current closing price, making it easy to compare volatility across different assets or price levels (e.g., 3.97%). This normalized view is particularly useful for position sizing and risk management.
Indicator Display:
This indicator presents both the ADX and ATR values in a compact, customizable table located at the top center of your chart. This allows for a quick, at-a-glance overview of the current market's trend strength and volatility without cluttering the main price action with overlay lines or sub-panes.
Usage:
Traders can utilize this indicator to:
Identify strong trending markets (via ADX) suitable for trend-following strategies.
Recognize ranging or consolidating markets (via ADX) where breakout strategies might be more appropriate.
Gauge market volatility (via ATR) to adjust stop-loss and take-profit levels dynamically.
Compare volatility across different instruments by normalizing ATR to a percentage.
Inputs:
ADX Length: (Default: 14) Adjusts the period for the ADX calculation.
ATR Length: (Default: 14) Adjusts the period for the ATR calculation.

配對交易waynecoin製作2原始策略邏輯
只要zScore大於某個值(如2)就做空ETH做多BTC
只要zScore小於某個值(如-2)就做多ETH做空BTC
但這種方式有時訊號太多、容易假突破、勝率不穩定
優化邏輯目標
1. 降低訊號頻率,過濾掉沒意義的雜訊交易
2. 等到「明顯極端」再動手,讓每一單都更有「均值回歸」的機會
3. 進場後,避免被盤整來回洗掉,強制休息一段時間(冷卻期)再考慮下一單
1. 「極端區才做」:提高入場門檻
以前你設定zScore>2或<-2就進場,這個「門檻」容易被雜訊觸發。
優化方式:把門檻拉高(例如2.5或3),訊號只會在「非常極端」的狀態下才出現,減少亂進場。
2. 「回歸動能確認」:等它真的要回來再做
傳統做法常在zScore剛突破極端值時就馬上進場,結果價格還是繼續爆走,導致虧損。
優化方式:
先等zScore跑到極端區(>2.5或<-2.5),
等它「開始回頭」(例如:zScore從3往下跌,跌破2.5時才進場),
這樣能增加「回歸」動能,少做那種「突破後持續單邊爆走」的盤。
3. 「冷卻期」:強制休息、減少來回被巴
很多交易在平倉後,立刻又收到新訊號反向進場,容易被盤整來回磨。
優化方式:設一個「冷卻期」(例如15根K線),這段期間內不再產生新訊號,即使條件觸發也忽略,讓你有時間等下一波「真正有利的極端機會」。
主要變數說明
plotH:入場門檻(如2.5),zScore超過這個數才考慮進場。
cooldown:冷卻K線數,這段期間內無論有無訊號都不能再進新倉。
last_entry_bar:紀錄上次開倉的bar_index,用於計算冷卻期。
進場邏輯
如果zScore「向上」突破-plotH,並且目前不在冷卻期,則產生一個做多ETH/做空BTC訊號(標籤顯示)。
如果zScore「向下」突破plotH,且不在冷卻期,則產生做空ETH/做多BTC訊號。
每次有訊號進場後,都把last_entry_bar更新為當下K線的bar_index,進入冷卻期。
入場標準差原本設定2.5,但可自行設定峰值,數值設定越高,信號越少
冷卻k線數可以自己設定,當你設定的數值越高,信號越少
Look-Back Periodu也可以自己設定,數值越高回朔時間越長,信號越少
我一直在思考什麼樣的策略適合散戶交易
想了一年多只想到兩種交易
1.對沖策略只吃異常波動率
2.資金費率套利
當前先針對對沖策略來發佈
後續會繼續發表資費套利
**Original Strategy Logic**
As long as the zScore is greater than a certain value (e.g., 2), short ETH and long BTC.
As long as the zScore is less than a certain value (e.g., -2), long ETH and short BTC.
However, this approach sometimes generates too many signals, is prone to false breakouts, and has unstable win rates.
---
**Optimization Goals**
1. Reduce signal frequency and filter out meaningless/noisy trades
2. Wait for "obvious extremes" before taking action, giving each trade a better chance at mean reversion
3. After entry, avoid getting chopped in sideways markets by enforcing a cooldown period before considering the next trade
---
**1. "Only trade in extreme zones": Increase entry threshold**
Previously, you entered whenever zScore > 2 or < -2. This threshold is easily triggered by noise.
**Optimization:** Raise the threshold (e.g., to 2.5 or 3), so signals only appear in "very extreme" conditions, reducing random entries.
**2. "Confirm mean reversion momentum": Wait until it actually starts to revert**
The traditional approach often enters right when zScore first breaks the extreme value, but sometimes price keeps moving in the same direction, leading to losses.
**Optimization:**
* First, wait until zScore reaches the extreme zone (>2.5 or <-2.5),
* Then, wait for it to "start reverting" (for example, zScore falls back below 2.5 from above 3),
* Only enter then. This increases the likelihood of actual mean reversion and avoids getting caught in one-sided trends after the breakout.
**3. "Cooldown period": Force a rest and reduce getting chopped**
Many trades, after closing, immediately receive a new signal and reverse position, which often leads to losses in choppy markets.
**Optimization:** Set a "cooldown period" (e.g., 15 candles). During this time, no new signals are generated—even if conditions are met—allowing you to wait for the next "truly favorable extreme opportunity."
---
**Key Variables**
* `plotH`: Entry threshold (e.g., 2.5). Only consider entries when zScore exceeds this value.
* `cooldown`: Number of cooldown candles. No new entries can be made during this period, regardless of signals.
* `last_entry_bar`: Records the bar\_index of the last entry, used to calculate the cooldown period.
---
**Entry Logic**
* If zScore breaks upwards through -plotH and you’re not in a cooldown period, generate a long ETH/short BTC signal (show a label).
* If zScore breaks downwards through plotH and not in a cooldown period, generate a short ETH/long BTC signal.
* Every time you enter a trade, update `last_entry_bar` to the current bar\_index and enter the cooldown period.
The entry standard deviation threshold is originally set to 2.5, but you can set it to any peak value you prefer—the higher the value, the fewer the signals.
The cooldown candle count is also customizable; the higher the value, the fewer the signals.
The look-back period is adjustable as well; the higher it is, the longer the historical window considered, and the fewer the signals.
---
I’ve been thinking for over a year about what kind of strategies are suitable for retail traders.
After all this time, I’ve only come up with two types:
1. Hedge strategies that only capture abnormal volatility
2. Funding rate arbitrage
Currently, I’m publishing the hedge strategy first.
I’ll continue to share funding rate arbitrage in the future.

配對交易waynecoin製作2_回歸零即止盈進場:兩個幣價差大幅偏離平均值(超過設定標準差),認為出現「極端偏差」,所以進行配對交易
出場:只要 zScore 回到 0,即「兩幣回歸均值關係」,立刻平倉
冷卻機制:每次出場後,必須經過設定的K線數才能再次進場,有效減少過度頻繁交易
這種回歸0止盈法的優點
減少來回掃損:避免只在邊界平倉(如 zScore 回到 1),能抓到更大一段的均值回歸
簡單直觀:規則容易判斷,不需要額外判斷趨勢或震盪
適合盤整行情:這種策略在橫盤或均值回歸明顯的市場表現較好
需搭配wayncoin製作2來使用,因為腳本原因他一次只能單筆持倉,所以相比較wayncoin製作2會遺漏一些信號,但可以這版本的離場信號做為離場,在該跟k線收盤後出現離場信號在做離場
Entry: When the price spread between the two coins deviates significantly from the mean (exceeds the set standard deviation), this is considered an "extreme deviation," so a pairs trade is initiated.
Exit: As soon as the zScore returns to 0—meaning the price relationship between the two coins has reverted to the mean—the position is closed immediately.
Cooldown mechanism: After each exit, a specified number of candlesticks must pass before a new entry is allowed, effectively reducing over-trading.
Advantages of the “exit at zScore=0” method:
Reduces whipsaw losses: By avoiding exits at just the boundaries (e.g., zScore returning to 1), it can capture a larger portion of the mean reversion move.
Simple and intuitive: The rules are easy to follow, without needing to judge additional trends or market regimes.
Well-suited to ranging markets: This strategy performs better in sideways or clearly mean-reverting markets.
Note:
This method should be used together with “waynecoin version 2.” Due to script limitations, it only allows one position at a time, so compared to waynecoin version 2, some signals may be missed. However, you can use the exit signals from this version to close positions—when an exit signal appears after the close of the corresponding candlestick, close the position.


EscobarTrades:- Session Opens/Box's)Marks out session opens for you, Shows you different sessions with color boxes


RAHA - Roni's Adjusted Hybrid AverageRoni's Hybrid Moving Average Oscillator
Each value in the series is weighted inversely to its distance from the mean, meaning that outliers have less impact.
The indicator reduces distortions caused by extreme movements.
More suitable for cases such as volatile stocks.
מתנד הממוצע ההיברידי של רוני
כל ערך בסדרה מקבל משקל הפוך למרחקו מהממוצע כלומר חריגים משפיעים פחות.
האינדיקטור מצמצם עיוותים שנגרמים על ידי תנועות קיצוניות.
מתאים יותר למקרים כמו מניות תנודתיות.

Setra Alert by Sekolah Trading🔷 How It Works
Dynamic Pair & Timeframe Detection
Auto-detects current symbol and timeframe
Applies correct pip threshold for each pair:
XAUUSD, USDJPY, GBPUSD, AUDUSD, EURUSD, BTCUSD, etc.
Timeframes: 5m, 15m, 1h
Candle Structure Filtering
Body = abs(close - open)
Wick = upper + lower shadow
Must pass wick ratio condition (≤ 30%)
Signal Conditions
Body ≥ threshold
Wick ≤ 30%
Clear bullish or bearish structure
Visual Output
🔺 Blue triangle = Bullish momentum
🔻 Red triangle = Bearish momentum
🔷 Alert System Explanation
This script provides two built-in alert conditions:
✅ Momentum Bullish
Triggers when:
Large bullish body
Wick ≤ 30%
Final 20–90 seconds of candle
Confirmed real-time (no repaint)
✅ Momentum Bearish
Same conditions applied to bearish candles
🔔 How to Set Alerts
Add alert on chart
Choose condition: Momentum Bullish or Momentum Bearish
Set frequency: Once Per Bar
Customize message, e.g.:
“Bullish momentum on XAUUSD M15”
Alerts help traders prepare entries before the candle closes.
🔷 How to Use
Load the script on a 5m, 15m, or 1h chart
Adjust pip values for your pair via input menu
Watch for triangle markers near candle close
Combine with:
Trend indicators (EMA, Supertrend)
S/R levels, breakouts, or liquidity zones
Optional volume or order flow confirmation
🔷 Why This Script is Closed-Source
This version includes protected logic developed by Sekolah Trading, including:
Dynamic pip calibration
Wick/body structural filtering
Non-repainting real-time alert logic
While the code is protected to prevent misuse, all logic and intent have been clearly explained here as required by TradingView's House Rules.
🔷 Disclaimer
This tool is meant for technical analysis and educational purposes only. It is not financial advice, and no signal is guaranteed. Always use proper risk management and confirm trades independently.

Z-Score + Momentum Strategy (Filtered)✅ What the script does:
Calculates the Z-Score of price with EMA smoothing.
Calculates Momentum as the difference between the current price and the price n bars ago.
Generates signals:
Buy: When the Z-Score is rising and relatively positive, and momentum is increasing.
Sell: When the Z-Score is falling, and momentum is decreasing.
Plots BUY and SELL labels on the candles.
Provides alerts that can be activated from the TradingView settings.
Displays Z-Score and Momentum in the lower pane of the chart.
🎯 How to use the script:
Copy the code into the Pine Editor on TradingView.
Click "Add to Chart".
Enable alerts using the alertcondition settings.
You can modify the following parameters:
Z-Score period: length
Momentum lookback period: momentumLength
Z-Score entry threshold: threshold

RAHA Indicator📈 RAHA Indicator
Roni's Adjusted Hybrid Average
The indicator developed by Aaron Roni Pesach combines an innovative RAHA average - an adjusted hybrid average with smart trend analysis, using additional oscillators in a sophisticated way.
LONG and SHORT signals are given only when:
✅ Technical conditions confirm
✅ And the long-term trend is consistent
RAHA Indicator helps traders identify entry points while filtering out noise and market anomalies.
📈 RAHA Indicator
Roni's Adjusted Hybrid Average
האינדיקטור שפותח על ידי אהרון רוני פסח משלב ממוצע חדשני מסוג RAHA - ממוצע היברידי מתואם עם ניתוח מגמה חכם, באמצעות שימוש במתנדים נוספים באופן מתוחכם.
איתותי LONG ו‑SHORT ניתנים רק כאשר:
✅ התנאים הטכניים מאשרים
✅ והמגמה בטווח ארוך תואמת
RAHA Indicator מסייע לסוחרים לזהות נקודות כניסה תוך סינון רעשים וחריגות שוק.

Icy-Hot Visual Indicator [SciQua]🧊 Icy-Hot Visual Indicator
This indicator colors your price bars and/or chart background based on a normalized & smoothed transform of any price-based input (default: close). It gives you a quick “temperature map” of market momentum or volatility—cool blues for low readings, hot reds for high readings—without cluttering your chart.
🔍 Key Features
1. Dual Visual Layers
Candle Gradient: Applies a smooth, multi-color gradient to candle bodies and wicks based on normalized, smoothed input data
Background Gradient: Adds a semi-transparent gradient behind the candles to highlight broader trend zones or volatility regimes
2. Advanced Customization
Normalization Types: bounded, unbounded, z-score, MAD, percentile, sigmoid, tanh, rank, robust, and more
Smoothing Methods: EMA, SMA, WMA, RMA, HMA, TEMA, VWMA, Gaussian, LinReg, ExpReg, and others (12+ options)
3. Gradient Control: Choose 2–7 color stops, reverse direction, adjust display length
Flexible Source Inputs
Use any built-in price series (close, hl2, volume, etc.)
Feed outputs from external indicators (RSI, custom oscillators, moving averages) into either layer
❓How It Works
Inputs are normalized (z-score, bounded, etc.) then smoothed (EMA, LinReg, etc.) in the order you choose. The result is clamped to 0–1 and passed through a multi-stop gradient engine for precise color mapping.
✨ What Makes It Original
While many indicators apply colors or smoothing, this script combines multi-stage normalization, adaptive smoothing, and a modular gradient rendering engine in a highly customizable dual-layer system. It’s built using proprietary functions from the SciQua suite that are not available in public libraries and allow for advanced visual encoding without relying on alerts, signals, or extra panes.
This makes it original in both design and execution—offering a visual-first approach with unique depth, clarity, and flexibility.
🔐 Why This Script Is Closed-Source
While the underlying functions are published in the open-source SciQua library, this indicator’s specific implementation, configuration architecture, and visual behavior are proprietary. It combines multiple library utilities into a dual-layer adaptive system that handles advanced gradient rendering, multi-stage normalization, and smoothing pipelines in a unique way.
The source is closed to protect the design logic, interface abstraction, and fine-tuned behaviors that make this indicator commercially valuable. The building blocks are open to the Pine community, but this assembled product is not meant for replication or redistribution.
How to Use It
1. Highlight Trend Strength
Source: RSI percentile
Setup: 200-bar look-back, mild smoothing
Result: Warm tones when momentum is peaking; cool when it’s fading. Use as a quick filter for entries in the direction of the trend.
2. Visualize Volatility Regimes
Source: ATR or True Range
Setup: Bounded normalization with tighter smoothing bar color off, bg color on.
Result: Background bands that shade when volatility spikes. Helps you avoid low-volatility breakouts or throttle position sizing in choppy markets.
3. Combine with Other Indicators
Source: Output of your custom indicator (e.g., a Keltner Band width)
Setup: Match normalization period to your strategy’s timeframe
Result: Bars colored by your own logic—no extra panes, just enhanced candles.
4. Background Only Heatmap
Turn off bar coloring and dial in semi-transparent background shades—keeps candles crisp while still giving you a context heat-map behind price.