Historical Volatility with HV Average & High/Low Trendlines
### 📊 **Indicator Title**: Historical Volatility with HV Average & High/Low Trendlines
**Version**: Pine Script v5
**Purpose**:
This script visualizes market volatility using **Historical Volatility (HV)** and enhances analysis by:
* Showing a **moving average** of HV to identify volatility trends.
* Marking **high and low trendlines** to highlight extremes in volatility over a selected period.
---
### 🔧 **Inputs**:
1. **HV Length (`length`)**:
Controls how many bars are used to calculate Historical Volatility.
*(Default: 10)*
2. **Average Length (`avgLength`)**:
Number of bars used for calculating the moving average of HV.
*(Default: 20)*
3. **Trendline Lookback Period (`trendLookback`)**:
Number of bars to look back for calculating the highest and lowest values of HV.
*(Default: 100)*
---
### 📈 **Core Calculations**:
1. **Historical Volatility (`hv`)**:
$$
HV = 100 \times \text{stdev}\left(\ln\left(\frac{\text{close}}{\text{close} }\right), \text{length}\right) \times \sqrt{\frac{365}{\text{period}}}
$$
* Measures how much the stock price fluctuates.
* Adjusts annualization factor depending on whether it's intraday or daily.
2. **HV Moving Average (`hvAvg`)**:
A simple moving average (SMA) of HV over the selected `avgLength`.
3. **HV High & Low Trendlines**:
* `hvHigh`: Highest HV value over the last `trendLookback` bars.
* `hvLow`: Lowest HV value over the last `trendLookback` bars.
---
### 🖍️ **Visual Plots**:
* 🔵 **HV**: Blue line showing raw Historical Volatility.
* 🔴 **HV Average**: Red line (thicker) indicating smoothed HV trend.
* 🟢 **HV High**: Green horizontal line marking volatility peaks.
* 🟠 **HV Low**: Orange horizontal line marking volatility lows.
---
### ✅ **Usage**:
* **High HV**: Indicates increased risk or potential breakout conditions.
* **Low HV**: Suggests consolidation or calm markets.
* **Cross of HV above Average**: May signal rising volatility (e.g., before breakout).
* **Touching High/Low Levels**: Helps identify volatility extremes and possible reversal zones.
Volatility

Velocity + Momentum (SMA-Based)Velocity + Momentum (SMA-Based) is a clean, powerful oscillator that measures price acceleration using SMA-derived velocity and dual momentum signals. This tool is ideal for identifying directional shifts, exhaustion points, and early entries across any market or timeframe.
How It Works:
This indicator calculates velocity as the distance between the current close and a simple moving average of the open price. Then, it applies two smoothed moving averages to this velocity line:
• Internal Momentum (shorter-term smoothing)
• External Momentum (longer-term context, hidden by default)
The result is a layered view of how fast price is moving and whether that move is gaining or losing strength.
How to Use:
• The green/red histogram shows current velocity (positive = bullish, negative = bearish)
• The teal/maroon line tracks internal momentum and provides short-term signal turns
• The black/gray (hidden) line reflects external momentum and supports broader trend alignment
• Watch for crosses above/below the zero line for confirmation of directional strength
• Use the built-in alerts to catch real-time shifts in all three layers of movement: velocity, internal, and external
Why It's Useful:
• Detects subtle transitions before price structure changes
• Helps filter out noise by comparing short-term vs long-term motion
• Ideal for scalpers, swing traders, and trend-followers alike
• Pairs well with structure-based tools or price action zones
• Works on any asset and timeframe
This indicator simplifies momentum analysis by giving you actionable, multi-layered feedback on how price is accelerating — and when that’s likely to reverse.

0.7x ATR (5m)5Minute ATR Length 14 times 0.7.
Great for scalping M1 Dow Jones counter trend and protrend.

ATR Rangeshows the high and low of the given range of the asset base on the daily atr fixed by the weekly trend.

Supply & Demand Zones with Touch CountSupply and demand zones usually mean areas where price reversed multiple times, acting like support (demand) or resistance (supply).

Alpha X Quant EngineAlpha X Quant Engine
A high-integrity execution framework combining volatility triggers, momentum dynamics, and structural bias.
🔷 Purpose
Alpha X Quant Engine is built to detect asymmetric trade opportunities with precision. It filters high-conviction entries using data-driven momentum and volatility logic, combined with price structure awareness.
🔷 Core Principles
1. Volatility Surge Detection
Leverages Z-score analysis of volume to identify market “spikes” that often precede structural breaks or reversals.
2. Momentum Alignment
Tracks short-term and high/low MA slope dynamics via Z-score normalization and ROC (rate-of-change) momentum to confirm directional bias.
3. Structural Confluence
Utilizes fair value gap (FVG) bias and wick-trap rejection logic to determine whether price is breaking with conviction or faking out.
🔷 Trade Types Supported
Breakout Continuations
Reversal Traps
Expansion Triggers
Fair Value Gap Validations
🔷 Why It Works
Alpha X is not reactive—it’s anticipatory. By requiring multi-signal alignment, it filters noise and reduces false entries, delivering high-integrity trade setups adaptable to trend and chop.

Bid/Ask Volume Tension with Rolling Avg📊 Bid/Ask Volume Tension with Rolling Average
This indicator is designed to help traders identify pivotal moments of buildup, exhaustion, or imbalance in the market by calculating the tension between buy and sell volume.
🔍 How It Works:
Buy volume is approximated when the candle closes higher than or equal to its open.
Sell volume is approximated when the candle closes below its open.
Both are smoothed using an EMA (Exponential Moving Average) for noise reduction.
Tension is calculated as the absolute difference between smoothed buy and sell volume.
A rolling average of tension shows the baseline for normal behavior.
When instant tension rises significantly above the rolling average, it often signals:
A build-up before a large move
Aggressive order flow imbalances
Potential reversals or breakouts
🧠 How to Use:
Watch the orange line (instant tension) for spikes above the aqua line (rolling average).
Purple background highlights show when tension exceeds a customizable multiple of the average — a potential setup zone.
Use this indicator alongside:
Price action (candlestick structure)
Support/resistance
Liquidity zones or order blocks
⚙️ Settings:
Smoothing Length: Controls the responsiveness of buy/sell volume smoothing.
Rolling Avg Window: Defines the lookback period for the baseline tension.
Buildup Threshold: Triggers highlight zones when tension exceeds this multiple of the average.
🧪 Best For:
Spotting pre-breakout tension
Detecting volume-based divergences
Confirming order flow imbalances

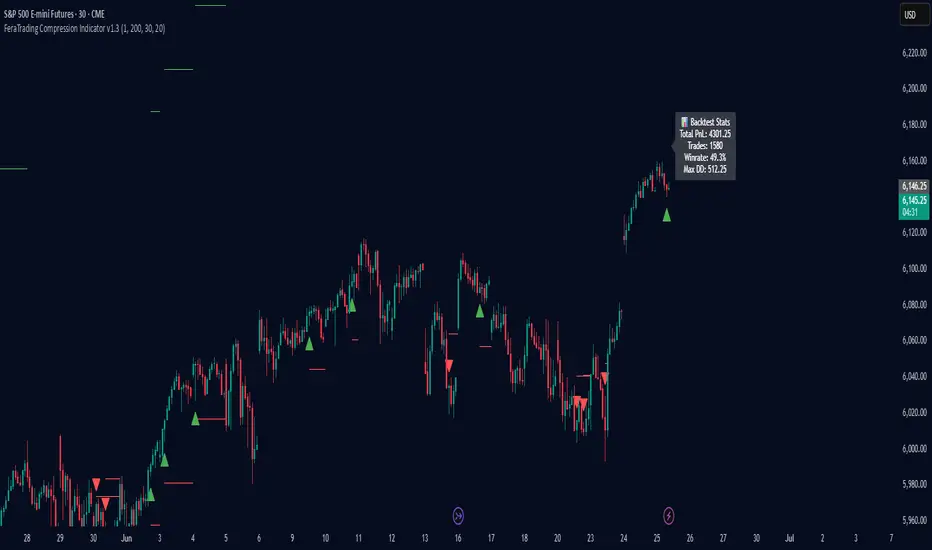
FeraTrading Compression Indicator v1.3🧠 Overview:
The FeraTrading Compression Indicator v1.3 identifies early-stage directional breakouts that follow periods of volatility contraction. This tool is built for intraday traders looking to catch clean breakouts out of tight consolidations. It doesn’t just detect compression—it confirms when that compression is being forcefully released with directional intent.
By combining volatility filtering, trend structure via EMAs, body dominance checks, and an optional session filter, the indicator isolates breakout signals with a high degree of confluence. Users can optionally enable a Signal Flip mode to invert long/short logic—useful in mean-reverting environments or inverse structures.
⚙️ How It Works:
🔹 Volatility Compression Detection:
Compression is detected using a relative ATR comparison between short-term and long-term range averages.
When the short-term range falls below a threshold, the market is considered to be compressing.
This approach is fully adaptive—self-scaling across different asset types and timeframes.
🔹 Breakout Confirmation Logic:
A breakout is confirmed only when the following conditions align:
Range Expansion:
The breakout candle must exceed the long-term average range—confirming actual price expansion.
Strong Candle Body:
The body must represent a significant portion of the candle’s range, confirming momentum and directionality.
EMA Trend Alignment:
The script checks that a fast EMA is properly aligned with a slower EMA and that the candle closes beyond the fast EMA in the correct direction.
Optional Session Filter (08:30–11:30 EST):
Focuses signals to the high-volume portion of the day, increasing reliability. Can be disabled for full-session use.
Signal Flip Option:
Reverses signal logic for assets that often fade breakouts or move counter to structural expectations.
🧪 Built-In Backtester:
The script includes a bar-level backtester, enabling users to simulate SL/TP outcomes and visualize strategy performance directly on the chart.
🧮 Logic & Assumptions:
Trades enter at the open of the signal bar.
SL/TP levels are applied immediately.
If both are hit on the same bar, SL is assumed to hit first (for realism).
An optional setting closes trades at the end of day.
📊 Visual Feedback:
TP and SL levels are plotted in real time.
A stats box displays:
Win rate
Total trades
Max drawdown
Cumulative PnL
This provides an instant read on strategy behavior using your exact market view.
🎯 What Makes It Original:
Compression breakout logic without oscillators: Signals are built from candle structure, EMA alignment, and raw volatility—no lagging tools required.
Real-time SL/TP backtesting: Built-in engine allows traders to test performance without switching tools or exporting data.
Modular logic design: Session filters, signal flip, and compression strictness can be tailored to different markets and conditions.
Minimal input, deep logic: Two volatility filters, two EMAs, and a candle body check combine into a layered signal system that adapts in real time.
This balance of simplicity and structural precision makes it highly versatile for active day traders across asset classes.
✅ How to Use:
Add the script to any chart (1m–15m ideal).
Watch for triangle signals:
Green = bullish breakout
Red = bearish breakout
Toggle session filters or signal flip as needed.
Enable the backtester to visualize edge over time.
Combine with structure, liquidity zones, or volume tools for confluence.
This indicator is best deployed during active market hours when breakout momentum has the highest chance of follow-through.
💎 Why It’s Worth Paying For
The FeraTrading Compression Indicator v1.3 is not just another breakout tool—it is a modular signal system with embedded trade testing logic, built specifically for real-world trading environments.
What makes it premium:
Live confluence-based signals with real volatility and momentum context
Custom-built SL/TP backtester with chart-based visual performance feedback
Non-repainting, directional logic with trend and structure confirmation
Adaptive signal behavior via session and flip toggles
Designed for real execution, not just visual alerts
The blend of signal accuracy, trade simulation, and structural adaptability makes this script more than an entry indicator—it’s a breakout testing and execution framework, ready to plug into any strategy.
✅ Compliance & Originality
This script was written entirely from scratch using original compression logic, trend structure filtering, and trade simulation. It does not reuse any public code, open-source snippets, or repackaged modules. All calculations, condition checks, visuals, and stats logic are unique to this tool. EMA's and ATR were used in filter logic, yet they are only 2 of many filters used, all of the others being fully custom built.
⚠️ Risk Disclaimer & Access Policy
This tool does not predict market direction or guarantee trade results. It provides a rule-based breakout signal structure designed to align with price expansion logic.
Always use your own risk management practices and trade plans. This script is meant as a supportive tool, not a financial advisory system.
🔒 Why This Script Is Invite-Only and Closed-Source
To preserve the tool’s edge and prevent unauthorized replication, the script is invite-only and closed-source.
The following features are proprietary:
Compression zone and range expansion filter logic
Real-time SL/TP backtesting engine
Signal flip and session filtering integration
Confluence layering using structure, volatility, and body-based validation
Opening the source would expose key mechanics and reduce the integrity of the strategy’s edge. Closed access ensures the system remains performant, exclusive, and trusted by serious traders.
FeraTrading Compression Flow v1🧠 Overview:
The FeraTrading Compression Flow v1 identifies moments in the market where volatility contracts and directional momentum builds beneath the surface. It detects when price compresses into a tight range, then confirms when momentum, volatility, and trend alignment combine to signal a high-probability breakout. Once all conditions are met, the indicator activates a persistent directional bias, shown visually with colored dynamic bands.
This isn’t just another squeeze or Bollinger-style compression indicator—it adds multi-layered confirmation logic and unique bias persistence mechanics, helping traders stay aligned with trend-based breakout phases rather than just spotting volatility drops.
⚙️ How It Works:
🔹 Volatility Compression Detection:
Uses a relative ATR filter to detect when the market is in contraction.
Compares short-term range behavior to a longer-term average using a customizable multiplier.
Avoids standard band-width logic (like BB/KC), instead relying on raw candle volatility for more adaptive compression detection.
🔹 Breakout Confirmation Logic:
A breakout is confirmed only when all of the following align:
Strong Candle Body: Filters out indecision bars and ensures clear directional intent.
EMA Trend Structure: Fast EMA must be properly aligned with the slow EMA, and price must close beyond the fast EMA in the breakout direction.
Range Burst: Breakout candle must exceed historical range norms, confirming an actual volatility expansion—not a false breakout.
Each layer is required—no single condition is enough—creating a highly selective confirmation system that filters out noise.
🔹 Bias Persistence Mechanism:
Once a valid breakout is confirmed, the script activates a persistent directional bias (bullish or bearish).
The bias does not flip unless an opposing breakout confirms.
This eliminates premature resets and allows traders to hold trend alignment visually until true reversal conditions are met.
🎨 Visual Behavior:
📈 Band Calculations:
Bands are drawn using smoothed highs and lows, plus or minus a scaled ATR-based buffer.
They adjust dynamically to both price scale and volatility, expanding and contracting naturally with the market.
🎨 Band Coloring:
Green bands = Bullish breakout confirmed
Red bands = Bearish breakout confirmed
No color = Compression detected, but no directional breakout yet
These are not support/resistance levels. They are momentum flow visualizations, providing a clean, unobtrusive way to track trend phases post-compression.
💡 What Makes It Unique:
Multi-confirmation logic: Combines compression, candle strength, trend direction, and volatility surge into one system.
Bias memory: Maintains directional bias until structurally invalidated—not just until the next indecisive bar.
Volatility-scaled bands: Makes this system flexible across all assets and timeframes, without constant tweaking.
No lagging oscillators: Instead of using MACD/RSI, it reads real-time momentum through body-to-range relationships and EMA stacking.
Minimal input, maximum output: With only two adjustable inputs, the script remains simple to deploy while offering deep contextual information.
✅ How to Use It:
Add the indicator to any chart (15m and lower preferred).
Watch for band color changes:
Green = Bullish breakout phase
Red = Bearish breakout phase
Use band direction as a trend alignment filter.
Avoid trading against active bias unless part of a confirmed reversal setup.
Adjust the Input Multiplier to fine-tune compression strictness (lower = stricter, higher = more permissive).
This indicator is especially useful following periods of consolidation and works well when layered with structure, supply/demand zones, or volume overlays.
💎 Why It’s Worth Paying For
The FeraTrading Compression Flow v1 offers a uniquely structured approach to breakout detection. While most compression indicators only highlight low-volatility zones, this script confirms breakouts through confluence, activates persistent bias, and provides a visual flow overlay that dynamically adjusts to the market.
Key distinctions include:
A custom ATR-based compression filter that adapts to any asset
Breakout confirmation from price structure, EMAs, and body dominance
A bias persistence engine that filters out false flips and maintains trend visibility
Dynamic bands that scale based on both price and volatility—not just moving averages
This combination cannot be replicated with built-in indicators or open-source scripts. It reflects real trade experience, structural logic, and volatility awareness built into a visual format designed to reduce overtrading and improve signal trust.
✅ Compliance & Originality
This script was built entirely in-house using original logic. Every calculation—from compression detection to bias activation—is proprietary and coded from scratch. No open-source libraries or reused components are present. Band rendering, bias conditions, and signal architecture were designed specifically for this model. EMA's and ATR were used in filter logic, yet they are only 2 of many filters used, all of the others being fully custom built.
The script uses no external data sources and is built entirely on native Pine Script logic.
⚠️ Risk Disclaimer & Access Policy
This tool is a visual momentum and structure tracking overlay. It does not predict future price movement and should not be used in isolation to make trading decisions. Always apply proper risk management, position sizing, and market awareness.
Past performance does not guarantee future results.
🔒 Why This Script Is Invite-Only and Closed-Source
The compression detection logic, multi-step breakout confirmation, and persistent bias engine represent proprietary intellectual property developed for high-clarity directional tracking.
Releasing this logic would expose the core detection methods to copycats and diminish its edge. Access is restricted to protect:
The custom compression logic
The confluence-based breakout filters
The bias state engine and dynamic band visualizations
Closed-source protection ensures this tool retains its uniqueness and value for serious traders.

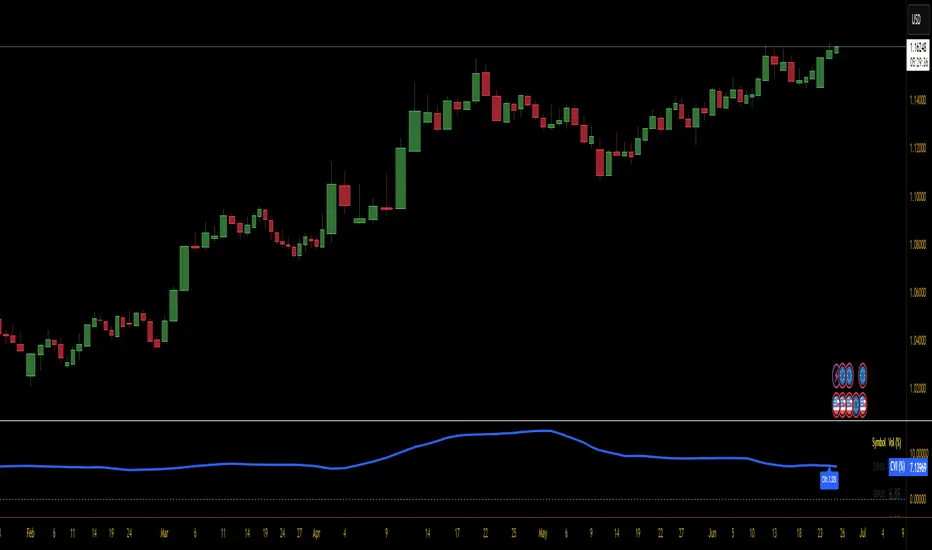
Currency Volatility Index (CVI)This Currency Volatility Index (CVI) indicator aggregates the realized volatility of the eight “major” FX pairs into a single, tradable series—much like an FX-version of the VIX. Here’s what it does step by step:
Inputs & Settings
• Volatility Length (default 20 days): the lookback over which daily log-returns’ standard deviation is computed.
• Data Timeframe (default Daily): the resolution at which price data is fetched for each pair.
• Smoothing Length (default 5): the period of a simple moving average applied to the raw, averaged volatility (in %).
Pair-by-Pair Volatility Calculation
For each hard-coded symbol (EURUSD, GBPUSD, USDJPY, USDCHF, AUDUSD, USDCAD, NZDUSD, EURGBP):
Pull the series of daily closes.
Compute the series of log-returns: ln(today’s close / yesterday’s close).
Calculate the standard deviation of those log-returns over your lookback.
Annualize it (×√252) to convert daily volatility into an annualized figure.
Aggregation
The eight annualized volatilities are averaged (equal weights).
The resulting number is then multiplied by 100 to express it as a percentage.
Smoothing & Plotting
A simple moving average over the aggregated volatility smooths out spikes.
The smoothed CVI (%) is plotted as a standalone line below price charts.
Visualization Aids
A small table in the top-right corner shows each pair’s current volatility in percent.
A dynamic label on the final bar prints the latest CVI value directly on the chart.
Why use it?
Gives a one-stop measure of overall FX market turbulence.
Helps you compare “quiet” vs. “volatile” regimes across currencies.
Out of the Noise Intraday Strategy with VWAP [YuL]This is my (naive) implementation of "Beat the Market An Effective Intraday Momentum Strategy for S&P500 ETF (SPY)" paper by Carlo Zarattini, Andrew Aziz, Andrea Barbon, so the credit goes to them.
It is supposed to run on SPY on 30-minute timeframe, there may be issues on other timeframes.
I've used settings that were used by the authors in the original paper to keep it close to the publication, but I understand that they are very aggressive and probably shouldn't be used like that.
Results are good, but not as good as they are stated in the paper (unsurprisingly?): returns are smaller and Sharpe is very low (which is actually weird given the returns and drawdown ratio), there are also margin calls if you enable margin check (and you should).
I have my own ideas of improvements which I will probably implement separately to keep this clean.

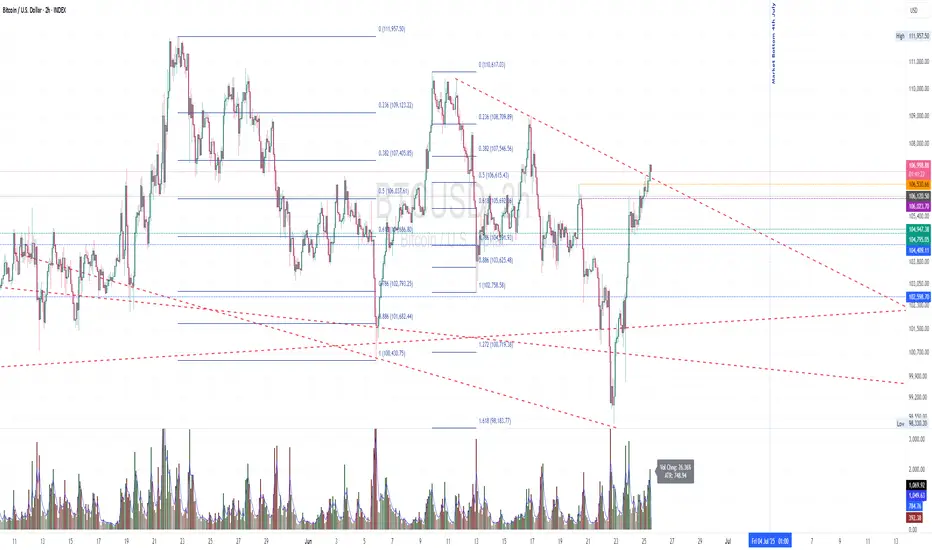
Expanded Cloud [LuxAlgo]The Expanded Cloud tool allows traders to identify and follow trends accurately. It is based on the well-known Donchian Channels, but with enhanced features.
It features a trailing cloud that expands with the price and a trading stats dashboard.
🔶 USAGE
The tool is super easy to use. Traders can identify bigger or smaller trends just by adjusting the length from the settings panel.
Trend identification is based on Donchian Channels. An uptrend is indicated when the cloud is located below the price, while a downtrend is indicated when the cloud is above it.
Dots signal the start of a new trend, and the width of the clouds identifies the strength of the price expansion. The wider the cloud, the bigger the move.
The expanded cloud, due to its visual, can also act as a trailing stop.
🔹 Trend Identification
As we can see in the chart above, different length values identify different trends on the same BTC daily chart. Larger values identify larger trends.
🔹 Cloud Expansion
From the settings panel, traders can adjust how the clouds expand based on the Expansion % parameter. It accepts values from 0 to 100, which controls how much of the expansion is taken into account. Higher values will make the cloud expand and get closer to the price faster.
When the cloud moves opposite to the direction of the indicated trend (e.g: the cloud decreases while being below the price), it is often indicative of the end of a retracement, and we can expect the price to move with the indicated trend.
The chart above shows the effect of different Expansion % values.
🔹 Dashboard
The trading statistics dashboard informs traders of key metrics derived from the tool. The following are notable:
PNL: Theoretical profit or loss from all trends identified by the tool in the right scale units.
EXPECT.: Expected value of each trade. It is derived from win rate and risk-to-reward metrics.
AVG: 1st TOUCH: The average number of bars from the beginning of a new trend until the price touches the cloud for the first time.
🔶 SETTINGS
Length: Length for trend detection
Expansion %: Percentage of price expansion for cloud formation
Source: Source of the data
🔹 Dashboard
Show Dashboard: Enable/disable the statistics dashboard
Location: Dashboard location
Size: Dashboard size

NASDAQ Reaper📈 NASDAQ Reaper – The Ultimate Wall Street Killer
The NASDAQ Reaper is a highly advanced Smart Money Concepts (SMC) + Price Action based indicator, engineered for traders who demand accuracy, precision, and real-time edge in the NASDAQ (NQ) market.
This tool was crafted for serious traders looking to dominate the charts with institutional-grade logic, featuring:
✅ Smart Buy/Sell Zones
✅ Opening Range Breakout (ORB) Detection
✅ Volume Confirmation for Strong Entries
✅ Real-Time Entry & Exit Signals
✅ Trend & Momentum Alignment (Multi-Timeframe Logic)
✅ Trailing TP & SL with Visual Feedback
✅ Backtest Module for Strategy Validation
💡 Designed to filter noise and highlight only high-probability setups, NASDAQ Reaper helps you stay one step ahead of retail traders and ride the moves the smart money makes.
🔔 Works best on:
• 5M, 15M, and 30M charts
• London and New York sessions
• Scalping or intraday swing strategy
Whether you're aiming for 50+ tick scalps or sniper entries aligned with trend reversals, this is your secret weapon to level up your trading game.

CM Volume Projection Indicator with ATRCM Volume Projection Indicator
Description:
Elevate your trading analysis with the CM Volume Projection Indicator, a pioneering tool crafted for Trading View charts. This closed-source indicator redefines volume analysis by delivering dynamic, real-time volume forecasts, offering traders a nuanced understanding of market momentum across diverse timeframes and assets.
Key Features:
Dynamic Volume Projection: Utilizes a proprietary algorithm to generate both original and adjusted volume projections, blending current bar elapsed time with historical averages. This creates a tailored forecast that adapts to market conditions, surpassing the limitations of static volume bars.
Percentage-Based Time Adjustment: Incorporates a customizable time factor based on the percentage of remaining candle duration (default 16.67%), enabling precise scaling across timeframes. This innovative approach minimizes overestimation by adjusting projections dynamically as the candle nears completion.
Volume Change Percentage: Introduces a unique metric by comparing current volume to the proportional volume at the same elapsed time in the previous candle, capturing intrabar momentum shifts that traditional indicators, reliant on full candle data, overlook.
Adaptive Spike Factor: Enhances responsiveness by adjusting projections based on volume spikes relative to a moving average, while stabilizing low-volume periods, ensuring reliability in volatile markets.
Fully Customizable Settings: Offers user-controlled adjustments via the strategy bar—including historical averaging period, minimum adjustment factor, spike threshold, moving average type (SMA or EMA), cap threshold percentage, and scaling factor—allowing tailored application without script access.
Visual Customization: Provides color-coded bars and labels for clear interpretation, with optional debug and elapsed time displays for advanced analysis.
How It Works and Adds Value:
The CM Volume Projection Indicator combines a linear scaling of previous candle volume (proportional to elapsed time) with a dynamic cap based on the remaining time percentage, refined by a squared time factor and volatility adjustments. This synergy creates an original intrabar forecasting model that:
Forecasts in Real-Time: Provides forward-looking projections, aiding anticipation of volume trends within the current candle, adaptable to any timeframe.
Delivers Intrabar Precision: Tracks momentum shifts by comparing elapsed-time volumes, offering a granularity static indicators like OBV or volume bars cannot match.
Adapts Across Timeframes: Uses percentage-based caps to ensure consistency, reducing misleading spikes during volatile periods, a step beyond traditional moving average-based tools.
Empowers Strategy: Integrates current volume, moving averages, and adaptive adjustments into a versatile metric, giving traders a strategic edge in diverse market conditions.
Ideal For:
Day traders and scalpers seeking real-time volume insights across short timeframes.
Swing traders analyzing momentum shifts within candles on various durations.
Technical analysts customizing indicators for diverse assets and market environments.
This indicator enhances market analysis as a valuable additional tool, success depends on your strategy and risk management. Explore its potential by adjusting settings via the strategy bar to suit your trading style and leverage its innovative projections in today’s dynamic markets.
Hodie Smart Inside BarThe Hodie Smart Inside Bar indicator automatically detects and visually highlights inside bars — candles fully contained within the range of the previous (parent) candle.
How the indicator works:
Inside Bar Identification:
The indicator analyzes each candle and checks if its high is lower than the previous candle’s high, and its low is higher than the previous candle’s low. If this condition is met, the candle is considered an inside bar.
Size Filtering:
To filter out small and insignificant consolidations, the indicator compares the size of the parent candle’s range to the inside bar’s range. Only if the parent candle is significantly larger (2 times or more — adjustable parameter), the inside bar is considered significant.
Zone Drawing:
For each detected inside bar, the indicator draws a rectangular zone bounded by the parent candle’s high and low. This zone automatically extends to the right as new bars appear until the price moves outside the parent candle’s range.
Zone Completion:
Once the price closes above the parent candle’s high or below its low, the zone is considered complete and stops extending.
Visual Aids:
If enabled, the indicator can shade the background of the current inside bar for additional visual emphasis.
A label with the text "IB" appears above the inside bar candle on the chart for easier identification.
Alerts:
Supports alerts when a new inside bar forms.
Alerts help traders notice important signals promptly.
To activate, create an alert on the indicator with the condition “New Inside Bar”.
Benefits of the Indicator:
Inside bars often signal consolidation and potential liquidity accumulation, which may be followed by a strong impulsive breakout. This indicator helps traders quickly identify consolidation zones and prepare for possible price moves.

[Myth Busting] [ORB] Casper SMC - 16 JunJust showcase of YouTube strategy claimed to be profitable and fool proof. Not on every asset and not long-term though

NEIROCTO Impulse Watcher (Alert Ready)//@version=5
indicator("NEIROCTO Combo Watcher (Pump vs Dump)", overlay=true)
// === RSI и его производные ===
rsi = ta.rsi(close, 14)
rsi_sma = ta.sma(rsi, 5)
rsi_up = rsi > rsi_sma
rsi_down = rsi < rsi_sma
// === Волатильность ===
volatility = math.abs(close - close ) / close * 100
volatility_trigger = volatility > 3
// === Объёмы ===
volume_sma = ta.sma(volume, 20)
volume_up = volume > volume_sma
// === Условие пампа ===
pump_condition = rsi > 45 and rsi_up and volatility_trigger and volume_up
// === Условие отката ===
dump_condition = rsi < 40 and rsi_down and volatility_trigger and volume_up
// === Фон ===
bgcolor(pump_condition ? color.new(color.green, 85) : na)
bgcolor(dump_condition ? color.new(color.red, 85) : na)
// === Метки ===
plotshape(pump_condition, title="🚀 PUMP Signal", location=location.belowbar, color=color.green, style=shape.labelup, text="🚀")
plotshape(dump_condition, title="⚠️ DUMP Signal", location=location.abovebar, color=color.red, style=shape.labeldown, text="⚠️")
// === Алерты ===
alertcondition(pump_condition, title="🚀 NEIROCTO: Возможен памп!", message="🚀 RSI ↑, Волатильность >3%, Объёмы высокие — возможен памп!")
alertcondition(dump_condition, title="⚠️ NEIROCTO: Возможен откат!", message="⚠️ RSI ↓, Волатильность >3%, объёмы растут — возможен откат!")


FINRA Short Volume (Daily)FINRA Short Volume (Daily)
This indicator displays the daily short sale volume reported by FINRA for a specific U.S. stock.
🔍 Key Features:
Pulls official FINRA short volume using FINRA: _SHORT_VOLUME
Updates daily, regardless of chart timeframe
Useful for tracking short-selling activity over time
📈 Use Cases:
Identify spikes in short volume that may precede price volatility
Monitor persistent shorting pressure
Combine with price action or other sentiment indicators for squeeze potential
⚠️ Note: This data only includes short sales reported to FINRA — it may not reflect total market-wide short interest. For broader context, use this with other data sources like short interest as a % of float or borrow rates.

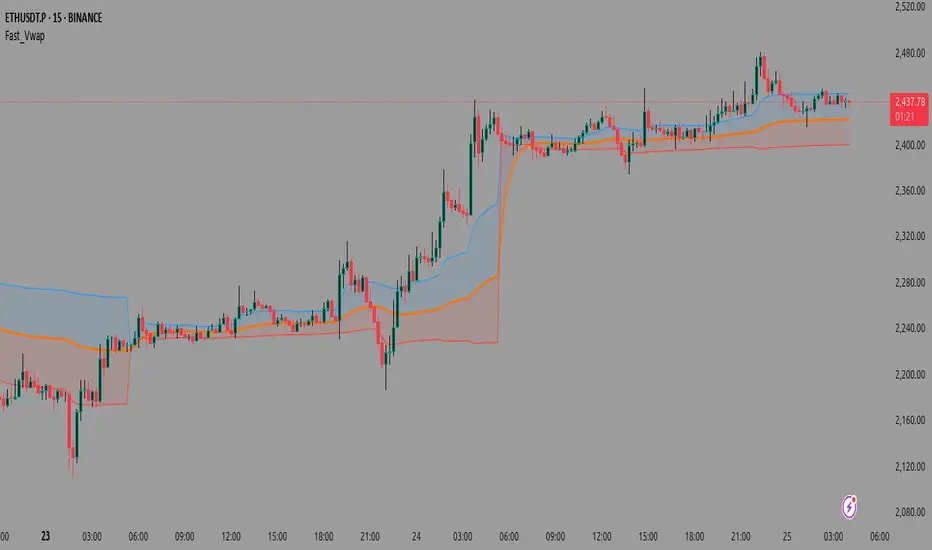
Fast_VwapThis is a Pine Script indicator that calculates and displays Volume Weighted Average Price (VWAP) with several advanced features, including multiple anchoring methods, deviation bands, and optional machine learning enhancements.
Core Components
1. VWAP Calculation
The indicator calculates VWAP using the standard formula:
text
VWAP = Σ(Price × Volume) / Σ(Volume)
Where price can be customized (default is HLC3 - the average of high, low, and close).
2. Anchoring Methods
The indicator offers four ways to reset/start the VWAP calculation:
Session: Resets at the start of each new trading day (most common)
Lowest Low: Resets when a new 10-bar low occurs
Highest High: Resets when a new 10-bar high occurs
Fixed Length: Resets after a specified number of bars (default 20)
3. Deviation Bands
The indicator can show standard deviation bands around the VWAP:
Upper band = VWAP + (Standard Deviation × Multiplier)
Lower band = VWAP - (Standard Deviation × Multiplier)
4. Machine Learning Enhancements
Two optional ML methods can be applied to smooth the VWAP:
Simple Average: Uses an EMA (Exponential Moving Average) of the VWAP
KNN (K-Nearest Neighbors): A simplified implementation that looks at recent values to adjust the current VWAP
How It Works
Inputs: The user can configure all parameters including price source, anchoring method, band settings, and ML options.
Anchoring: The script first determines when to reset the VWAP calculation based on the selected anchoring method.
VWAP Calculation: Using the anchoring points, it calculates the cumulative price×volume and total volume to compute the VWAP and standard deviation bands.
ML Processing: If enabled, the raw VWAP value is smoothed using either a simple EMA or a KNN algorithm that looks at the most similar recent values.
Visualization: The final VWAP line is plotted along with optional deviation bands and colored fills between the bands and VWAP line.
Use Cases
Intraday Trading: When anchored to session, helps identify fair value during the trading day
Swing Trading: When using fixed length or high/low anchoring, can identify support/resistance
Trend Confirmation: Deviation bands help identify overbought/oversold conditions relative to volume-weighted price
The combination of traditional VWAP with machine learning smoothing makes this a unique tool that can potentially reduce noise while maintaining the volume-weighted price information that makes VWAP valuable.
A deviation band is a statistical tool that creates upper and lower boundaries around a central line (in this case, the VWAP) based on how much prices typically vary from that average.
How It Works
Standard Deviation Calculation
The indicator calculates how much prices deviate from the VWAP:
Measures the "spread" or volatility of prices around the VWAP
Uses the mathematical formula for standard deviation
Creates bands at a specific distance from the VWAP line
What Deviation Bands Tell You
Statistical Significance
~68% of price action typically stays within 1 standard deviation
~95% stays within 2 standard deviations
When price touches the bands, it's statistically "unusual"
Trading Signals
Price hits upper band: Potentially overbought, consider selling
Price hits lower band: Potentially oversold, consider buying
Price stays within bands: Normal price action
Price breaks outside bands: Strong momentum move
Dynamic Adjustment
High volatility periods: Bands automatically widen
Low volatility periods: Bands automatically narrow
Volume changes: Affects both VWAP and band calculations
Orange Line (Default)
What it is: The main VWAP line with machine learning enhancement
Purpose: This is the core signal line - the Volume Weighted Average Price that's been processed through your selected ML method (Simple Average, KNN, or None)
Blue Line (Default)
What it is: Upper deviation band
Purpose: Shows potential resistance level - when price reaches this band, it may indicate overbought conditions
Red Line (Default)
What it is: Lower deviation band
Purpose: Shows potential support level - when price reaches this band, it may indicate oversold conditions
DTC_SVVolume is the footprint of smart money.
This indicator helps you track it with surgical precision. DTC_SV is a powerful, all-in-one volume intelligence tool built for traders who rely on volume expansion, institutional candle footprints, and relative strength logic.
Inspired by the Traders Reality framework, this script detects and color-codes vector candles (high-volume momentum candles), provides real-time stats in a clean dashboard, and offers bar-by-bar context for smart money involvement.
🧠 Core Features
📊 Smart Vector Candle Detection
Automatically highlights candles with 1.5x or 2x relative volume.
Dynamic color coding (Green, Red, Blue, Purple) to indicate type and strength.
🟦 Live Volume Histogram with MA
Volume bars show strength and weakness with clarity.
20-period volume moving average line included for trend context.
💬 Volume Labels on Bars
Real-time labels on each vector candle showing absolute volume and % above average.
Helps you see the punch behind every candle.
📈 Advanced Dashboard Panel (Top/Bottom Corner)
Stay data-aware without clutter. The live table shows:
✅ RVOL % – Relative Volume of the current bar.
📈 Daily Trend – Based on position vs 10 & 20 EMA (from daily timeframe).
🔍 Distance to Daily EMA 10/20 – % deviation from mean.
♻️ Avg Recovery of Last 5 Vectors – A key signal for mean reversion plays.
📊 Session RVOL – How current volume stacks up within today’s session.
🧮 Avg Volume of Last 10 Vector Candles – Measures momentum strength.
🔁 Today vs Previous Day Total Volume – Real-time market participation pulse.
🚀 Use Cases
Identify true institutional candles during fake retail moves.
Measure when liquidity is being injected, not just price pushing.
Gauge whether current moves are sustainable or manipulated.
Time your entries using volume spikes + price action confluence.
Track vector candle recovery zones and exhaustion potential.

ATR Buy, Target, Stop + OverlayATR Buy, Target, Stop + Overlay
This tool is to assist traders with precise trade planning using the Average True Range (ATR) as a volatility-based reference.
This script plots buy, target, and stop-loss levels on the chart based on a user-defined buy price and ATR-based multipliers, allowing for objective and adaptive trade management.
*NOTE* In order for the indicator to initiate plotted lines and table values a non-zero number must be entered into the settings.
What It Does:
Buy Price Input: Users enter a manual buy price (e.g., an executed or planned trade entry).
ATR-Based Target and Stop: The script calculates:
Target Price = Buy + (ATR × Target Multiplier)
Stop Price = Buy − (ATR × Stop Multiplier)
Customizable Timeframe: Optionally override the ATR timeframe (e.g., use daily ATR on a 1-hour chart).
Visual Overlay: Lines are drawn directly on the price chart for the Buy, Target, and Stop levels.
Interactive Table: A table is displayed with relevant levels and ATR info.
Customization Options:
Line Settings:
Adjust color, style (solid/dashed/dotted), and width for Buy, Target, and Stop lines.
Choose whether to extend lines rightward only or in both directions.
Table Settings:
Choose position (top/bottom, left/right).
Toggle individual rows for Buy, Target, Stop, ATR Timeframe, and ATR Value.
Customize text color and background transparency.
How to Use It for Trading:
Plan Your Trade: Enter your intended buy price when planning a trade.
Assess Risk/Reward: The script immediately visualizes the potential stop-loss and target level, helping assess R:R ratios.
Adapt to Volatility: Use ATR-based levels to scale stop and target dynamically depending on current market volatility.
Higher Timeframe ATR: Select a different timeframe for the ATR calculation to smooth noise on lower timeframe charts.
On-the-Chart Reference: Visually track trade zones directly on the price chart—ideal for live trading or strategy backtesting.
Ideal For:
Swing traders and intraday traders
Risk management and trade planning
Traders using ATR-based exits or scaling
Visualizing asymmetric risk/reward setups
How I Use This:
After entering a trade, adding an entry price will plot desired ATR target and stop level for visualization.
Adjusting ATR multiplier values assists in evaluating and planning trades.
Visualization assists in comparing ATR multiples to recent support and resistance levels.
