HOW TO FIND CHEAP ENTRY SIGNAL FOR RISKRETURN LIKE 1:10 AND MOREHI BIG PLAYERS,
in this tutorial I want educate you my experience, how to find really cheap entry for trading.
In this example it was possible to take part on a 1:10 trade. It means for 1 USD investment you could take 10 USD return (Risk-Return-Ratio => RRR).
/////////////////////////////////////////////////////
E X A M P L E F O R A B U L L I S H T R E N D
/////////////////////////////////////////////////////
At the beginning we are looking for an oscillator, that shows us an oversold area and in the same time a bullish trend with higher and faster EMA than a slower EMA on the chart. This is possible with a slow EMA(close, 200) and a fast EMA(close, 50) and a RSI(close, 14).... => this is for example my way to find it on the Forex Screener from TradingView at fast as possible.
I developed a similar structure with more quality signals with my candle oscillator indicator. Named: CO 'I.
This indicator allows to see the candle between a range und works at well like the RSI oscillator with 30% and 70% oversold and overbought area. The most positive on this indicator, you don't only see the closing relating price - you see almost more: open, high and low.
Furthermore, I found out that if the body of a candle goes into the range between 30-70% and this is the same trenddirection in the chart, then it was to 90% the lowest/highest bar or 3+ bars nearby them.
So back to my education:
My main view starts on 4H Chart. In this example I found on EUR/JPY a bullish trendfilter with the EMA's and a oversold area on my OC 'I (the wick of the candle was touching the 30% line) - it's only necessary that a touching of the candle is true.
NEXT STEP:
After this bullish signal it is necessary to zoom in the lower timeframe. Here I choosed the 1H Chart and had to wait till the body of the OC 'I also touched the 30% line and of course wait till the candle is finished. It don't depend how much the body touch the 30% line - but it's necessary that the body is touching. In addition, a bullish divergence was built (looking to blue lines).
After the first touching I go into a lower timeframe again. The 15H-Chart was choosed for this example. Hereby the same game: waiting till the body is touching the 30% line.
NOTE: furthermore, if I going into the lower timeframe and the body is already touching - then you don't need to wait for the relase into the range and back to touching again the 30% line.
The 15MIN Chart is the last timeframe. Now we wait till the body goes up and don't touch any line. This is my signal to buy. My exit depends always how the market flow are: in this case it was a big uptrend and a adapting correction wave (this is mostly the time for divergence and this why I set a takeprofit on this high).
With this approuch it was possible to catch a 1:10 trade.
Kind regards
NXT2017
Moving Averages

LevelsHello fellas, Happy Saturday and I hope this can be a nice weekend for all of you. Today's update is always about bitcoin and this will always be a significant update as the analysis for the next 7 days ahead. I hope this analysis still can give us a nice horoscope for the next few days, just like what I've always did! So, Enjoy!
Looking at the daily perspective of the bitcoin's price, we can see that the down trend channel that has held the price since June 26th, 2019 as the initial corrective phase of bitcoin is remain valid and still hold true. At November 25th, we can see the price bounced right after it touched the lower line of the channel which act as a strong support so far.
Right now, the price has came close to the median line of the channel which is acting as a strong support too. we might see an action at this region whether it is going to break it out or getting rejected from it. If we see a break out action, we might see the price to reach out $8800 as the shadow support before it pushes further to the upper line of the channel as the next strong resistance ahead. But, if the price get rejected at the yellow zone, we might see the price to push further low to $6600 or even $5500 region.
It's just a matter of time, we might see the price to push further to the lower region of $5500 as it's almost impossible for bitcoin to breaks the upper line of the channel which is huge for now. with current condition, A lot of uncertainty in the market, Huge adoption this year, But low levels of confidence? It is certainly the longer recession is coming.

XAUUSD Fibonacci Level and Support Resistance LevelConfluence with 1478.85 Horizontal Support Resistance Level and 50% Horizontal Fibonacci Level (1478.87)

XAUUSD 5.2 R-Multiple XAUUSD Pennant Pattern. Second Entry at 1478.85 horizontal level. Risk 3.86 to achieve 20.07 Reward for a 5.2R trade outcome.

EURSEK 2.93 R-MultipleEURSEK Reward:Risk = 2.93R
Stop Loss: 286.6 Pips
Target: 838.5 Pips
Entry at price level: 10.64975
Note: Price Level 10.64975 was retested and EURSEK continued into its intended direction.
Note: Price Level 10.60763 was broken and retested. Entry comes in at the retest of level 10.60763. Target is the next horizontal support resistance level at price 10.56657.

MACDBTCUSDDBuy the code and trading idea details behind this strategy at coinbook.com.
We build custom trading bots. Please reach out to implement this idea at support@coinbook.zendesk.com

MACDETHBTCDBuy the code and trading idea details behind this strategy at coinbook.com.
We build custom trading bots. Please reach out to implement this idea at support@coinbook.zendesk.com

MACDBATBTCDBuy the code and trading idea details behind this strategy at coinbook.com.
We build custom trading bots. Please reach out to implement this idea at support@coinbook.zendesk.com

MACDBTCUSD4Buy the code and trading idea details behind this strategy at coinbook.com.
We will backtest your trading idea for free: coinbook.com
We build custom trading bots. Please reach out to implement this idea at support@coinbook.zendesk.com.

MACDBTCUSD1Buy the code and trading idea details behind this strategy at coinbook.com
We will backtest your trading idea for free: coinbook.com
We build custom trading bots. Please reach out to implement this idea at support@coinbook.zendesk.com.

MACDBTCUSD15Buy the code and trading idea details behind this strategy at coinbook.com
We will backtest your trading idea for free: coinbook.com
We build custom trading bots. Please reach out to implement this idea at support@coinbook.zendesk.com.

14Buy the code and trading idea details behind this strategy at coinbook.com
We will backtest your trading idea for free: coinbook.com
We build custom trading bots. Please reach out to implement this idea at support@coinbook.zendesk.com.

13Buy the code and trading idea details behind this strategy at coinbook.com
We will backtest your trading idea for free: coinbook.com
We build custom trading bots. Please reach out to implement this idea at support@coinbook.zendesk.com.

12Buy the code and trading idea details behind this strategy at coinbook.com
We will backtest your trading idea for free: coinbook.com
We build custom trading bots. Please reach out to implement this idea at support@coinbook.zendesk.com.

11Buy the code and trading idea details behind this strategy at coinbook.com
We will backtest your trading idea for free: coinbook.com
We build custom trading bots. Please reach out to implement this idea at support@coinbook.zendesk.com.

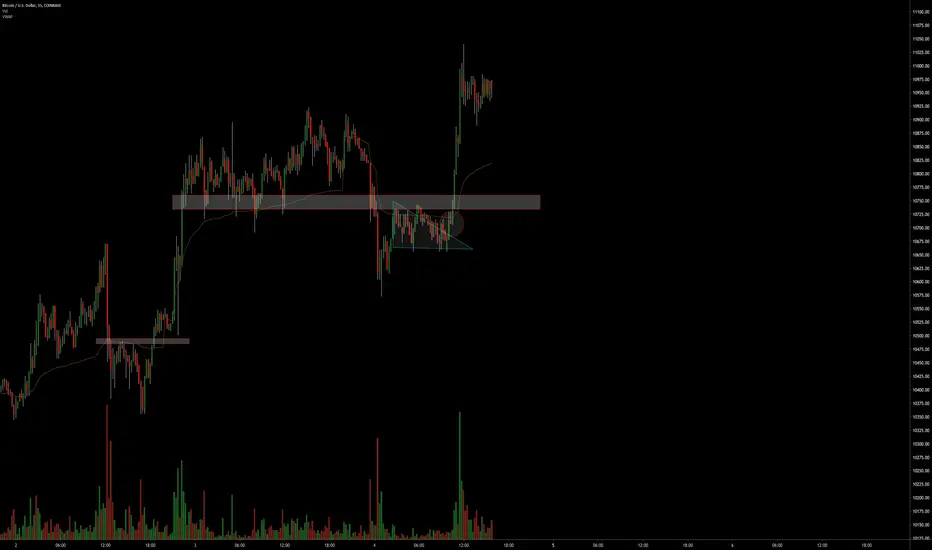
"bullsih pennant" in re-accumulation (reference)Background on higher time frame was bullish/uptrend.
Characteristics/points of confluence:
established up trending background
50% retracements with high volume price rejection
signs of strength/ buying into the sell pressure on high volume
Break below support (red box in this example)
low volume Test of resistance (in this example previous support and VWAP) returns low sell pressure
No-supply test at VWAP (circled)
Maybe termed a "fall through the ice" in the Wyckoff methodology.
Fairly textbook accumulation schematic with a bullish pennant in the area of the LPS/TSO.
Volume is key.
Training*
“Patience is key to success not speed. Time is a cunning speculators best friend if he uses it right”
Jesse Livermore
Sources of education:
Tom Williams Volume spread analysis VSA/ Master the Markets
Richard Wyckoff
Pete Faders VSA*
Read the ticker dot com
Dee Nixon
BTC trading challenge price action/volume techniques
Good luck
Golden pocket and MACD golden crossover?Hello all, welcome back to the Sunday market update! Beside the sideways moves during the movement of last week, here it comes again the interesting in the crypto market. Patience is the key before you jump in the market for now. Let's do this technical analysis about bitcoin.
Like what I've shared on the previous analysis of the bitcoin, $8500 is moving align with the golden pocket zone and the $8000 is moving align with the .786 fib levels and both levels obviously are a major support that must be respected so far. The $8000 is a huge psychological zone for bitcoin, Huge price action activity has occured in this level which is great!
Knowing that current price is moving just near the golden pocket zone as a great support, we must realize that the moving average line on MACD is having a big probability to do a golden crossover on 4 hours chart. The RSI has shown us a bullish divergence with lower low on price action but higher low on RSI. This is a perfect set up for long opportunity.
I will open a long position if the price claims back the $8700 as the shadow support respected and of course when the golden crossover occur on the MACD dynamic line. Patience is the key, waiting will keep you on the track.

An Exponential Moving Average cross over + CHOP strategyA simple ema cross over strategy (7/25) and choppiness index to buy on the 4hr timeframe.
if ema 7 is above ema25 AND candle before was below AND CHOP < 45 AND volume > 10 units AND candle open > 130 units (units will be in your base pair) then BUY
if ema 7 is below ema25 AND candle before was above OR Profit = 15% OR Profit = -10 then SELL

APEX and RippleHello fellas, Here it is I represent to you my view about Ripple.
Based on the technical analysis, I found an important pattern which forms a descending type of the triangle. But, once again I remind you that even the descending triangle which usually indicate a bearish pressure, it has a potential to make it a failure too. However, I only see that currently the price for ripple has already trended in the APEX of this huge triangle on weekly chart. These are the 2 scenarios :
1. Break out of the resistance trend line : will lead the price to $0.47 or even $0.87 in mid term
2. Break down of the support line : will lead the price to form new low in 2019 around $0.14
Thank you

Manipulation, Death Cross and Xi Jinping's statementHello fellas, welcome back to our Saturday update about bitcoin. Let's get to the point
We have seen a 40% surge on bitcoin in 1 day of trading. However, even in crypto industry, this is still a tremendous moves so far and unfortunately, once again it indicates that the crypto market is showing its unstable circumstance which can easily manipulated. Just right before the 40% surge, the China president, Xi Jinping shared his view about bitcoin and announce a support on blockchain in China. However, this gives a tremendous effect on crypto market. Altcoin's market lose a lot of volume but on the other hand, money inflow in bitcoin is growing even faster.
I believe that it is only the manipulation that some parties made to wipe out the people who short the market. I do expect a little pullback to the upside but I never thought that it was this tremendous. I am a type of the people who don't believe in fundamental analysis, I am 100% technical believer. All the short term spike is just manipulative as always. Now, look at the higher time frame of daily chart.
After the 40% surge to the upside, today's candle produce the 12% wick of rejection and is still moving below the white resistance region. this white resistance region was the broken support that is now become resistance as well. And the white trend line is the resistance trend line that has held the price since june 26th, 2019. As long as the price is still moving below this trend line, I will still remain bearish as well.
Another view on another technical indicator, which is EMA 55 and MA 200, we can easily deduce the death cross has already occured. However, death cross is always be the most respected factor to look for most of swing traders. I am expecting a daily candle closure will be below the EMA 55 which is the blue dynamic line to confirm this continuation of down trend.

200 SMA end of the month strategy This is a strategy that only buys and sell once a month depending of BTC price. If btc price is above 200 SMA AT the end of the month on the daily then buy, else sell

[AU] Mnemosyne v04 Mnemosyne v04
Fibonacci oscillator with Lead-Follower-Base design and optional dynamic Caution Zones.
Adjustable lengths and new defaults for Lead, Follower 1/2, Base
12 Smoothing options available: "SMA", "HMA (Hull)", "EHMA (Exponential Hull)", "EMA", "RMA", "WMA", "DWMA (Double Weighted MA)", "Ahrens MA", "ZLEMA (Zero-Lag Exponential MA)", "LSMA (Least Squares MA)", "JMA (Jurik MA)", "T3 (Tilson MA)"
Shown here from top to bottom: Mnemosyne with SMA, Hull, JMA, LSMA. Each line has an adjustable length and configurable smoothing options available.

normalization/range clamp for cbci testExample chart testing artificial range clamping for the Constance Brown Composite Index (CBCI), which was deliberately designed to not be range bound to address some of the limitations and shortcomings of the RSI formula.
Here, an artificial value clamp/range bound 0-100 is reintroduced in the name of science, to see what would happen to key crossovers on a momentum-enabled indicator with no defined "floor" or "ceiling".
In short, I'm a huge fan of the CBCI - this isn't the first, and most certainly won't be the last time I explore modifications to the composite index and RSI.
