The importance of admitting you were wrong. I was wrong. Sorry.Hello.
I have changed my background, I realized the full white one just blasts the human eye. Better go for something more easy on the eyes.
I have to make a 180° on my previous bear position. In the trading & investing world, it is important to realize you were wrong and stay humble.
If you don't, that's when you end up destroying your account. From what I saw I believed it very likely we drop all the way to 3500 before going to a bull market.
I don't know if I said this exactly, but I at least might have led people to believe this.
I was wrong. This is not likely. I zoomed out and saw what was happening around me, and I now strongly believe I was wrong.
I am a bear no more. Believing we are going to reproduce 2014 crash and bounce on whatever trendline because it "looks similar" is stupid (I already posted an idea about this).
I have now turned to an Orca. You know, the second biggest predator on the planet, and the most cruel animal on the planet, they love to torture their prey for hours before eating it.
It's over. Bubble is about to pop.
I will first show the graph for the short term. I guess that's what we're going to do, but that doesn't matter, I will next show what will happen long term.
And it is not pretty. There's going to be blood in the streets and I'm not speaking metaphorically.
A death cross will happen tonight, unless the bulls can push the price to 17000$. There's probably some of them that think it's possible.
I also forgot to show the weekly MA 10, yet another resistance in the area. We are still following the usual bubble pattern and it's looking like 2014, I just think this time it will be worse. I'll explain later. There's so much data I don't know if I can throw it out all at once.
I wanted to say, at my workplace there's this programmer guy, midly shy guy, just your average programmer I guess, back in early december when I started working closer to him he was pretty euphoric alwyas smiling laughing and extroverted I was wondering why he liked me so much gay or something?
Well he started isolating himself 2 months ago "to focus on work" and complaining more and more and working long hours, and now, haven't seen him for 3 weeks he's having "medical" issues. After the double top to 11k when we went down he started being isolated and below 9k that's when he just vanished.
I guess he's one of the victims. I hope for his health we crash soon? I guess? So he can sell, lose his money maybe, but at least he's free.
Or maybe he sold and then bought back in on the "back to normal".
In a while, we will get the suicide stories, the divorces and homeless people, there will be a ton of them.
People are extremely stupid. The more something goes up, the more idiots put everything they have in and get lucky, the more the next people will put in.
There has already been suicides.
But it will get worse. Much, much worse. South Korea is going to be a bloodbath. Their "millenial" population was already deep in shit, but boy oh boy it's going to get worse.
They thought crypto was the miracle magical thing that will give every one free magical money. It will end up being hell. Their doom.
I'm betting on hundred of suicides at the VERY LEAST.
ONE thing can save the bagholders now. A very evil person or group with alot of money that pumps crypto (not even sure it'll work out) to scam at a higher price, more people. It would end even more badly... But if they get caught what would happen to them would be worse than Mussolini Ghadaffi or 'Abd al-Ilah from Iraq.
Let's zoom out and see where we are now:
We have visited the long term investor average buy price twice, just like in 2014, and they have supported Bitcoin. The second time, we dug deep and found very strong support, bounced 100% to a double top (again).
I will continue in an update.
Moving Averages

How to spot bear market. Live example.Pretty simple.
1- When we lose the important moving average's, it's an indication a bear market is possible, but by itself does not confirm the start of a bear market at all.
2- When the MA50 starts going downwards... you can start betting we're in bear market.
3- When we lost the MA100 and it starts pointing down, bear market is confirmed, but by then we already dropped alot thought.
4- Usually the faster the climb up is, the longer the bear market lasts. The more time we are in bull market, the more violent and quick the drop. Compare 2014 2017 perfect example.
5- Everything comes in wave of 3. 1rst time people don't notice, 2nd time don't really believe, 3rd time everyone with simple minds are thinking "last 2 times they said it wasn't going up/down, last 2 times it did this it keeps repeating itself, clearly I can buy/sell/join that sect/vote for that NAZI that knows how to manipulate minds. Etc. Always.
*- Several factors and indicators have to point out to the same thing. It still needs an educated human eye (or hella good AI?!).
Why anyone can't just use this blindy? Take this for example:
But... I mean... to me it's obvious... we're not about to start a bear market when we just got out of one & people sold hard and there hasn't been any buying yet...Makes no sense.. But yeah every one doesn't see this I guess.
But anyway, this is obviously not for finding signals, just getting an idea of the general trend and putting the odds in your favor.
And you can use the MA's as support/resistance to long or short. when several resistances or support are at the same area it's bonus triple kill!
The moving averages, especially higher numbers) are mostly viewed I believe by these wonderful people, the investors "in it for the long term", these wonderful people give us money everytime we hit one of their support or resistance.
www.youtube.com
This drawing (+ my evil plan ofc) gave me the idea to post this:

Ichimoku Cloud 101 (Signals and analysis)See Notes on chart. Thanks to the resources used to create this - also listed on the chart.

BTC-USD Review of Past Year's Price Deviation from 200 SMAReviewing the past 5 major BTC price corrections it is interesting to note that the crash occurred consistently when the price deviated about 60% from the 200 SMA.
The crash in Mid December happened when the price was a staggering 75% above 200 SMA. Even when it recovered there was still a 34% divergence. When this started to climb again above 50% divergence this should have range warning bells.
The current crash looks to have found its bottom with it back at a 23% divergence from the 200 SMA. Longs should be able to be placed confidently with new All Time Highs expected before next correction.
Lessons
- Current crash seems to have bottomed
- Look out for the price deviation from 200 SMA. Ensure you are not in significant long positions when it deviates above 50% of the 200 SMA.

For next time: how to spot the reversal, making money as a bear.Fib extensions.
Draw a high from the previous high to the bottom of it's real correction (4h retraces to the 20MA, in BTCUSD's case, work.)
Now, extend to the current peak.
Is it failing to retest the 0.236? Get out, prepare a to buy at the 0.618 if it holds.
0.618 holds? buy but prepare to sell at 0.382.
0.618 fails? try at 1.0
Buy at 1.0 but prepare to sell at 0.618.
0.618 is now resistance?
Congratulations, you have a bearish reversal.
Feel free to keep playing this game of buying and selling at fib levels and moving averages: if it will drop to 1.618, sell again at 1. Drop to 2.618, sell at 2.0, drop to 3.618, sell at .. well, 2.0 again if it will reach it. otherwise 2.618
If there's signs of a reversal, you can draw a new fib retracement from the top to the newly minted bottom and repeat the same game up the stairs
What i'm trying to say is..
Bitcoin isn't done dropping, but that doenst mean there arent any opportunities.

day trading BTC: managing the dip and return cycleBoth dipping and recovering price cycles represent good buy-ion points for BTC day trades. There are a multitude of good buy ins given the above indicators and bollinger band overlay (200 day SMA).
When price is falling, the lower standard deviation of the bollinger bands are helpful in establishing buy in points. When price is collapsing initially after a high, this is the scariest buy in. However, you can see how EMA 34 and SMA 50 are both far below SMA 200, and exhibiting room for collapse.
Once a significant BB low takes place, scraping the lower BB for the last time, there is an opportunity to buy in, with expectation of a set of improving buy-sell cycles. There will be several before the final, parabolic jump of the day, justifying your attendance in the market.
I see several very healthy gains, buying these hits along the lower bollinger band, which may surpass the parabolic gain, taking place in the final jump.
My contribution is the cup-like trend, traveling the lower range of the bollinger distribution, scraping lower standard deviation points. But the recovering price-pump at the right (4.4%+) is signed by rising prices versus the lower bollinger band, and a combination EMA 34 and MA 50 surging closer to SMA 200.
This document is for information and illustrative purposes only. It is not, and should not be regarded as “investment advice” or as a “recommendation” regarding a course of action, including without limitation as those terms are used in any applicable law or regulation

Wanna make money? Stay home from school tomorrowIn grade school a rough/tough bully threatened me to 'stay home from school tomorrow.' I came to school anyway, with a Swiss Army knife in my pocket, ready to rumble. I am sure the corkscrew would have been a wonderful piece of tactical gear.
Stay home from school tomorrow. It's gonna dump.
That is, unless you like to buy dips. Dips upon dips, upon dips.
It's gonna be scary. A good day to ride motorcycles and play with the dog.
On the 11th, get up at 6 am. It will be Christmas.
That is, unless our buds in CHI/NYC want to hold the price down. But that might scare away everybody except the boys from CHI/NYC, and where would they be without us?
This document is for information and illustrative purposes only. It is not, and should not be regarded as “investment advice” or as a “recommendation” regarding a course of action, including without limitation as those terms are used in any applicable law or regulation

USDJPY BREAKDOWNusing lower time frames to really identify why prices move the way they do. hope this helps someone

Example of an Exponential Moving Average (EMA)The exponential moving average may indicate an uptrend or a downtrend. It is a trend indicator.
A bullish signal is generated when prices move above the EMA, so make a long. A bearish signal is generated when prices move below the EMA, make a short.
The EMA works very well in long trends, however, does not work well in lateral movements or short periods and in those cases EMA gives false signals.

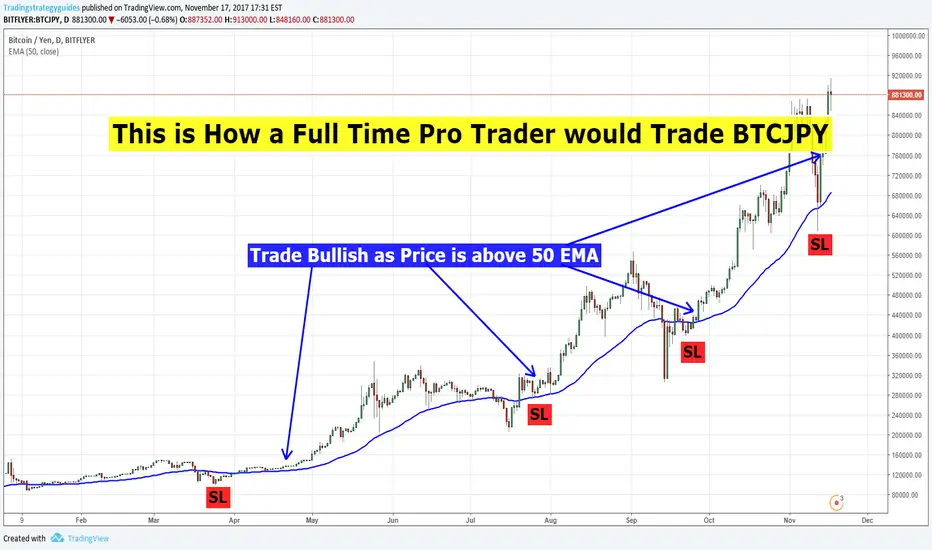
This is How a Full Time Pro Trader makes PROFIT!As long as price stays above the 50 ema there is a bullish trend. Pull backs to the 50 ema are entry points. Tight SL under 50 ema. How would you make re-entry trades on this bullish trend for the BTCJPY. Leave a comment below about your trade idea.
Micro-caps stocks candidatesToday I am going to introduce a special search called "Ballistic New Highs" if you have GUTS to play micro-cap.
This search finds all stocks hitting a new 52 week price high in ASX. The stocks are sorted by Closing Price divided by Stop Price. The stocks that are at the top of the list have a closing price well above the Stop Price.
To consider a bottom entry, I'd consider the stocks prices below $0.10.
On 7-Nov-2017, the stocks listed as below:
KFE> RT= 1.40 Materials (Dvrsfd Metals/Mng)
WBT> RT= 1.40 InfoTech (Semiconductors&Equip)
POS> RT= 1.41 Materials (Dvrsfd Metals/Mng)
RLC> RT= 1.38 Materials (Dvrsfd Metals/Mng)
CLL> RT= 1.41 Materials (Dvrsfd Metals/Mng)
As there are 4 out of 5 stocks are categorized at Materials, therefore I use ASX 200-Materials index for a market trend comparison.
We have a Market Timing Confirmed Up signal on 9-Oct. Most of the stocks here skyrocketed to new highs.

Heikin-Ashi Monthly Trend StrategyTrade current Heikin-Ashi monthly trend long or short/bonds/cash
Reverse trade with a decisive break of the 7 period Moving Average at close of monthly candle
Decisive means non-Doji candle with body 50% or more above/below the 7MA
Doji or indecisive break of 7MA may just be consolidation, stay with current trend

GBPUSD 30 m Trading the 800 SMAHere is a story about the 800 SMA. When you begin your trading session look at each pair you are going to be trading on the 4 H chart. See if any pairs are stuck on the 800 sma. They probably won't move far for 25 bars. Avoid. What ever short time frame you trade from and what ever pairs you trade, make a list of pairs that have been away from the 800 sma for 24 hours or more. Also add to the list any pairs that have been stuck around the 800 sma for 25 BARS and are ready to break away. This helps find what pairs you want to focus on during the day with the rest of your trading strategy.
On my chart you will see price come down to the 800 sma 3 different times. If price hesitates by the 800 for several bars then it may get stuck there for 25 bars. If price bounces away from the 800 sma when it comes down to it then price is still in motion and can set up some trading opportunities for your strategies.
We have many different strategies to learn on our blog and we are constantly coming out with new strategies for traders to learn every week. Visit us below on the website, Twitter or Facebook.
We have a new professional breakout trading strategy posted on our website using the VWMA. Check it out.
Watch for our new “Five Candle Mastery Trading Strategy”.

Big 3 Trading Strategy USDCAD 15 m ShortThis is my favorite strategy. You will find a trade using this strategy any time any where. Watch upcoming news but for the opening of the US, Asian and London session this strategy is a sure fire "rob the stage" of the markets. Be patient, let the 2nd rule develop with a candle outside of the ma's. A pull back will naturally happen as the market moves. Then make sure you have a strong continuation candle pattern to enter. Watch your risk ratio when placing your SL. This strategy will work on any market and any time frame. Let your trade run using the TP when price hits the 80 sma or have a fixed pip TP to "close the bag and run to the bank"! I like 30 pips because that is close to how much the market moves before it pulls back normally.

Tip 10: Slow Decline Will AccelerateTip 10: Slow decline will accelerate, don’t copy the bottom and wait for slump
Tip 10 needs to meet three conditions as follows:
1. The price declines along the MA5 and MA10;
2. The rate of fall is not sharp, but new lows are created continuously;
3. The price will accelerate and deviate from the MA.
Usually, the price slides slowly, and correction is small bullish candles, then rise again along the MA5(attack line) and MA10(defense line). If the market move as this, don’t guess where is the bottom, just sell at correction. When the market accelerates as several large candles with long wick and price is far away from MA5, the phased bottom is likely to form.
This is more effective in big time frame.

Tip 9: Slow Rise Will AccelerateTip 9: Slow rise will accelerate, don’t copy the top and wait for bound
Tip 9 needs to meet three conditions as follows:
1. The price increases slowly along the MA5 and MA10;
2. The rate of rise is not sharp, but new highs are created constantly;
3. The price will accelerate and deviate from the MA5.
Usually, the price increases slowly, and correction is small bearish candles, then rise again along the MA5(attack line) and MA10(defense line).If the market moves as this, don’t guess where is the top, just buy at the correction. When the market accelerate as several large candles with long wick and the price is far away from MA5, then the stage top is likely to form.This is more effective in big time frame.

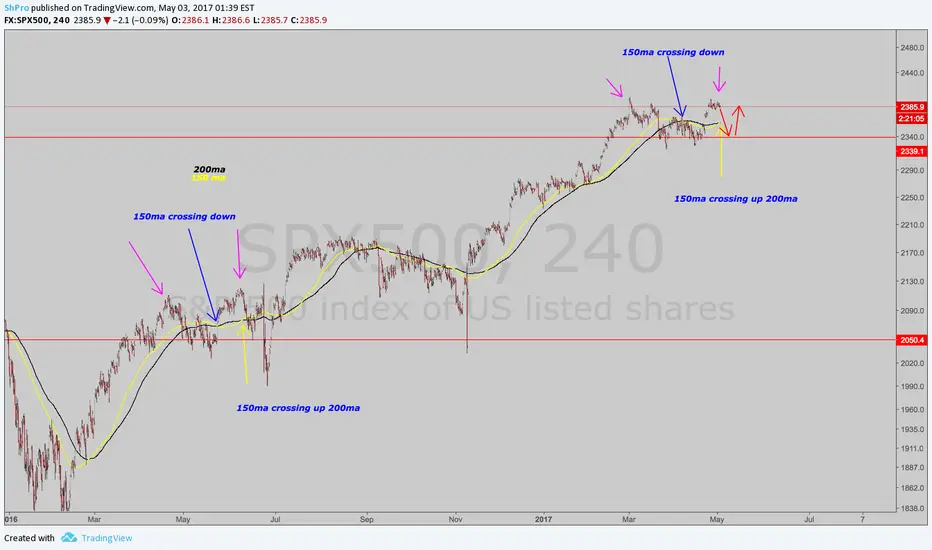
Using 150 and 200 simple moving averages www.tradingview.com
Using 150 and 200 simple moving averages produces interesting results. When 150ma goes under 200ma it usually produces a price increase. However, since 150ma is shorter period, and all moving averages want to find their right place, it will go back up where it belongs, above 200ma. This also produces another interesting result, which is price decrease. This price drop however is usually followed by a sharp price increase as can be observed in SPX.
Moving Average - Educational StudyHi guys, I would like to present to you this educational trading method that was adopted by Rayner Teo-1.72% . ( search him up , he is a great trader and mentor )
Basically the moving averages act as a support and resistance levels and can indicate an ongoing trend , you can use them to time your entries and ride the trend.
Keep your SL trailed alongside with the trend.
You can keep adding positions every time the price hits the EMA's and shows that it respects them as a valid support/resistance area!
You collect your profit only when you think the trend has ended and and it's time to close the trades.
Update status

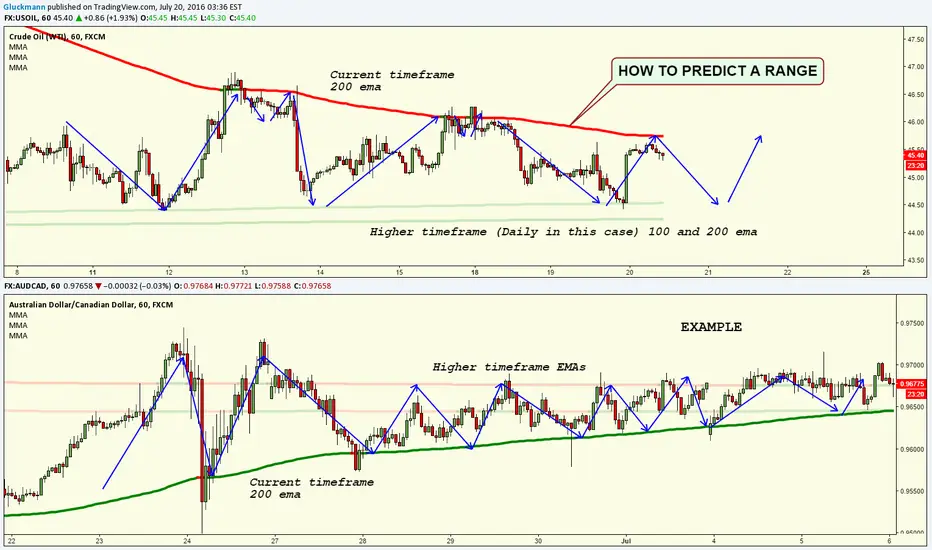
A tip on how to predict rangesWhen price gets trapped between current timeframe and higher timeframe EMAs expect ranging price action.
EURUSD - Daily Chart very simple "trend following strategy". . This is a very simple, yet very effective trend following strategy.
1. Display price using Heiken Ashi candlestick. (Removes a lot of the noise and allows to see smoother movement).
2. Trading daily charts allows less whipsaw movement and much cleaner entry/exits.
3. Confirm if trend is UP, DOWN or SIDEWAYS.
Entry Signal is:
1. Medium to Large HA candle changes from Green to Red, or vice versa shooting up/dn through the 8-WMA & 14-MA.
2. The candle MUST breech both moving average lines to validate entry long or short.
3. Enter trade Long/Short on close of that candle.
4. RSI 90% of time will be in Overbought or Oversold area when candle breech trigger occurs. (further validating entry)
5. Typically the large HA candle that breeches the two moving average lines will NOT have a wick below it.
* Avoid entering during times of consolidation, characterized by mix of red/green HA candles with wicks on both sides.
* Look for entries after touch of support or resistance areas.
* Trade becomes invalid AFTER ENTRY if at any time a candlestick changes color and shoots up or down in the
opposite direction crossing BOTH of the 8/14 moving average lines.
