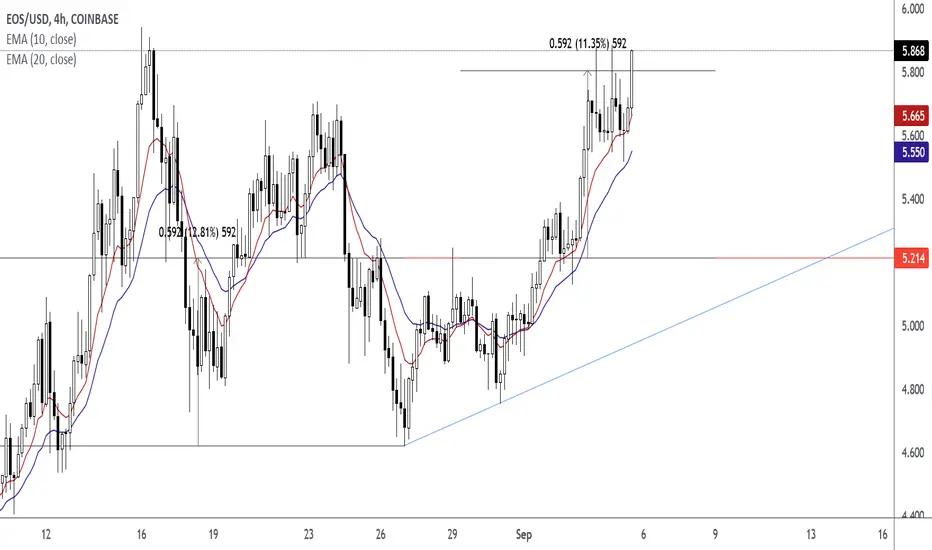
How To Trade The Ascending Triangle Trading The Ascending Triangle
Wait For The Close Above The Horizontal Level
Wait For The Retest in the form of a pin bar or rejection candlestick.
Enter At The Close Price of Pin Bar or Rejection Candlestick
Exit At The Measured Objective of Pattern. The Height of Pattern is 592.
Moving Averages
ETHUSDTLook at Black Lines on My Chart...
They are Support & Resistance for Moving Average thats Mean when MA Cross Above or Below this Lines,Price starting to Reaction...
Check when Moving Average in Daily & Weekly Time Frames Reach the Black Lines on the Chart and Watch the Price ...

The Breakthrough StrategyGreetings, traders! Welcome to this short, 7-step strategy lesson.
Are you new to trading? Don't worry: we're dedicated toward providing the most high-quality, easy-to-understand, and straight-to-the-point investing education to the TradingView community. This strategy lesson is beginner-friendly (we have pictures!), as we've inserted helpful links into each and every term, just in case you don't know them yet. Anyways, let's get right into the steps of this effective trading method , which we've named " The Breakthrough Strategy ":
• STEP 1, The Breakthrough:
Identify a breakout (or "breakthrough") at the most recent Support/Resistance (S&R) zone. With the horizontal line tool, if you haven't already, mark the level at which price broke: this will be your potential Entry Point (EP).
• STEP 2, The Turnaround:
Immediately following the breakout, you'll wanna see two or more consecutive candlesticks, going in the same direction of the breakout. After the streak, when you spot the first completely-formed candle, going in the opposite direction, you've found your "turnaround" point! Mark it up with a S&R line: this will be your potential Take Profit (TP) level.
• STEP 3, The Other Side:
Now, identify the most recent S&R zone, on the opposite side of the breakout zone: this will be your potential Stop Loss (SL) level.
• STEP 4, The Average:
Make sure that you have your Exponential Moving Average (EMA, 50) installed on TradingView. Is the end of it between the EP and the SL? Perfect! You're ready for the next step.
• STEP 5, The Order:
Place a Limit Order (TP, SL, and EP levels are mentioned in the previous steps). If, before price hits the Entry Point, things start to get choppy, close the pending order: it is now invalid.
• STEP 6, The Execution:
Did price hit your Entry Point? The order has been triggered —we're in! Good job, good luck, and hope for some profits.
• STEP 7, The Final Step:
"Practice makes perfect," so make sure that you backtest this method, to test it out before using it on the live market. Be sure to follow us, for future lessons which will help you significantly increase the power of this strategy!
We hoped that this helped you! We ask that you pay it forward, and share this lesson with a friend, a fellow trader, or... heck... share it with your grandmother.
“My mission is to help you see forex for what it is: it’s not ‘rocket science,’ but a simple strategy game. Get on the ‘good side’ of probability, develop the proper mindset, and you will prosper.”
— Nio Pomilia, Forex Free Press

Support and resistance trading Wipro was bouncing between a strong support and resistance. After the breakout bought at the pull back .
Huge moment after the pull back .

How To Trade Quality Pin BarsAfter the Pin Bar Formed At The EMA 10 EMA 20, Do The Following Actions
Draw Your Fibonacci Retracement Levels
Draw Horizontal Support Levels
Enter At Pin Bar Close Price
Exit At The Previous Swing Low Level
The attributes that made this a quality Pin Bar:
Pin Bar Close Price is in the Fibonacci Retracement 50% and 38.2% Range Area
Pin Bar Close Price is in the EMA 10 EMA 20 Range Area
Pin Bar at Lower High
Downtrend
Technical Chart Of How To Trade The Pin Bar. Before and After Charts. Click on Charts.

How To Trade The Pin Bar With Support Resistance Levels 08-16-21This pin bar is in a pull back. The horizontal level was broken and the horizontal level was retested with a pin bar candlestick. In this case, the pin bar tail intersects the EMA 10 and horizontal support level. Price closed above the horizontal level. Entry for this strategy is at the pin bar close. The Target is the previous swing high.
The MACD explained ! All you need to know about it Hello everyone, as we all know the market action discounts everything :)
_________________________________Make sure to Like and Follow if you like the idea_________________________________
In this video, I am gonna explain what is the MACD and how to use it and how to identify buy and sell signals using this indicator.
So what is the MACD, The MACD is a trend-following momentum indicator (so a momentum indicator is a technical analysis tool that allows us to determine the strength or weakness of a stock's price movement )
There are a lot of people that use the MACD when they analyze charts because it's very simple and it's very good but I always say never just use 1 indicator to analyze a chart, always try to use at least 3 this way u can make sure that the result is more accurate and the market most likely to move as u analyzed.
let's look at the theory behind the MACD before looking at a real-life example and how to identify buy and sell signals using this indicator :
The typical settings for the MACD are 12 26 and 9.
The MACD consist of 4 parts :
1) Zero line
2) MACD line
3) Signal line
4) Histogram
We start off with our zero line and this is where the MACD line and the signal line move around and basically so if the MACD is trading above the 0 line then it's bullish and if it's under then it's bearish.
Then we have the MACD line and it comes from the 12 26 section, and it gets calculated by subtracting the 26 EMA of the price out of the 12 day EMA of the price.
And after that we have a second line that gets plotted from the 9 section so basically, it’s a moving average for the MACD line so it tries to smooth the MACD line and give us some signals and it's called the signal line.(it's called a signal line because that's where we get our buy and sell signals from)
So on top of that, we have another part in this indicator which is called the histogram. So this histogram job is to show how close these lines will crossover, so when the distance between the MACD line and the signal line is far the histogram gets bigger and bigger.
So how do we use this indicator :
1) Crossovers between the MACD line and the Signal line.
* When the MACD line crosses above the Signal line then its a buy signal (Bullish Crossover)
* When the MACD line crosses below the Signal line then its a sell signal (Bearish Crossover)
2) The Histogram .
A lot of people use histograms as a way to predict when a reversal will occur.
We know that the MACD is a momentum indicator so it can show us when sell pressure is low. And that means it might be a good time to buy. And It can tell you when your long position is about to run out of steam and when you should exit.
3) Divergences between the MACD and the Market Price .
A Divergence means that the indicator is not moving in sync with the Market Price and a Reversal could happen (Note that Reversal trading is risky so please calculate your risks before using this Strategy)
always remember that :
Bullish divergence is when the Market price is going down but the MACD is going up.
Bearish divergence is when the Market Price is going up but the MACD is going down.
I hope I’ve made the MACD easy for you to understand and please ask if you have any questions .
Hit that like if you found this helpful and check out my other video about the Moving Average, Stochastic oscillator, The Dow Jones Theory, How To Trade Breakouts and The RSI. links will be bellow

70 EmaHi traders
Ever woundered - "can i beat the market ?" or "what is my Edge ?"
try the 70 Ema !!
i will use daily chart
and look for clear trend direction
apply indicator called Moving Avarage Exponential and set it to 70
-- UPTREND --
on an uptrend look if the line support the price.
you will want to go long when price reach the blue line.
on the other hand, price tends to "come back" to the Ema, so you can try short if price is to far up (see microsoft chart)
combined with RSI indicator, you can get better feeling if the price is overboght (and go short) or oversold (and go long)
-- DOWNTREND --
On downtrend the 70 Ema will act as RESISTANCE - see $baba chart
same here - price tends to "come back" to the Ema ...
Good Luck

Double EMA (DEMA) From ScratchHello, traders!
Today we’ll speak about the most trivial, but very useful indicator that’s called DEMA. As you know, moving average is a backbone of 90% complicated indicators. It’s able to give lots of information about the price action. Well, let’s speak about it.
The double exponential moving average (DEMA) is a technical indicator introduced by Patrick Mulloy in his January 1994 article "Smoothing Data With Faster Moving Averages" in Technical Analysis of Stocks & Commodities magazine.
The DEMA uses two exponential moving averages (EMAs) to eliminate lag, as some traders view lag as a problem. The DEMA is used in a similar way to traditional moving averages (MA), but DEMAs react quicker than traditional MAs.
How to use DEMA?
-The average helps confirm uptrends when the price is above the average, and helps confirm downtrends when the price is below the average. When the price crosses the average that may signal a trend change.
-Indicate areas of support or resistance.
-Cross overs of 2 DEMAs. We sometimes draw fast DEMA(20) and slow DEMA(50). When the fast line crosses the slow below, it’s a bearish signal, when above - bullish. It’s consider to be a good entering signal. However, we shouldn’t forget that the indicator is still lagging.
Guys, I should remember you that every indicator shouldn’t be used in solo. You should only use them in conjunction with other indictor when they confirm each other. I hope, this knowledge will boost your trading skills and make your trading staff more interesting and profitable. Have a nice day, dear traders.

The RSI explained ! how to identify buy and sell signals Hello everyone , as we all know the market action discounts everything :) I have created this short video to explain what is the RSI and how to use it to identify buy and sell signals with this oscillator , everything you need to know about this indicator is right here.
Its been around since the late 70s so its probably one of the more established oscillators out there .
So lets check out the formula and how the RSI works :
RS=100 -100/1-RS
RS (relative strength) average X day up / average X day down
So simply lets say we are using a 10 days average so we check how many days the price closed up and we add them and we divide by 10 which would give us the average X days up.
And we do the same for the average X days down but we calculate how many days the price closed down and then we add them and divide by 10 ,And after all of that has been calculated we will always get a value between 0% and 100%
And that's why the RSI is considered a bounded oscillator it means that the value will always be between 0 % and 100%
The oscillator has 2 major zones which are the overbought and oversold zones. Anything above 70% is considered overbought and anything below 30% the market considered oversold .
So when the market reaches overbought zone it tells us that the market has gone up to far and its due a bounce back down , and the same when it reaches oversold zone it means that the market has gone to far down and its due a bounce back up.
So looking to buy or sell when the market reaches oversold and overbought is one strategy .
But because the market moves a lot and reaches these levels so much this way is not as reliable that much , the better way to use the RSI is to check if it has a divergence with the market price.
what is a divergence you may ask !!!
A Divergence is when the price of the market is moving in the opposite direction of a technical indicator, such as an oscillator, Divergence warns that the current price trend may be weakening, and in some cases may lead to the price changing direction.
These signals of divergences doesn’t happen that often but they do give us a better way to use the RSI .
And there is it that’s everything you need to know about the RSI and how it works it’s a really simple oscillator and its one of the most popular oscillators used by technical analysts.
_____________________________________________Make sure to Follow, Like & comment for more content_____________________________________________
If you have any questions please ask
Thank you for reading & watching .

Free public indicator helps free user.
---> The screenshot was ETH Perp, 1H, from 28th June to 13th of July.
a) First, limited access to indicator for free users.
Sorry for being poor, but I have to resort to this.
Some videos in youtube shows how you can click the same indicator multiple times, in order to utilize them to read the chart.
Like adding multiple EMA from public library. But doing that actually take two slot of your free indicator slot.
So, as poor as I sounds, there is free public indicator that combine or have multiple indicator in them. Like the one in my
screenshot, I used the multiple EMA + bollinger bands included.
I do think I need to adjust the BB, but I still don't understand which values is the best, so I stick with the current one.
This saves me EMA + EMA + EMA + BB = 4 slot already!
As I prefer to be able to tell something from just looking at the chart directly, so my design is all three free indicator slot is
viewable, but need to be quite transparent and distinguishable too. Sometimes the free public indicator can be save as another
template with different colors and designs, I just stick to Save as default.
b) Some free indicator is good!
Yes, there is no truly one indicator for all, but this Magic Lines VWAP / FOR SALE indicator is to me, is awesome.
I previously used MACD to read incoming uptrend or downtrend, because I watched the youtube tries 100x MACD and seeing
the winning rate is awesome, I stuck with MACD all the time. Until the market rekt me. Oh, this lagging indicator is truly live up
it's name eh?
So, I explore multiple public ones after heard the VWAP concept. It's too bad if you think VWAP is for smaller time frames, but if
there is VWAP for ALL time frames, that is awesome.
So, as from the screenshot, that MAGIC LINES VWAP is already edited just to show,
i- blue flexible lines is showing uptrend. A VWAP uptrend. As VWAP basically didn't change it's shape at all, this is great.
ii- pink flexible lines that connected with the blue line show downtrend. Also a VWAP downtrend.
iii- the blue plusses or pink plusses indicated "the best starting" entry for either long or short.
So form that free indicator alone, instead of me waiting for MACD crossing, VWAP just directly shows me this stuff already.
Even this is also good for swing trade. (Oh how I envy the ChartChampion thousands of precentage win).
Yes, there is an option just by using the heikin ashi candle, it's also serve the same uptrend and downtrend. But you know
right heikin ashi is just cosmetic right? Just an average ones right? (Sorry bad puns, I'll get myself out after finishing this).
c) The free MAGIC VWAP combines with EMAs crossing, it helps to read the chart.
i- Usually, when EMAs are under 200 EMA, it is downtrend. I purposely make 200 EMA as an area instead of line is too always
easily read at a glance whether we are in downtrend or uptrend. As long EMA 7 and 20 still inside the 200 area, it's still
going down. The further the downtrend it is. The closer, we can see the reversal thing, but wait the market to decide this.
ii- There is one youtuber video about riding the EMA lines, I can't remember. Say, on July 8th in screenshot, you enter at that
point, how do you know it's time to stop? You ride the EMA until it cross itself (the 7 and 20 ones). Remember, riding the
wave we get you pullback/retracement, so don't close your position too early, be patient and be calm.
When to stop? I'm not an expert about this, to me either you satisfy with your percentage or crossing appears.
Oh, before I forget, always and ALWAYS draw your 4H current resistance and support. The outermost range. The mini ones
like in the screenshot is any resistance or support that happens between the outermost 4h resistance and support range.
Make sure to touch as many as you can form the candle open/close and extend that range to the longest wick/shadow.
d) Bollinger band and Volume profile.
I'm still learning about this, but my prediction from this screenshot is the candle will come to the middle BB, and later going
downtrend back. And there is a free Volume profile indicator. (Oh how I wish I got money even for the Pro plan. Hmmmmm....)
Volume profile is interesting. Free indicator didn't show whether buying pressure is higher or selling pressure is higher, but we
can decipher is the trend is still going down or up. The highest in volume profile shows the current support or resistance range
there.
The key level/daily level or whatnot is got from youtube. Still I cannot afford their best membership, it's just I'm trying
to decipher the mentality the intelligence the psychology that they have. Maybe discovering there is free indicator that can
help free user too. Definitely joined after I can afford.
To conclude, TradingView is the best! And I'm sorry for my English. Writing this piece is meant to help me remember because
sometimes I forgot what some indicators do and to inspire or help other free user out there. It's not one month free trial is bad,
just it's not enough. And I think if I want to use that free trial, it's when I really really needs to. Don't you think it's tiring to
create multiple emails just to get the free stuff? Nope. I don't like that idea. If I can afford it, I will do it.
It helps support this free service that I love too.
Thank you so much for your time, you understanding of this, thank you very much for coming to my Ted-TradingView-Talk.
.

So you say you wanna range trade? Here's how you survive...DISCLAIMER: Trading Forex/Cryptocurrency involves risk and you may lose more money than you started with! These posts are not to be taken as financial advice and I offer NO guarantee that any of these ideas will result in profit. Also, trade ideas may change, depending on ever-changing market conditions. You are trading at your own risk and past performance is NOT indicative of future results. Please, know how much you are willing to risk on EVERY trade that you take and be SMART!
Simplify your trading. Always measure your risk and be okay with being wrong ; ) Wait patiently and get the price that you want. Use the market. Don't let the market use you!

The Moving Average Explained !!! Hello everyone , as we all know the market action discounts everything :)
A lot of people asked me about the MA and how to use it so i prepared this video for you guys explaining it please enjoy .
or if you prefer to read :
what is a moving average : its a simple technical analysis tool that smooths out price data by creating a constantly updated average price..
we use it to to create sell and buy signal (if the price is above the MA then it’s a buy signal , if the price is below the MA then it’s a sell signal )
Now lets talk about the different types of moving averages :
1_ the simple moving average (SMA)
2_ Exponential moving average (EMA)
Notice that the simple MA line is slow which means if the trend moves quickly its gonna take time for the simple MA to move and this is a problem called LAG , but the Exponential MA (EMA) tries to solve this
The EMA is the same as the SMA except it gives more weightage to recent price action
What does this means , it means when the trend changes quickly so does the EMA , the response time on the EMA is much faster then the SMA
So what if we combined them both to try to understand where sell and buy signals are . That’s called a crossover
3_weighted moving average (WMA) it simply combines the features of the SMA and the EMA
Its basically like a hybrid car it uses electric engine and a diesel engine so it has both of the two worlds ,, how ever the WMA is not as poplar as much as the SMA and the EMA
And that’s it now u guys have a better idea on what is a moving average is and its different types
Make sure to Follow and Like for more content
If you have any questions please ask
Thank you for reading & watching .

An easy yet super efficient trading strategy for any marketAn amazing combo strategy for trading.
Steps:
1. INTRUCTIONS
Plot the 7, 14, 33, 60 on the chart
Lets assume we use a 1h chart. For this we will plot on the support and resistance levels onto the chart using the 4hr or daily chart values.
For other timeframes, change the values with a 4-8x difference.
For this example I took BTCUSDT 1h, and you can see that the support and resistence on 4h is making the 30.5k - 41k channel more or less.
2. RULES
Once we have established and marked the territory zones , lets get down to business.
For the best results, it is best to enter the market when you find price hovering around a support or resistance level. Once price paints a confirmation candle you can enter the market, or you could wait until the 7 MA has crossed the
14 MA.
Entries at MAJOR support and resistance levels are key and will provide a greater return.
Always exit your trades once price returns to another support or resistance area. You can use the 33 and 60 MA as a stair stepper to get out of the market to protect your equity on your trades. However, re-entering the market once
you get confirmation of the market continuing in the original direction is a safe move.
Below you can find some examples for BTCUSDT 1H
3. RISK MANAGEMENT
For STOP LOSS you can use the value below the support zone, while for TP you can use either the resistence point or the support zone from the 33 or 60 SMA or a multiplier of the original distance below the support zone .

How To Tame A Reptile or Williams Alligator From ScratchHi, traders!
Have you ever heard about Alligator? Not from Australia or America but Williams Alligator. Both Australian reptile and Williams ‘pet’ have some common – they all have Jaw, Teeth, and Lips. So what is Williams Alligator?
As you know, you can get maximum profit during trend markets. You gonna enter to longs or shorts, to take some profit. It’s obvious that trading on choppy (sideways) market can be very dangerous for your funds. Thus, there’s the reasonable question, are you sure that the market has trend. Genius trader Bill Williams was concerned about the problem. That’s why he invented such pretty tool to define if market is trendy or choppy. It’s the first Alligator that’ll help you to earn money, but not spend them in boutiques.
So, let’s speak about technical part. The Alligator indicator uses three smoothed moving averages(calculated with a simple moving average), set at 5, 8, and 13 periods, which are all Fibonacci numbers. The initial smoothed average is calculated with a simple moving average (SMA), adding additional smoothed averages that slow down indicator turns.
The three moving averages comprise the Jaw, Teeth, and Lips of the Alligator, opening, and closing in reaction to evolving trends and trading ranges:
1. Jaw (blue line): Starts with the 13-bar SMMA and is smoothed by eight bars on subsequent values.
2. Teeth (red line): Starts with the eight-bar SMMA and is smoothed by five bars on subsequent values.
3. Lips (green line): Starts with the five-bar SMMA and smoothed by three bars on subsequent values.
The indicator applies convergence-divergence relationships to build trading signals, with the Jaw making the slowest turns and the Lips making the fastest turns. The Lips crossing down through the other lines signals a short sale opportunity while crossing upward signals a buying opportunity. Williams refers to the downward cross as the alligator "sleeping" and the upward cross as the alligator "awakening."
The three lines stretched apart and moving higher or lower denote trending periods in which long or short positions should be maintained and managed. This is referred to as the alligator "eating with mouth wide open." Indicator lines converging into narrow bands and shifting toward a horizontal direction denote periods in which the trend may be coming to an end, signaling the need for profit-taking and position realignment. This indicates the alligator is "sated."
The indicator will givefalse positives when the three lines are crisscrossing each other repeatedly, due to choppy market conditions. According to Williams, the alligator is "sleeping" at this time. Remain on the sidelines until it wakes up again. This exposes a significant drawback of the indicator because many awakening signals within large ranges will fail, triggering whipsaws.

AJ Trady 5 min ema and macd strategy.A new strategy that I have developed. Only enter when EMA crosses one of the longer term EMA's + a bullish cross is forming on the MACD. Ideally, you should wait for ema 8 to cross both ema 21 and 34 with a bullish cross formed/forming on MACD. Use alongside normal Support and Resistance for SL and TP levels. If used on crypto I mainly suggest just BTC as alt setups easily ruined by BTC doing what it wants.

Education excerpt: Simple Moving AverageSimple Moving Average (SMA)
The origin of inventing the Simple Moving Average (MA) is not clear. Although, some of the first documented cases of its use date as far back as the early 20th century. Implementation of moving averages in technical analysis is one of the most successful methods of identifying trends. Moving averages are simply constant period averages - usually of prices, that are calculated for each successive period interval. The result of calculation is then plotted on the chart as a smooth line that represents successive average prices. Thus, the calculation of the moving average dampens fluctuations of price of an asset, making it easier to spot an underlying trend. Though use of the moving average goes beyond identifying trends. Support, resistance and price extremes can be anticipated by correct interpretation of the moving average. Different lengths of moving average directly translate to the amount of data used in the calculation. Including more data in the calculation of the moving average makes each data per time interval relatively less important. Therefore, a large change in one particular data would not have as large an impact on the overall result of the calculation in comparison to if the moving average with a shorter period was employed. Hence, the longer moving average produces less false signals at the cost of revealing underlying trend sooner rather than later. Usually, the use of two moving averages with different period intervals is encouraged as opposed to use of a single moving average. This comes from the premise that when two moving averages with different period intervals are plotted on a chart, they tend to show two separate lines converging and diverging. Generally, when the moving average with a lower period interval crosses above the moving average with a higher period interval it is considered a bullish signal. On the other hand, when the moving average with a longer period interval crosses above the moving average with a lower period interval it is considered a bearish signal. These crossovers can serve as specific buy and sell signals in markets that are trending. However, moving average crossovers tend to produce many false signals in non-trending markets. Furthermore, these same crossovers can act as support or resistance levels.
Calculation and formula
The calculation of the moving average usually involves use of the close price. Normally, 10, 20, 50, 100 or 200 periods are used and the calculation is conducted by creating the arithmetic mean of a dataset.
SMA = (A1 + A2 + An) : n
A = average in period n
n = number of time periods
Illustration of weekly chart of DAI:
Red line = 50-day SMA
Green line = 20-day SMA
Disclaimer: This is just excerpt from our full text. This content is not intended to encourage buying or selling of any particular securities. Furthermore, it should not serve as basis for taking any trade action by individual investor. Your own due dilligence is highly advised before entering trade.

S&P 500: BASELINE | Investing and Trading for BeginnersIn this video I'm going over a way to start building an investment or trading strategy. Why is a strategy important? A strategy is a plan for survival in this financial world.
With me (and some* others), you'll learn that such a plan is crucial for the success of the portfolio because the main focus is TIMING. More questions arise from that but it's best to focus on one question at a time.

+341% profit, only 8.26% drawdown over a year. The humble EMA ⭐The choppy market has us back with a strategy for those that want to limit the downside and beat holding on spot. Remember as a trader you need one solid strategy that makes more than loses. This often has traders overcomplicating things and fishing for complex strategies with novel indicators that ruin their discipline at the end. Yet this strategy proves that even the humble EMA can rack in impressive returns at +341%.
The goal of the strategy:
1. Single digit maximum drawdown over the past year - yes this includes recent pullbacks which means beating the market over the past month
2. Easy to track so you have no excuses not to execute correctly and can potentially automate it
3. Beat holding on spot - so make more than 243.01% without leverage (you can include it depending on your risk tolerance, but the strategy has to work without it too).
4. No scalping - we're focusing on swing trading to limit transactional costs
WILL POST EVERY POSITION BELOW - will also show how each position was closed: close rule or stop loss
The strategy:
There was a lot of experimentation with the length of these EMAs (used for their responsiveness to recent prices) and this is the optimal version to fulfil the goals above. Of course you an experiment on your own if you have different ones.
On the 1 h chart:
1. Open a position when EMA (25) is crossing up EMA (50)
2. Close the position EMA (25) is crossing down EMA (70)
3. Stop Loss set at 2% (although you can run this strategy without it too and works quite well)
All conditions are respected 100% of the time.
The results:
The strategy profited at +341.03% beating holding by 100%. What's even better is the maximum drawdown is only 8.26% which for a crypto strategy is exceptionally stable. The result was accomplished over 52 position out of which the strategy wins 21. However the average win is at 10.2%, while the average loss is only -1.79%. This is important to know when you execute the strategy to not be thrown off after a cluster of loses.
Winning trades are held for almost 8 days, while losing trades are cut after only 1-2 days. This is also connected to the tight stop loss and if you tolerate risk you may try expanding that time. For our purposes that did not fit the goals of the strategy.
Lastly, over the past month this strategy performed about 35% better than the market, which means you would be left with plenty of funds at the moment. We consider the set goals achieved.
The positions (Open Price, Close Price, Stop Loss, profit, what closed the position):
31/05/2021 13:00
01/06/2021 09:00
20 hours
OP 36,777
CP 36,041
SL 36,041
-2%
Stop Loss
24/05/2021 18:00
25/05/2021 11:00
17 hours
OP 37,668
CP 36,915
SL 36,915
-2%
Stop Loss
07/05/2021 14:00
10/05/2021 20:00
3 days
OP 56,997
CP 55,858
SL 55,858
-2%
Stop Loss
05/05/2021 19:00
06/05/2021 19:00
1 day
OP 57,302
CP 56,156
SL 56,156
-2%
Stop Loss
30/04/2021 13:00
04/05/2021 05:00
4 days
OP 54,656
CP 55,809
SL 53,563
+2.11%
Close Rule
26/04/2021 06:00
29/04/2021 20:00
4 days
OP 52,535
CP 52,860
SL 51,485
+0.618%
Close Rule
08/04/2021 23:00
16/04/2021 10:00
7 days
OP 57,916
CP 60,644
SL 56,758
+4.71%
Close Rule
05/04/2021 19:00
06/04/2021 15:00
20 hours
OP 58,876
CP 57,699
SL 57,699
-2%
Stop Loss
26/03/2021 23:00
03/04/2021 22:00
8 days
OP 54,383
CP 57,631
SL 53,295
+5.97%
Close Rule
24/03/2021 18:00
24/03/2021 20:00
2 hours
OP 56,126
CP 55,003
SL 55,003
-2%
Stop Loss
17/03/2021 23:00
18/03/2021 21:00
22 hours
OP 58,300
CP 57,134
SL 57,134
-2%
Stop Loss
07/03/2021 02:00
15/03/2021 13:00
8 days
OP 49,122
CP 56,440
SL 48,140
+14.9%
Close Rule
01/03/2021 12:00
05/03/2021 00:00
4 days
OP 47,722
CP 48,374
SL 46,768
+1.37%
Close Rule
01/02/2021 20:00
22/02/2021 16:00
21 days
OP 33,838
CP 53,237
SL 33,161
+57.3%
Close Rule
01/02/2021 13:00
01/02/2021 17:00
4 hours
OP 33,770
CP 33,461
SL 33,095
-0.916%
Close Rule
28/01/2021 19:00
29/01/2021 08:00
13 hours
0.74633 BTC
OP 32,634
CP 31,981
SL 31,981
-2%
Stop Loss
25/01/2021 05:00
25/01/2021 22:00
17 hours
OP 33,378
CP 32,710
SL 32,710
-2%
Stop Loss
19/01/2021 01:00
20/01/2021 00:00
23 hours
OP 36,677
CP 35,943
SL 35,943
-506.16 USDT
-2%
Stop Loss
13/01/2021 23:00
15/01/2021 16:00
2 days
OP 37,204
CP 36,460
SL 36,460
-2%
Stop Loss
05/01/2021 19:00
11/01/2021 00:00
5 days
0.68049 BTC
OP 33,373
CP 38,150
SL 32,705
+14.3%
Close Rule
24/12/2020 23:00
05/01/2021 08:00
11 days
OP 23,708
CP 30,818
SL 23,234
+30%
Close Rule
22/12/2020 22:00
23/12/2020 12:00
14 hours
OP 23,435
CP 22,966
SL 22,966
-2%
Stop Loss
12/12/2020 10:00
22/12/2020 01:00
10 days
OP 18,433
CP 22,558
SL 18,065
+22.4%
Close Rule
06/12/2020 01:00
06/12/2020 14:00
13 hours
OP 19,269
CP 18,883
SL 18,883
-2%
Stop Loss
28/11/2020 21:00
04/12/2020 23:00
6 days
OP 17,673
CP 18,665
SL 17,320
+5.61%
Close Rule
16/11/2020 08:00
26/11/2020 05:00
10 days
OP 16,236
CP 17,772
SL 15,911
+9.46%
Close Rule
03/11/2020 19:00
15/11/2020 20:00
12 days
OP 13,741
CP 15,855
SL 13,466
+15.4%
Close Rule
30/10/2020 16:00
02/11/2020 13:00
3 days
OP 13,550
CP 13,279
SL 13,279
-2%
Stop Loss
29/10/2020 18:00
30/10/2020 01:00
7 hours
OP 13,584
CP 13,312
SL 13,312
-2%
Stop Loss
18/10/2020 07:00
29/10/2020 09:00
11 days
OP 11,450
CP 13,124
SL 11,221
+14.6%
Close Rule
15/10/2020 20:00
16/10/2020 05:00
9 hours
OP 11,521
CP 11,291
SL 11,291
-2%
Stop Loss
08/10/2020 15:00
15/10/2020 04:00
7 days
OP 10,912
CP 11,379
SL 10,694
+4.28%
Close Rule
04/10/2020 15:00
07/10/2020 00:00
2 days
OP 10,605
CP 10,600
SL 10,392
-0.0461%
Close Rule
01/10/2020 03:00
01/10/2020 17:00
14 hours
OP 10,817
CP 10,601
SL 10,601
-2%
Stop Loss
24/09/2020 21:00
29/09/2020 18:00
5 days
OP 10,627
CP 10,675
SL 10,414
+0.459%
Close Rule
14/09/2020 12:00
20/09/2020 18:00
6 days
OP 10,470
CP 10,895
SL 10,261
+4.06%
Close Rule
09/09/2020 17:00
14/09/2020 01:00
4 days
OP 10,240
CP 10,273
SL 10,035
+0.329%
Close Rule
28/08/2020 16:00
02/09/2020 12:00
5 days
OP 11,529
CP 11,299
SL 11,299
-2%
Stop Loss
24/08/2020 05:00
25/08/2020 10:00
1 day
OP 11,679
CP 11,599
SL 11,445
-0.681%
Close Rule
14/08/2020 00:00
19/08/2020 06:00
5 days
0.87822 BTC
OP 11,780
CP 11,711
SL 11,544
-0.581%
Close Rule
10/08/2020 02:00
10/08/2020 11:00
9 hours
OP 11,851
CP 11,614
SL 11,614
-2%
Stop Loss
05/08/2020 11:00
09/08/2020 18:00
4 days
OP 11,393
CP 11,527
SL 11,165
+1.17%
Close Rule
19/07/2020 23:00
02/08/2020 21:00
14 days
OP 9,185.8
CP 11,088
SL 9,002
+20.7%
Close Rule
18/07/2020 17:00
19/07/2020 04:00
11 hours
OP 9,164.6
CP 9,153.4
SL 8,981.3
-0.122%
Close Rule
13/07/2020 00:00
14/07/2020 05:00
1 day
OP 9,303.3
CP 9,190
SL 9,117.2
-1.22%
Close Rule
12/07/2020 09:00
12/07/2020 14:00
5 hours
OP 9,254.4
CP 9,210
SL 9,069.3
-0.479%
Close Rule
06/07/2020 08:00
10/07/2020 01:00
4 days
OP 9,200.1
CP 9,214
SL 9,016.1
+0.152%
Close Rule
05/07/2020 04:00
05/07/2020 22:00
18 hours
OP 9,129
CP 8,946.4
SL 8,946.4
-2%
Stop Loss
29/06/2020 21:00
01/07/2020 07:00
1 day
OP 9,185
CP 9,134.5
SL 9,001.3
-0.549%
Close Rule
21/06/2020 08:00
24/06/2020 15:00
3 days
OP 9,369.5
CP 9,295.2
SL 9,182.1
-0.793%
Close Rule
16/06/2020 04:00
17/06/2020 15:00
1 day
OP 9,562.5
CP 9,371.3
SL 9,371.3
-2%
Stop Loss
08/06/2020 02:00
11/06/2020 16:00
4 days
OP 9,742.6
CP 9,547.8
SL 9,547.8
-2%
Stop Loss

ETH vs. BTC - Who's the likely winner?DISCLAIMER: Trading Forex/Cryptocurrency involves risk and you may lose more money than you started with! These posts are not to be taken as financial advice and I offer NO guarantee that any of these ideas will result in profit. Also, trade ideas may change, depending on ever-changing market conditions. You are trading at your own risk and past performance is NOT indicative of future results. Please, know how much you are willing to risk on EVERY trade that you take and be SMART!
Simplify your trading. Always measure your risk and be okay with being wrong ; ) Wait patiently and get the price that you want. Use the market. Don't let the market use you!

How to find potential strength ; )DISCLAIMER: Trading Forex/Cryptocurrency involves risk and you may lose more money than you started with! These posts are not to be taken as financial advice and I offer NO guarantee that any of these ideas will result in profit. Also, trade ideas may change, depending on ever-changing market conditions. You are trading at your own risk and past performance is NOT indicative of future results. Please, know how much you are willing to risk on EVERY trade that you take and be SMART!
Simplify your trading. Always measure your risk and be okay with being wrong ; ) Wait patiently and get the price that you want. Use the market. Don't let the market use you!

Using the Moving Average Convergence Divergence (MACD)MACD – What it is
The Moving Average Convergence Divergence (MACD) is the momentum indicator that shows the relationship between two different moving averages:
1. The 12 period exponential moving average – On Tradingview it is the Fast Length.
2. The 26 periods exponential moving average –On Tradingview it is the Slow Length.
The MACD line is calculated by subtracting the 26 period EMA from the 12 period EMA.
The Signal line is the 9 period exponential moving average.
These two lines are then plotted on top of each other. These are the two lines you see when you turn on the MACD indicator.
Additionally, there is a histogram that shows the distance between the two lines. Larger bars tell us that the MACD and Signal are further apart.
When it comes to candles, size matters. The larger the candle the more momentum the trend has.
The histogram will turn green when the MACD line is above 0 (bullish) and it will turn red when the MACD line is below 0 (bearish).
Very bearish momentum is shown above. Photo was taken May 23, 2021.
How to use the MACD
The most important thing to know about the MACD is how to read the relationship between the two lines.
I’ve found that the best timeframe to use the MACD with is daily. This is because the MACD is a lagging indicator and using daily data prevents a lot (not all) of false buy and sell signals.
These signals are:
• When the MACD line crosses above the signal line it is a buy signal
• When the MACD line crosses below the signal line it is a sell signal
Additionally, it is best to use the MACD in a trending market; a market with a clearly defined up or down trend.
Using the MACD with trend lines is a very powerful combination.
The reason for this is that if the market is moving sideways, you can see small fluctuations where the MACD and Signal Line cross but the price does not really go anywhere. These are false breakouts.
Therefore, these signals are not automatic buys and sells.
There are ways of confirming the indications from the MACD chart.
One way is a strategy that uses the RSI and MACD together (which is beyond the scope of this text, but I will discuss in my next article).
Another way is to use the MACD with the current trend. So, if you are in an uptrend and then you see a bullish cross, then this is confirmation that you are likely to go higher.
The same is true in reverse.
Also, please note that the cross over happens well after the price either stabilizes or rises. Again, this is because the MACD is a lagging indicator.
Leading Indicator?
Since the MACD and Signal lines are lagging indicators is there something that can be used in a predictive way?
Some traders use the histogram as a way to predict when a reversal will occur.
Since the MACD is a momentum indicator it can show us when sell pressure is alleviating. Meaning it might be a good time to buy.
This doesn’t always work of course, but with good risk management (stop losses) you can often get into a position well before its breakout.
Conversely, it can show you when your long position is running out of steam and can warn you when to get out.
MACD Divergence
Another useful way to use the MACD is to spot divergences.
A bullish divergence, very similar to the RSI, is when the short-term price trend is going down but, the MACD is going up.
Bearish divergence, also very similar to the RSI, is when the price trend is going up but, the MACD is going down.
Trading this way is sometimes not a good idea because you are trading against the trend. Please practice good risk management if you are trading reversals.
Also, notice the buy signal right before the sell signal that is circled. I really want to hammer home the point that the signals are not automatic buys and sells.
Price action is a great way to confirm the reversal (to the up or down side) of a trend. Because simply spotting a divergence does not guarantee the price will follow.
Final thoughts
As you can see there are different ways of successfully using the MACD. I hope I’ve made a few of these ways clear in this beginner guide.
Please let me know if you have any questions and if you like it, please hit the thumbs up and be sure to follow for more.
Links to my Fibonacci Retracement and RSI guides are below.
Thanks for reading!

Spotting Wyckoff Distribution Early? Come see how!DISCLAIMER: Trading Forex/Cryptocurrency involves risk and you may lose more money than you started with! These posts are not to be taken as financial advice and I offer NO guarantee that any of these ideas will result in profit. Also, trade ideas may change, depending on ever-changing market conditions. You are trading at your own risk and past performance is NOT indicative of future results. Please, know how much you are willing to risk on EVERY trade that you take and be SMART!
Simplify your trading. Always measure your risk and be okay with being wrong ; ) Wait patiently and get the price that you want. Use the market. Don't let the market use you!
