How to analyze any market from scratch (Impulse & Correction) #2Hello everyone:
I received positive feedback on the last video on how to analyze the market from scratch,
and many have told me to make more of these similar contents. So here we go :)
I will go through multiple examples of how I would analyze the market by following these simple steps:
Multi-time frame analysis (Top Down Approach) Start from HTF to LTF
Identify the Impulse Phase and Correction Phase
Identify whether the Corrections is Continuation or Reversal
HTF Bias > LTF Confirmation > LTF Entry
Any questions, comments or feedback welcome to let me know :)
Thank you
How to analyze any market from scratch #1
DISCLAIMER:
-My forecast and analysis are NOT financial Advice, you should not trade and invest solely on this information.
-There are many scammers & fakers impersonating me, my channels/platforms to scam people. Be very careful as I will NEVER private/direct message you first no matter what.
Risk Management

A brief explanation on the importance of risk managementEvery human activity has its ups and downs. You may face good days and bad days and it’s a norm in any other human kind activities.
Read history! Did all dynasties get consistently stronger?
In politics, did popularity rates of political figures get better day by day?
Sure not!
Even in natural events, you see uneven decreases and increases. Not only the annual rainfall rates are not always the same, but the rate of increases and decreases varies from year to year.
So strategies and setups won’t always work because they simply are man-made things to predict a human-based activity! They may fail, expire or disused someday, because this is the neutrality of nature and creatures including humans and their markets. For the last instance, even stars grow and fall.
I know there are some traders who claim their strategy will never expire. They may be liars, but they are not necessarily liars! Those who believe their strategy will never expire will admit that their strategy had bad days too. I like to say their strategy has expired and reactivated again and since they consider longer cycles (monthly, yearly or even bigger) they believe their setup has never expired. If we want to be more precise their strategy has expired but just for shorter periods (may be just for hours!).
Let me explain a little more technical, every setup is compatible with specific conditions of the market and they will fail in other markets’ conditions and traders are not foreteller but predictors, so they sometimes may get conditions have changed and sometimes they predict it wrong or get the change so late! So they sometimes make profit and sometimes don’t. For example RSI overbought and oversold strategy do not make profit in trending market on the side of the trend! I mean if markets are bullish, overbought is a norm not a sign of reversal (most peak of reversals happens in overbought or oversold but not every oversold is a sign of reversal in a trending market) and in a super bullish trending market you almost can’t find any RSI oversold. So you should use another setup! ( some traders using kind of strategy which has different setups for different conditions of market, they actually guess when their strategy is going to expire)
I divide the professional traders by methods that they choose to avoid using an unsuitable for market conditions into four general categories.
1- Ignorers: Since they got a conservative risk management strategy and they could easily ignore expiration phenomena and trade without worrying about expiration.
2- Rule makers: They have different setups for different conditions. They specify some rules to distinguish market conditions and adapt new setups to their trades. Rules could be created by using both indicators or indicator-free (price action) chars.
3- Sentimental Market traders (in case of expiration): Some traders do not use specific rules! They simply just sense market conditions has changed. They differ from rule makers because they don’t use a specific rules every time. They may use some rules unconsciously but those rules may differ time to time.
4- Equity curve analyzers. They simply analyze equity curve! They make specific rules to start using or stop using a strategy! For example they will stop using it if it is a loss-maker one for 2 weeks (this one won’t work in most strategies) or they simply try to use price action rules to analyze EC of a setup! “Mark Douglas (1990) is saying that if traders were to chart their equity, these charts would look very much like the typical bar charts and charts like these also can have the same predictive value as in the markets” “Procedia Economics and Finance 32 ( 2015 ) 50 – 55” these kind of traders may use indicators like SMA or WMA to predict profitability of a setup in future and they are also eager to use price action rules.
I believe no method is superior to another, the way an experienced trader use the method is important! But having a method to avoid large losses is necessary. And all traders consciously or unconsciously use one of them. Most price action traders are ignorers. Their strategy may expire but for short period of time. For example mine is expired right now but I’ll continue using it cause I know it’s temporarily and I don’t know when exactly it will reactive again. I also use a self-made auto-trading expert which use different indicator based setup and since the period of expirations of that setups are long, I use EC analyzing methods to detect expirations .
No matter which method you use, you can’t be an always winner trader! Ignorers may loss and they will name it exceptions. Rule makers’ rules may detect and signal expiration too soon or too late! The 3rd and 4th kind of traders may make mistakes too. There is no single trader in the world with 100% win rate in long-term!
That's why you need to limit our risks, I like optimism in life (I prefer pessimism in back-tests) but you should not be deluded, you should think what happen if you lost some consecutive trades?
If you risk more than you can handle consecutive losses emotionally, You will empty your trading account, no matter how good a teacher you had or how much you have practiced or how great trading past you have or how experienced you are or even how much you believe your emotions are in control of you
(you actually can’t control in real big loses trading), YOU NEED TO LIMIT YOUR RISK by managing it in a way that your trading is profitable enough and simultaneously do not be destructive at certain times
"Profit a little less but more consistent."
There are also too many other important rules for money and risk management and you should take them into consideration too.
Best Regards, Alisignals

TRADING PSYCHOLOGY | Common Traps You Must Know 🧠💭💫
Hey traders,
Trading psychology plays a very important role in a learning curve of a trader. In this post, we will discuss common biases and traps that every struggling trader is occasionally facing.
⚓️Anchoring Bias
People rely too much on a reference point from the past when making a decision for the future - they are "anchored" to the past.
Imagine you spotted a great trading opportunity & made a nice profit. Encountering a similar setup in the future you trade it again. It turns out that you lose.
Next time - same thing. The setup that initially brought you nice cash refuses to work.
Even though the probabilities indicate that the identified pattern produces negative long-term returns, you keep taking that because you are "anchored" to the initial winner.
🙅♂️Loss Aversion
This is when people go to great lengths to avoid losses because the pain of loss is twice as the pleasure received from a win.
You see a great trading setup. You are 100% sure that it will play out. You open a trade and guess what? The market goes in the opposite direction. You can't believe that you are wrong. Instead, you decide to hold your position just a bit more adjusting your stop loss. And again, the market refuses to go in the direction that you projected. It is a vicious cycle that most of the time leads to substantial losses.
✅Confirmation Bias
The confirmation trap is when traders seek out the information that validates their opinions and ignores any theory that invalidates them.
You spotted a great long opportunity on GBPUSD. Checking the ideas of other traders on TradingView you consider only the ones that confirm your predictions completely ignoring the opposite ones.
👑Superiority Trap
Many traders have lost large sums of money in the past simply because they have fallen prey to the mentality of overconfidence.
Imagine that you caught a winning streak. You feel like the king of the world. You spend less and less time and reflection on each consequent trading decision that you make, you lose your focus. At some moment the reality kicks in and your gains evaporate.
🐮Herding
As a trader, you should execute your own analysis & avoid the temptation to blindly follow the majority.
Analyzing a EURUSD chart you make a conclusion that the market is bearish. However, then you see that 90% of the traders are very bullish on TradingView.
Instead of following your own analysis, you decide to join the herd.
These biases are common and most of the time we fall prey to them unconsciously.
The more you self-reflect, the more you analyze your thoughts and actions, it would be easier for you to avoid them.
Have your ever fallen prey to these traps?
❤️Please, support this idea with like and comment!❤️

A Traders Psych Evaluation
1. Asides money, why else do you trade?
2. When you’re not trading, what do you do with your free time?
3. If you bagged a million dollars in trading today… what’s your first step?
4. Your favorite trading book—if any?
5. Who do you admire most in trading?
6. What are you most afraid of in trading?
7. If you could change everything about your trading career—what would it be and why?
8. What subject in school made the most impact in you?
9. If you died today, what do you wish to be remembered for?
10. Are you addicted to trading?
11. What’s the most defining moment of your trading career?
12. Your dream destination?
13. Your favorite trading memory?
14. What do you feel most proud of?
15. Who introduced you to trading?
16. What’s your worst/best childhood memory?
17. If you had a chance to do-over in life… what would you do differently?
18. What’s your strongest quality?
19. Most embarrassing thing you’ve done in trading?
20. What’s a skill in trading you wish to learn and why?

Why Do You Want To Become A Trader? HI Traders, welcome back to another workshop. In this workshop, I'll be sharing my thoughts on various considerations before becoming a full-time trader.
Most people begin their trading journey with a mindset of "How can i get rich quick?".
It is often just a matter of time where reality hits them awake, then they'll notice that trading isn't an ATM. Instead, it is a money churning machine that most people just keeps throwing their hard earned savings into.
To become a successful trader, it is going to take a lot more than an affirmation "I want to be rich/ I want to become a successful trader."
Personally, the definition of trading success is the ability to organize your emotion and performance to achieve high performance, ultimately, scale your trading business.
We don't need to make hundreds of thousands a month to become a successful trader. If you're able to just provide your family a better and more comfortable living through trading as compared to your 9-5 job, you've already achieved success.
Think about it.
Let me know your thoughts in the comments below.
Do not forget to like if you enjoy the content, and share with someone who need to listen to this.

Your Success Formula | What Drives a Big Change 🏔️
Hey traders,
There’s a well-known Chinese proverb that says, “A journey of a thousand miles begins with a single step.”
The one thing that prevents you from attaining your goal is hidden in your psyche, deep inside your soul. People usually look for shortcuts and want to accomplish their goals in one night. But the thing about long-term goals is that they can not be accomplished in a single day! It’s not like they require one huge, monumental effort to be achieved.
The only way you’re going to accomplish something really big and ambitious – the kind of goal that will transform your life forever – is by consistently taking one small step at a time in the direction of your dreams.
The importance of small incremental steps should be recognized by everyone, life is full of challenges, ups, and downs, but one should not lose hope or give up during the process. Failure should be considered as a learning point, an opportunity for growth.
Be ready for a journey of thousand miles this year. Be ready to meet the chaos and unknown. That is the only way to evolve and be better.
Remember that nothing is impossible to achieve unless you decide to do it at all costs.
Do you agree with this quote?
❤️Please, support this idea with like and comment!❤️

What did I learn from 2021 in Trading, & what can I improve on ?Hello traders:
Welcome to 2022 in trading. I am very happy to start off the year with a positive attitude and get ready for the year.
This year will be my 9th year in trading, so certainly a journey thus far.
What I usually will do is to look at trades that I have taken in the whole last year, to find areas to improve.
What can I do better, and what can I change/modify to my trading plan that will help me to become a better, consistent, sustainable trader.
I highly suggest everyone to review their 2021 trading journals, find mistakes that you made, and work on them.
Revisit your trading plan to see what areas can be changed and modified. They can be entry, SL/TP, management and much more.
Below are a few things that I personally find that I can improve more on:
Trade Management:
-Specifically, whether to take profit always at 3:1 RR, or hold onto the trade for longer
-Pros and cons and no right or wrong when it comes to this part.
-Sometimes holding a trade longer term may see price reverse and lose profits
-Sometimes taking profit too early will see trade continue to its desire direction
# of Trades Taken:
-Last year was aiming for about 15 trades per month last year
-The more trades we take, the more potential “Mediocre” trades we enter, those can eat up our good trades’ profit
-Can argue and reduce the # of trades to even less
-Instead of 1-2 same currency pairs allowed, cut down to just 1. Unless I can move it to BE
Understand and Accept the Market can Change/Evolve:
-Market is ever changing and evolving with no pre-determine factors. It can be a variety of factors that is out of our control as a trader
-Key is to always stay in “sync” with the market and its behavior.
-Never “blame” the market if your trading hits a draw down or doesn't “work out” from before.
-Understand as traders we need to adapt to any type of situations to remain consistent and sustainable in the long run
-Find solutions to work around it.
Thank you all
Treat trading like a business or you might not succeed:

Performance Anxiety In Forex & TradingPerformance anxiety starts with your belief… Where do you stand presently in—trading?
In previous years, I have witnessed people having mind attacks—because they tell themselves convincing stories of how they can’t achieve stuff.
You’re probably wondering what these mind attacks are?
Well, mind attacks as the name implies is—when your mind overcomes your consciousness. Monte sahaja referred to it as, “an opportunity to check in yourself”. The ideal question here is, who is attacking your mind?
I want to believe that—the mind is actually the most convincing liar that ever existed. Well, a topic for another day!
There’s a lot to talk about and I wouldn’t want to complicate things. So, mind attacks leads to anxiety, which leads to doubt and we gradually build the P.A.
My early days of high school, I would seat at talk-shows—then go home to talk to mirrors and shadows. But, when invited to speak, I freeze. “There’s a problem”, I thought. What could it be?
Jane will say, “you can do it”… But, I know it’s easier said than done. After-all, more is said—than done, sometimes.
A boy from the audience, can’t really remember his name shouted, “Anx-boy”. The others would laugh.
“What is anx-boy?”, I asked.
“It’s a boy who suffered from anxiety”, Jane muttered.
What, I don’t have anxiety or do you think I do?… I mean—it’s because I’m new right?… Funny how you convinced yourself into believing that lie. Pfft, rubbish!
“Shut up Judith!”, Jamal mouthed. Agh… I hate her she doesn’t just know when to shut-up. Everyone just thought I was weird but, you need to meet Judith she’s annoying.
Only Jane understood. The rest, well, I was this mad guy that speaks to himself or better yet—anx-boy.
Performance Anxiety And It’s Meaning
Each time I try to do something, I become anxious and I mull over different possibilities. Judith left me a funny note one day. It read, “Hey, nut job—what’s faster than light?”. Heh! she’s rude.
Anyway, I pondered as to why she asked that but, couldn’t figure it out.
Every time I see this yellow and green vehicle—I let out a huge sigh, yet another day of bullies. Anyway, I had an assignment from Judith. The sun pale; the wind on my face feels like burger and cheese—maybe I was just craving it. “We’re here!”, Jane brings me back to reality.
“I’ll meet you in chemistry”, I told Jane—as I hurriedly left for the library. The mid-day high’s library was the biggest in England—You could get lost in books over there. Haha! I love playing with words.
Strolling down mid-day’s library, I picked up every book I could find on—“what’s faster than light?”. “This girl (Judith) must be joking asking me that”… “Maybe she wanted me to figure something out”, I gasped.
All books I read, said—nothing was faster than light; that’s the speed of the universe. She must have lost her damn mind. Moving away from the library, I stumbled over a book with an interesting title, “Our thoughts and mind are faster”. Hmm… Okay this looks interesting.
Hovering over the lines for 2 hours, I figured out Judith’s riddle. “It’s my mind”… I remembered “anx-boy” then, it occurred to me that Judith was only trying to help. “Thanks Judy”, I smiled.
Pulled out my backpack, took my pen and wrote, “New mission, what is anxiety and why do I have it before a task”.
Terrible memories in England’s mid-day and the only thing that didn’t suck were—the school’s WIFIs. Yep! those bronskies were really fast. Pulled out a computer-chair, started my research.
What Is Performance Anxiety?
Well, I had no idea what anxiety meant, I started my research with the little computers we’ve got. The dictionary definition of “anxiety” is—worrying excessively about an uncertain outcome. Heh, made it easier for myself. It made sense now why I was called that. I just worried so much about futuristic plans and my perfectionist self—just couldn’t stand it going wrong.
So, that means there are different kind of anxieties. I randomly just typed, “What is the anxiety you get when you want to do something? And… Performance anxiety popped up.
Woah, just realized not all anxieties are from doing stuff. What then is performance anxiety?
It’s the fear someone experiences before or during a specific type of performance. When someone has performance anxiety, they fear that the performance will be a failure even if they are well prepared.
Usually—occurs when fear of outcome, interferes with the process of doing.
It’s Meaning…
If we can train ourselves to not overreact to negative outcomes, then we won’t have to deal with P.As. It occurs when we become so worried or concerned about the outcomes of our performance that our nervousness interferes with the performance itself.
“Damn you PA!” I can’t believe you’ve ruined my life. Uhm—What else do they have on this anxiety?
Classic examples include “freezing up” when giving a public speech.
Under conditions of performance anxiety, people will make decisions to manage their emotional states—rather than to properly manage their reality. Very often, these guys will have good ideas but will never participate due to—fear of failure. “Well, that’s true”.
You know, anxieties are just stories we tell our minds… It’s one of the paradoxes of performance; we are ready to win when we are no longer threatened by our failures.
For real? I mean that’s true though cos’ I be imagining different possibilities of failure. Then, I come up with the conclusion that maybe that’s what I am. “Anx-boy the failure!”
Why Traders Suffer From PA?
Sorry! I zoned out a little. The story I was telling, is actually going to be told in my book (coming soon). Back to the actual first sentence—Where do you stand presently in—trading?
Traders who suffer from PAs, are mostly seen as perfectionist or fear holders. What kind of fear am I speaking of?—It’s our very own, “atychiphobia”. But, you’re probably wondering why—I’ll help you.
When you trade to not lose, instead of win, you find yourself in the bubble of performance anxiety. You start avoiding future performances—because you believe failure will/might result in humiliation or rejection.
I keep coming for the media traders!
People of this generation, actually love the idea of social gratification—that they believe anyone who post cars and money. Why? I mean who doesn’t like the goodies of life… It’s just that most times, these goodies aren’t really what you need as a beginner.
Yeah-yeah, we all love a good motivation but—we get in the game (trading) without realizing that—it’s not as easy as it looks. The simple reason traders suffer from PA is—they avoid losses so much that, it actually takes their willpower of actually making trade orders.
The other day, I was at a seminar and this guy said, “the only skill a trader needs to be successful is—to know how to click you mouse”. If you think about it—it’s true. Anyone can tap a buy or sell and be in profit. In one of my podcast episodes, I spoke about the difference between being a trader and being profitable.
So, to me—PAs are just signs of ego and the fear of rejection.
The One That Fears Rejection
Day 53 of personality exploration…
What if I fail, don’t get it right or they don’t like me?—That was all I was thinking about. I mean, no friends, bullied, just plain rejection or at least, that’s what I “thought”.
You know—mama would say, “Humans are like shells, we seek to protect our interior from any potential harm” Heh, or is it crabs? She definitely used an animal. It’s funny how most times—fear can only be an “illusion” that we created by “ourselves” using our own minds.
It may be due to loss, trauma or just experience itself. Most people don’t realize how powerful they are—because they’ve lived their life in a bubble, they created. You know what I think, Fear is only an illusion. A dream only comes true if you believe it. Have you ever imagined the life you want and I don’t mean the, “Oh! I want to succeed” kind of imagination. I mean in details!
The moment I realized how much I can do with my mind, that’s when I started journaling every single move, decision, and step I made.
Every failure and successes in our life, started with a single thought. Now a thought is just a noun but—it becomes a verb when you believe it.
Similarly, performance anxieties are created from just a single thought of, “What if”… Here’s a riddle I created for you: When is a thought not a thought? Answering that alone, would make you as powerful as, God himself. I mean—we’re made from his own image right? You only take the image of a god—when you realize just how powerful you are.
Trader Lydia’s Story
A friend once said, “Thoughts have no power till they have your attention”. The fear of rejection tends to affect our ability to succeed in personal and professional areas of our lives.
Sylvia, my mom, told me of a trader who was so lonely that—she sought after validation from others. Ergo, she chose perfection over progression. Never wanted to be seen as weak in front of other traders, never acknowledged her losses—in-fact, she was embarrassed by them. How else was she going to be accepted—by the rest of the traders, in a pack?
Lydia was scared of rejection!
This affected her performance as a trader. She was never able to trade properly as she now developed performance anxiety (PAs). Funny, she had an edge, the right knowledge of the markets but, she just couldn’t pull the trigger. Many will say, “she’s a coward” but—I just think Lydia needed acceptance. You see, once you learn to accept certain truths—life won’t have to be difficult; trading won’t have to be difficult.
Traders have grown to believe you need a team to succeed—I just want to let you know that, “There’s no T-E-A-M in Trading, There’s an I.”
Her story changed when she realized, she only had herself to impress.
The One With Ego
Day 54 of personality exploration…
Every morning I wake up I tell myself, it’s okay to be proud of yourself but, mom would say, “too much of everything is bad”. Heh, everyone has an ego. I just think ego means knowing yourself well enough to know what you’re worth. It’s knowing that your unique and can stand up for yourself.
There’s something funny about the ego though—egos live in the past and the future, they don’t believe in acceptance as well, attachments come easily to them.
It’s 9:00 am and all I’m thinking about is my pitch. I remember what happened when I was 15—there was panic, people laughed, most wooed. I wonder if it will happen again?
Did you notice what I did there? That was my ego speaking. Ego thought of the past and the future in just a single sentence. That’s what happens when we do too much of everything. Mom would say, “On the highest throne in the world, we still sit only on our own bottom”.
Having PAs that day was because—my ego is sometimes the bad guy. When you live in the past and future you give “ego” a power to ruin your entire life.
Before I close off, Maxime said I should let you know that you should, “Destroy your illusions so you can see reality. Destroy your fears so you can take risks. Destroy your ego so you can see life”.
So, where do you presently stand in—Trading?…
‘Wake up Jam’, Jane screamed… it’s your turn to give your pitch.

Make 2022 Great Again!!!Top 10 Things To Work On in 2022 Related To Forex Trading:
1) Price Action is #1
2) Risk Management (will help you or hurt you)- always trade only 1% to 2% of account on one individual trade. Lot sizes, stops, targets etc...
3) Always use a stop loss ( let trade breath give it room for price action to go wrong way, before price action does what your trading plan says it would)
4) Use major supply or resistance or demand or support areas to set up trades (check into using pivot points- especially if day trading or scalping)
5) Remember these four things: Right pair, Right price, Right session(s) and Right Time
6) High liquidity and volume are from Tokyo end to London end (12 hours)- consider only trading between these hours. Other time, have some fun!!!
7) Use ATR (average true range) of all pairs you trade to determine- entry, stops and targets
8) If day trading or scalping (under 50 pips per trade)- look for engulfing, harami and pin bar set ups at key psychological price levels to set news trades up.
9) Keep your charts as naked or clear of indicators as possible, more clutter on charts in Forex trading is actually a bad thing. Keep trading simple!!!
10) Finally, no place for both emotions and greed in Forex trading- take your little piece of pip pie (profit) and move on to next trade.
Always remember in Forex trading and Life the following: Yesterday is history, today is a present and tomorrow is a gift!!!

Risk Management: the Beauty and the Main Principles of itHey, magicians, hope you are all doing great and enjoying the holiday season! After receiving multiple requests from you, we are back with another Educational Post and the topic is the following: Risk Management and its Principles.
As we have already discussed in some of the previous educational posts, Risk Management, alongside with other componenets, is one of the most important elements that need to be followed in the world of Trading. If one wants to be successful and profitable in this journey, obeying the fundamentals of Risk Management is a MUST.
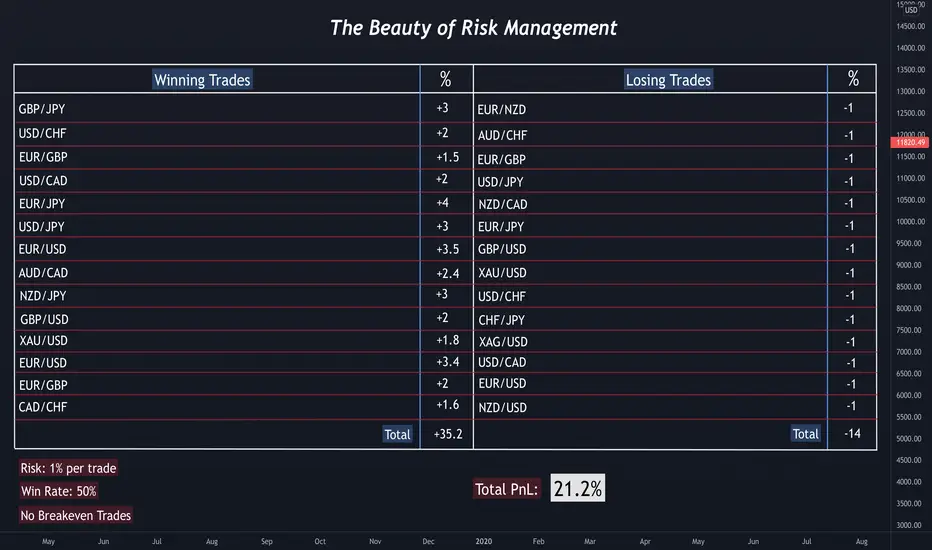
We have created a visual illustration which will explain how Risk Management really functions, and how one can be successful by implementing it in a correct way. In order to better understand the table, let us make the following assumptions:
-We are journaling our last 28 trades
-We have risked 1% on each transaction (trade)
-Our win rate is only 50%
-We do not have any BREAKEVEN trades, meaning we have left all our positions run open till TP/SL
As we can notice from the graphical illustration, most of the trades have different Risk-To-Reward ratios (for example: 1:3, 1:2, 1:1.8 etc.). With only 50% win rate, our Winning Trades will make us a nice +35.2% return, while the losing trades will set us back by -14%. If we do quick maths, we will see that the total return from our last 28 trades will constitute 21.2%!
There is no "Holy Grail" in trading, but following the principles of Risk Management can lead one to the door of consistency and profitability. Of course, Risk Management is not the only element, as psychology, patience, mindset, and some other factors should be considered and mastered as well.
We will be looking forward to covering other psychological aspects of trading in the next few educational posts! Until then, stay safe and happy, and if you have any requests or proposals, feel free to let us know in the comment section below!
Investroy would like to wish you all a Merry Christmas and a happy upcoming New Year!
Risk Management Basics | Retest Trading 💡
Hey traders,
Being breakout traders we have two options for trade entries:
when the breakout is confirmed we can either open a trading position aggressively once the candle closes above/below the structure or we can be conservative and wait for a retest of the broken structure first.
What is peculiar about the second option is the fact that the majority of pro traders prefer the retest entries. In this article, we will discuss the pros and cons of retest trading.
✔️First, let's discuss whether the retest is guaranteed. NO. How often do we see that? Around 50-55% of the time. Does it mean that 45-50% of breakout trades will be missed? YES.
The main disadvantage of retest trading is that a lot of trading opportunities will be missed. Occasionally the breakout triggers a strong market rally not letting the price return back to the broken structure.
So what is the point to wait for a retest then? Why let the market go without us in case if there is no retest?
✔️Most of the time the breakout candle closes quite far from a broken level. Opening the trading position once the candle closes and setting a stop loss below/above the broken structure, one can get a very big stop loss. Such a big stop that its pip value exceeds or equals the potential return.
🖼️In the picture, I drew a classic channel breakout trade.
The aggressive trader opened a long position as the candle closed above the channel's resistance.
His stop loss is lying below the lower low of the channel.
Analyzing his risk to reward ratio, we can see that his reward equals his risk.
On the right side is the position of the conservative trader.
His stop loss in lying on the same level.
However, instead of opening a trading position on a breakout candle, he decided to wait for a retest of the broken resistance of the channel. Just a slight adjustment of his entry-level gives him a completely different risk to reward ratio.
❗️Patience pays in trading. Missing some trades a retest trader will outperform the aggressive trader in the long run.
Trading is about weighting your potential gains & losses. Paying commissions and swaps for every trade, it is much better for us to trade less but pick the setups that give us a decent potential reward.
What type of trading do you prefer?
❤️Please, support this idea with like and comment!❤️

3 Things I Wish I Was Told Before Becoming A TraderTrader Jamal…
Hey, Finn—What you doing here… Are you here to wind me up?
No, Jam! Shucks—Just heard you’re rich now. Trading stole our red-collar boy. How has it being though?
Tough!… I won’t even lie to you man. It’s being real tough. I even told my story here to people. You know what they said, “I told you so”.
I mean all I wanted was “financial freedom”. Pfft—I don’t even know what I was thinking. I’m broke man! Everything I’ve done has really messed me up, Finn.
I’ve lost close to $70,000 in total. Mistakes, hesitations, personality problems, and fear. I think… I might just quit—Maybe trading isn’t for me man… Came to get some food. We’ll talk later Finn—Bye!
“As a trader, the key is to learn more about yourself”… Huh! What do you mean sir?—Are you talking to me?
Yes, Forgive me son—I overheard your complaints to your friend. 43 years ago—I was exactly like you son. If I may ask, how long have you been trading?
Umm, 2 years sir. It really hasn’t being that long.
Then why are you complaining? … I’ve been in the game for 43 years and I didn’t achieve consistency—until after 10 years of trials and lots of errors. So, don’t give up yet!
Erg! sir… —I just don’t know what I’ve been doing wrong. I can’t tell.
The Old Trader tale
Everything I’ve done has been a total fail. You know, I went to school of candles Pretoria—Nothing has happened, so far. Tell me sir, what else should I do?
All right Jamon… … It’s Jamal sir
Jamal, can I tell you my story… I’ll appreciate that sir.
November 3, 1850, I became a trader—A friend introduced me to trading, when I was at my lowest. A short story…
What do you mean sir? I don’t understand… I’m going to let you in—on my secret. But, you have to make sure, you’re patient enough to listen.
On January 5, 1849 I graduated with a first class honors in Business and Finance. It was the greatest day for me—Cos’ I could finally become the Businessman/Banker I’ve always wanted to be. I thought to myself, “Isn’t this great?”
So I started job hunting, I focused more on the banking sector… I searched and foraged around Beverly hills but—It was total disappointment. Until, I finally got it.
Hey! guess which bank came through—It’s The First Republic Bank. They took me in. Good pay and all; it was my dream job.
I mean you must be asking, “why quit and become a trader?”
Simple! it wasn’t the life I pictured. I know I wanted to be in the financial sector—Wanted that classy business guy life—But, the idea of sitting in a spot to make money… wasn’t what I imagined. Two words, “It’s Boring”!
Why Quit Your Job Trader
The questions I asked myself was, “Is this where you really see yourself in 5 years?”… That was the only bank that offered me a great job—I knew that per fas et nefas, I am definitely going to have my financial freedom.
So, I started my search again. This time I was specific—No bosses, anywhere in the world and My own time. You should know what that means, right Jamal?
Oh! Yes sir I do… Just curious to how trading met you…
Sir, you graduated with a first class honors in finance yet, you spent 10 years in becoming a consistent trader What happened?
Don’t worry I’m getting there. Most traders don’t know this yet but, “It’s really mind over market; EQ over IQ” here. You’ll think that, because I came out with such good grades—I’ll be a market wiz in a short period.
That’s not how trading works!
You know, my friend Victor once said, “The key to trading success is emotional discipline. If intelligence were the key, there would be a lot more people making money trading… Ergo—the single most important reason that people lose money in the trading is because—they become too emotional, in denial, and cannot control these emotions”.
That’s why Jamal, Trading is really not about your IQ; It’s more or less about you as a person. Your mindset, beliefs, character—everything about you would be tested. As a trader , you are really playing against yourself. It’s you versus you!
I Discovered The Art Of Trading!
Before I continue my story, I’ll ask you a question—Do you understand your personality?
Shucks, well… Yes! I do. But, the change hasn’t been easy sir. I realized that my character flaws gets in the way of my progress. Exactly! Jamal…
Back to my story. I wasn’t happy with my job; even though it felt like it was my dream job. After working there for a year and reflecting—I realized, “No! man this isn’t what I expected”. It’s a bore!
Most people are like you Jamal. They’d ask, “Why spend 10 years in figuring out trading, if you graduated with a—first class Honors”. It’s because… trading is more than IQ! In trading, the intelligent also encounter problems, if not more—in trading. You know… You and I.
That’s why I used victor’s quotes.
Now, I was looking for my dream job, which was, making money whilst at the comfort of my home. My degree couldn’t give me that. I needed to have a skill. But, I’ll let you on a secret Jamal–-“A degree without skill is just nothing more than, a unit of angle measurements”.
Something happened—on the 15 September, 1850, there was a seminar. The bank made sure every of its staff were in attendance—Most grumbled, some happy, others indifferent. I actually wanted to reject the offer… until I saw the topic of the seminar. It read, “Your missing key to financial freedom”.
Of course I went. That’s what I wanted! Ugh… That seminar alone changed my view of the finance industry and I discovered the art of trading. A beautiful art I must say; The best!
Immediately, I saw a reflection, I imagined what it would feel like—If I became a trader.
Self-Reflection
The moderator said something, he said, “What kind of life do you want to live? A 9-5 till your 60 or an anytime you want till your 30”. You see, I pondered on that quote for the longest time. I don’t think I’ve ever had to think so hard. Anyway, I made a choice!
I have to know how to trade!
That’s what I said to myself. But, I didn’t quit my job just yet. I needed that job at least, till—I was great at the art of trading. Damn! I probably shouldn’t have quit my job right?
Heh! Listen, what’s already done shouldn’t be spoken about. You made a decision that was best for you at that time. Jamal you’re still young and there’s still time to make better decisions. As a trader, allow yourself make mistakes; if not, you’ll avoid them only to meet them at the finish line.
Do you understand!… Yes sir.
When I told myself that, I started looking. I searched for articles, books and listened to colleagues. We had no YouTube then—all we had were newspapers and the lying broadcast. But, I didn’t give up!
Working in the bank kind of gave me an upper hand—because I had access to financial data. Jimmy was our foreign exchange (forex) wiz. I needed Jimmy to be my friend.
I had to become a trader!
Becoming a trader, gave room to a lot of challenges—I encountered… The first was putting up with old Jimmy’s attitude. Jimmy wasn’t a friendly person but, Jimmy had what I needed. Did that stop me? No!
I had a goal. “I had to become a Trader!”… Old Jimmy wasn’t going to be a hindrance to that plan.
Secondly, I had to be patient because I knew Old Jimmy might say—The words I dreaded the most, “No!”. Which he did—severally!
Each time I got home, I’d tick my trading boxes. Each time, I realized how far I was—from becoming this trader. But, I stayed.
Months passed, days tripled and I finally got a demo account.
Trader Jimmy, Here—I Come…
Jimmy insisted I start with the demo. His words, “You need to get familiar with the system”. So, I started practicing what I’ve learnt and I was doing surprisingly well.
Also started making paper trading cash—I became obsessed with the reality that—it could all be mine. I assumed, “Maybe that’s all I need from learning”.
So, I quit!
Left the bank, told my colleagues, “bye”… I was out!
Hmm… thought to myself, “Hey, Trader …here I come”.
Months passed and I finally invested 50% of my salary into—a live account. I was ready or—I thought I was.
The first few trades were great; an account of $50,000 tripled. “Woah! I can’t believe that worked—what have I been doing in the bank since?”, “Could have been earning twice my salary in a day”, I mulled.
It’s a Friday morning. Hurrah! NFP… “the best time to get the bag”, that’s the phrase Jimmy would use.
Wham! I opened several positions and… Sighs, it ate my equity. Damn! it’s all gone. As if that wasn’t enough—I added more money. Told myself, “You can’t give up now” This is all you have!
In my bank account, $70,000 was left. Hmm… “well, it’s all or nothing” I exclaimed. Dialed the broker and added $30,000… left $40,000 for emergency reasons. Cos’ if I could lose $50,000—then it’s possible to lose more of that. Wasn’t going to be foolish twice!
But, it was actually worse…
For 9 horrible years of my life… I couldn’t figure it out. This Trader became miserable, broke and hurt.
Until, I realized…
One thing the demo does for the trader is, it reveals to you all you can achieve if—you didn’t have emotions. But, you’re human!
We all have emotions—that’s actually a problem. After my years of failing and picking myself up from the fence, I understood the market was trying to teach me something.
Jamal, I’m going to share with you 3 lessons I learnt from my Chi-Fu called, “market”. These lessons all come with sacrifices… It should help you pick up your art and become its master. The first…
As A Trader Become A Great Loser
Jamal, can you think of a trader who actually boasted about his losses?
Most people don’t like to show the black eye and swollen lips—they show you the beauty marks and glittering veneers. Obsessions over something makes you have less of it. To be a good winner; you have to be a good loser.
Huh! what does that mean sir?
You have to come to terms with losing. In-fact, losing should be an opportunity for you to learn something new about—yourself and the markets. Learn to appreciate your losses.
Why sir? It hurts! That’s my hard-earned money… Jamal cries.
Exactly, Jamal! It should. Life is all about lessons and so is the market. Have you ever received something without giving?
Uh… Not that I can remember.
Exactly! It’s because you haven’t. In everything, there’s a relationship. Now—this relationship can either be mutualistic or parasitic. Trading is only parasitic if the lessons aren’t fully digested.
Listen, If I gave you $500 and you misplaced it; you became careless—It got missing. What will you do?
Err, I probably look for it Sir.
“What if you don’t find it, remember it’s not your money”, The man responds.
“I’ll probably cry Sir. How else would I replace it”, Jamal interjects.
Okay great, You know that “crying” doesn’t bring the money back right? That’s exactly what happens in the market. We fail to learn from our mistakes, we let our emotions take over, instead of listening to the actual lesson.
The next time someone gives you $500—I know for a fact—Jamal, that you’ll be more careful. You know why? Because there’s being a loss before. Now, you either learn to protect it or become careless again.
What will you choose?
I’ll learn to protect it Sir.
Good! That’s the first lesson. In the market however, you might keep losing this $500—Each time there’s a loss, there’s a lesson. Right?
Which brings me to my next lesson. It’s a question first; then after the question—comes the lesson. Are you ready for it Jamal?
Heh, yes sir!
Haha! Nice, you want to take down notes. Interesting…
Will You Allow The Market Bully You?
Have you ever been bullied in life? Either a childhood school bully or a boss… “Oh, my God—Yes sir!”,
Heh!… okay, That was a fast response—seems you can’t forget that one. It was bad huh?
Bad!
Anyway, bullies’ have power—only when they feel superior. It’s just like a Cat and Mice, the cat seems very powerful when ever he sees a mice—Cos’ he’s bigger. But, most times—The mice is smaller and wiser. A mice that isn’t wise gets trampled upon.
So, If that school bully comes now and tries to bully you, will you allow it?… Of course not. I’m probably a lot bigger now and It ain’t possible anymore.
Exactly, Jamal. You got better!
If you’re that kid that got bullied in school, You know it’s no different from the market. The market is that childhood bully, that boss at work—but this time around, I want you to see the market as “Jimmy”. Yeah, he would bully you but—you should allow him: to gain from him.
Try to come to terms with his agreement. Now, you have to be friends with this bully…
What!… Why, I mean how do you get a bully to be your friend?
“You don’t force the bully to be your friend Jamal, he doesn’t have to like you—but you have to like him.”, The man responds.
The reason you allow this bully (market) to get to you—is because, you get to gain from him (the bully). The bully is a tough nut to crack but, knowing that each pain becomes an experience is the goal. Have you ever lost something valuable before Jamal.
“Uh… Yeah” Jamal stutters, while answering.
Okay, great—how did you feel? Not a pleasant emotion, right?… but, what happens—you learn from the experience. Two choices: you either decide to move on or avoid it right?
What do you do Jamal?
“Run away—I guess. Cos’ I really don’t want to feel that pain again. It’s horrible so why try to experience it twice?”, Says Jamal.
Trading should a pleasurable pain—like a woman who just lost her virginity. A bittersweet experience…
I thought you will say that. Listen Jamal—the bully is going to keep hurting you, as long as, you still in that school. Likewise, you’ll probably encounter more losses—as long as, you decide trading is what you want to do.
Listen, in life change or experiences just don’t happen—they only happen when they become a necessity.
You decide you want to change; when you know that beating becomes unbearable. It’s not something you run from.
Don’t be a wuss Jamal!
Face it!…You’ll need to actually face it.
Most traders are wimps—looking for the nearest rat… because, the elephant becomes too big for them to handle. So, are you a wimp or are you valorous? The more you learn from the experience—the better you become.
But, the more bruises..
Until, you become so good that—you no longer fear the bully and you might even learn to face this bully. Do you get it? I’ll give you some time to digest that before the last and final lesson.
Try to know the other side
“I’m ready sir!”
Great! A wise man once said, “Certainty is the only illusion a trader has.” Do you know what that means? … I’ll take that as a “no”. Anyway, have you ever seen a coin before? Heh—who am I kidding, you probably have some in you pockets now.
So, a little exercise—shall we?
Now, look at the front of the coin you’re holding—carefully study it, Now—tell me what’s at the back of it? Eh… I have no idea sir—I’ll have to flip it.
Exactly, most traders don’t actually flip this coin—you see. They don’t even want to know what’s on the other side. You know why? It’s because they love their comfort zone. These are the wuss traders; the ones who run from the bullies.
We call them, “routine traders”.
There are always two sides to a coin but most times, until you flip it… you’ll have no idea what the other side looks like. I won’t even lie—we always like the safe route to things. If something is safe for you, you might just tell yourself, “uh, well—I like it here. Why stress to know what’s on the other side?”. But, in trading—there’s no safe route.
Don’t hold strong opinions about things you don’t truly understand.
You have got to take that risk. No shorts to this cut, Jamal. There are two sides to a trader: the one who runs from the bullies—because the pain become unbearable and the ones who face the pain—knowing that the end to that tunnel is great.
The question is, what side are you on?
Most traders quit because they prefer the latter—“I like it here tommy, don’t pull me out yet—I can’t face the world”, They’ll say.
My final lesson is; have an open mind. The strong willed—don’t always will lots of bucks here. Try not to have a strong opinion in your trading decision. Be the trader who adapts to the changes of the market—not the one controlled by it. Remember, be the lame kid who takes the blow.
Painful but, worth it.
Now You Know… What Next?
You know Jamal—I tell people, “those who have strong opinions about the markets are either knowledge-able or totally ignorant”. The only strong opinion you should have about trading, Jamal, is—you shouldn’t be married to an opinion. A dangerous thing about trading is that—it isn’t really a game for spectators. If you ask me, the most dangerous sport out there is—trading.
Traders are also the most dangerous people on planet… where-ever you breathe right now.
You know why?
These guys take crazy risk, without any form of medication in place. The number of heart breaks a trader has in a day/week will be enough to make him never believe in love. Haha! Nah trading is actually fun but—don’t let anyone deceive you into thinking, it’s all roses and sunshines. It’s really not!
It’s a mental game—about emotions. Where the emotional ones get kicked out; The heartless/ruthless ones always make it far. Simple!, they really “don’t care”.
My friend Scott will say, “i’m suspicious of people who have strong opinions on complicated stuffs”. Heh! people who sugar-coat things—they don’t tell you what you should hear. They’re also the ones who post for the media sake.
Now most traders try so hard to understand the market that—they actually fail to make money. Don’t lose yourself in trying to beat the market… You can’t!
She’s way smarter and richer. You’re a pauper!
Stick to management cos’, this one’s a thief. She’ll dig you of all your diamonds if you think you can beat her. Probably the smartest woman out there! Anyway, Jamal, I think with this few lessons of mine—you should never, ever, think you’re the worst trader on earth. The fact that you even lost means you tried.
Well, it’s a good thing you met me. Hey! i’m Trader Steve—the worst trader on earth.

HOW NOT TO LOSS OUR DIGITAL ASSETS PART twoHow to make a suitable portfolio?
First of all, it should be noted that people who do not look at this market as a job and have come only for profit, do not involve more than 10 to 20% of their total capital in this market. In case of loss, their sentiment will not destroy their entire account and they will not have stress in dealing with different market conditions.
We must first divide digital assets into safe assets and low safety assets. Safety is considered here in terms of value preservation.
In Crypto, I consider BTC and ETH as safe assets. But certainly BTC's share of the portfolio is larger than ETH.
Now let's move on to how to manage a portfolio:
1. Out of 100% of our total account, we should allocate about 40 to 50% to safe assets. Because in the event of a market downturn, these assets perform better and retain their value better. Of course, you should buy these assets in the right place, not in any market conditions. Not on top.
2. You can allocate about 10 to 15% of your account to major Altcoins. Major Altcoins are those with a market cap of $ 2 billion to $ 3 billion. You can roughly count the top 50 coins in the coinmarketcup.com
3.You can allocate about 10% of your account to middle Altcoins. middle Altcoins are those with a market cap of $ 300 million to $ 2 billion.
4.You can allocate about 10% of your account to minor Altcoins. minor Altcoins are those with a market cap blow of $ 300 million. These coins have a high risk but also a higher probability of profit.
5.We keep about 10 to 20% of the account tether, to buy in more suitable places or use it for short-term trade.
Of course, in some situations, with changes in dominance and other things in mind, changes can be made to these percentages to work better, but this can be a major base in portfolio management.
I hope you have a good year. Merry Christmas

HOW NOT TO LOSS OUR DIGITAL ASSETS PART ONEThis is a tutorial post and is more suitable for investors and we are not talking about short-term traders.
Friends, the crypto market is not like the Forex market and the stock market. You have to work hard to keep digital assets in this
market because it is a wild market. Do not compare this market with other markets because this market is very volatile and shallow.
There are big players in this market. In this market, fluctuations of 30% are normal.
The crypto market gives you Fiat money, but it takes away your digital assets, and if you do not manage your portfolio, you lose your bitcoins.If you measure your assets based on bitcoins, with the manipulations you do, with the BUY in top and sales in bottom, your bitcoins will be at least halved, maybe $ 5X profit, but in the end you see your BTC are halved and you no longer know what to do.
BTC never gives you the opportunity to buy in the right place. It breaks the support you are looking for or it does not reach you and leaves you and you can not buy it.Try to buy bitcoin by accumulation and distribution method, select the appropriate range to buy and enter in several steps, and do not wait for the top to sell and sell in several steps.
Technical and fundamental analysis are good, but the most important part of investing is capital management, portfolio management and emotion management.
Try to understand the nature of this market and be patient. Patience is very important in this market.
In the next post, I will provide you with a suitable portfolio management method. I hope it is useful for you

8 tips to keep you sharp over the weekend!Tomorrow is Christmas eve, the general markets will be closed, of course crypto will still be rocking and rolling, but the CFD markets will be shut. In day trading it is very easy to get rusty, a few days will do the trick, so with a 3 day weekend approaching we wanted to use this time to help you stay on track so you remain "hot" for the last trading week of 2021!
For those of you who will be celebrating Christmas, you will be busy Friday and Saturday, but we're sure you can find a cheeky hour on Sunday to work on yourself, since the weekend is the perfect time to grind, and do things such as reviewing your trades, seeing which assets moved the most and why (so you can take advantage of these situations in the future).
Today's blog topic will be guidance on what you could work on this weekend to keep yourself hot and not get rusty!
"DO OR DO NOT, THERE IS NO TRY." - YODA
1. THINK HOW CAN YOU IMPROVE YOUR PATIENCE – Having patience as a day trader will help in many ways, one of them being better entries, since entries are directly connected to our PnL it is then a vital skill to acquire, think what you could do to become a more patient trader and create a plan for the new week and apply it on your first opportunity!
2. REVIEW THE MAIN MOVERS THIS WEEK/MONTH – Every successful person, whatever industry it may-be practices a lot, the best way we trades get to practice is to review the charts and see what you could have done to profit in the new week by learning what you missed the week before
3. REVIEW YOUR RULES (PROCESS / ENTRY / EXIT / WATCHLIST) – Always helpful to read over and reevaluate your trading rules, it is a very underrate process, and because the majority of traders do not review their rules and processes they generally do not know what they are nor do they apply them!
4. VISUALIZE SUCCESS AND CHALLENGES – Visualize yourself making good/great trades. see yourself going through different scenarios and achieving the profits you seek. From seeing the perfect setup to executing the trade to exiting the trade, every aspect of trading, see it and feel it. Then also review the challenges you face as a trader, I'm sure you can think of dozens of them!
5. THINK HOW CAN YOU MAKE ONE A+ TRADE AT A TIME - Work on your entry process and criteria, know what the BEST TRADES look like, write it up! So when they show up you can execute with a larger size and maybe bank a much bigger profit than normally.
6. TALK TO EXPERIENCED TRADERS – It is very helpful to get ideas and see what these traders are doing, there is always something for you to learn, even when you become a millionaire trader, you'll still have so much to learn!
7. HOW CAN YOU IMPROVE THE RETETION OF PROFITS – If you are up on the day, set a tighter stop loss to keep your profits, that could always be a solid idea right? There are many ways to retain profits, such as lowering your size after a strong winning streak in a day... but its also your job to think about how you could do this better!
8. WORK ON YOUR PREPARATION – Preparation is Key for success! If you fail to prepare, you prepare to fail! We prepare for a solid hour before we start to trade, there is value in this... so this weekend create your "preparation process" and put it to work!
Ok we are done! Thanks for reading, but before we let you go we have a small request! If you come up with any good ideas that work for you, or have them already, please share them with us we'd love to learn from you too!
Merry Christmas and all the best!

Breakout Trading | 7 Steps to Follow 📝
Hey traders,
Breakout trading is one of the most popular trading strategies.
Being quite simple in theory, it remains quite complex and complicated in practice.
In this post, we will discuss 7 steps every breakout trader must follow.
💬And just in brief about a breakout trading itself:
this method aims to spot a key level (it might be horizontal support/resistance or a trend line) and then to trade its occasional breakout assuming that it will trigger an impulsive move.
1️⃣No surprise, the first task of a breakout trader is the identification of key levels. Preferably these levels should be spotted on weekly/daily time frames.
2️⃣Once key levels are spotted, a breakout trader should patiently wait for the test of one of those. His goal is to wait for a breakout.
In that step, many traders fail. The problem is that in order to confirm the breakout, one should have strict & reliable rules to follow. The rules that describe a confirmed breakout.
*I apply the following rule: the breakout of a level will be considered to be confirmed once the candle closes above/below the structure on the highest time frame where the structure is recognizable.
3️⃣Once the breakout is confirmed, the next step is to wait for a retest of a broken level. Why retest? Simply because a retest gives a better risk to reward ratio for the trade. And even though there is no guarantee that the price will retest the broken level and because of that some trading opportunities will be missed, in the long run, retest trading produces higher gains.
4️⃣Opening a trade on a retest one should know the exact target levels. The levels where the profits will be taken. Again, newbies traders make a lot of mistakes on that step. Remember that your targets must be realistic, they must be based on closest strong structure levels, not on your desired returns.
5️⃣Also, a breakout trader should set a stop loss. And again, a stop-loss level must be safe, it must be set at least below/above a previous minor structure to protect you from stop-hunting.
Stop-loss reflects the point where the trader becomes wrong in his predictions and where the trading setup becomes invalid.
6️⃣Once the trading position is opened and stop-loss & take-profit are set, one should patiently wait. There is no guarantee that the price will start falling/growing sharply after the breakout. The market may start coiling for a quite long period of time before it starts acting.
Breakout trader must be patient not allowing his emotions to intervene.
7️⃣Lastly, one should remember that his exit points are stop-loss/take-profit levels. Stop-loss adjustment in case of a position drawdown, preliminary profit-taking, and target extension are your worst enemies. Be disciplined, don't be greedy, and keep your emotions in check.
Of course, this 7-steps trading plan is not sufficient enough for profitable breakout trading. There are so many nuances on each step of the plan to consider.
However, let this plan be your initial guideline: learn & follow that and with time, keep elaborating its rules until you become a consistently profitable trader.
Are you a breakout trader?
❤️Please, support this idea with like and comment!❤️

Why Do Most Traders Lose Money?Hi Traders, welcome back to another workshop. In today's workshop, I'll be sharing some personal perspective on why do most short-term traders lose money. I've been trading for over 5 years, and yet I've seen these repeated traits happen in most losing traders.
1. Sense of Urgency
- Most traders approach the market with an expectation of low risk high return. Just ask yourself, who doesn't want to achieve highest possible return in the shortest period of time? Everyone wants to make money, but the main thing is the process.
- How do you extract money consistently from the markets? How do you differentiate yourself from the 95% of the losing traders?
2. Risk Management
- Risk Management is one of the key element to make sure you stay in the business as long as you intend.
- Without a proper Risk Management, there's no way you can come out the markets long-term being profitable.
- It also directly reflect your patience level, patient traders always have a fixed risk per trade to pre-define their risk, simply because they understand that the outcome of any single trade is random. The eagerness to get-rich-quick will often blind yourself from protecting your capital.
3. Trading without an Edge
- Often new traders neglect the importance of having an Edge. An Edge simply means you are being confidence in a sense that you'd always come out profitable in the long-term.
The outcome of any single trade is completely random, so stop focusing on the short-term result, and never switch your trading system purposelessly.
4. Mindset
- Above all comes down to this one final key element, which is the proper mindset.
- Always think in terms of probability and possibility. Having a realistic mindset motivates you to put in the necessary hardwork to achieve your goals, not by day dreaming.
Let me know your thoughts in the comments below.
If you enjoy the content, make sure you click the like button and share it with someone who need to read this.

Why Traders Suffer From Analysis Paralysis In TradingAnalysis-Paralysis In Trading This is an article I’ve been avoiding. Maybe it’s cos’ I’m guilty of it.
You know, A bunch of knowledge makes—jack cross the rubicon.
It’s December 1, 1990. ugh… what a glorious day! I mean—I’m grateful I survived. Are you? (rhetorically—cos’ I talk to myself a lot). Anyway, I finally get to attend “School of Candles” in Pretoria.
South Africa is a great country but, only because they have one of the best—Trading schools in the world. Hashtag “respectfully” .
I mean—Finally! Heh… I’m here. The Oakland… miserable red-collar guy is here. Can you believe it? Considering all the blown accounts and failed trades—I finally left the country to… South Africa.
Pfft… Don’t mind my excitement—at least—I’m not sitting on my a*s reading this article because I have a problem. You are!
i’m pretty sure you haven’t travelled out yet and it’s cos’ you keep losing. You’re a loser! At least… someone had to tell you.
Don’t worry that makes two of us. Yeah—you and uh… you!
Ugh… duh… I know you are not here for my—school of candles story. You’re here cos—you are stuck!
Am I right?
Anyway, I’ll help I promise. But, you have to promise me that I won’t be wasting my time. Do you promise? Okay—Great.
So…
Analysis Paralysis In Trading (What Does That Even Mean?)
Look at them… so peaceful. Quick question—Have you ever really stopped to watch kids play? The laughter, glee, ambience, passion—so peaceful; so serene!
These guys literally have nothing to worry about. Don’t you miss that?
When last did you laugh? No… like actually laugh. These days—we have to watch a funny illiterate online to… crack up. How miserable can one’s life be?
So sad; so depressing and why’s that?
I don’t know about you—but, I miss those days. Nothing to worry about.
You’re probably wondering, “What’s he on about?”… I just had to remind you of what your life (hopefully you’re still breathing)… is supposed to feel like. Before… I tell you how it actually feels like. That’s why you’re here right.
Shucks. Analysis paralysis—wonder who comes up with these names. In a lame man’s term, it’s basically being paralyzed (not literally) from over-thinking. over-researching and over-analyzing…
Why do we do these things; why do we even do anything. Imagine the thought of—mentally paralyzing yourself… Do you love yourself at all? Of course not—Humans (you reading this now) think of the possible worst for—every situation.
Imagine… You go out and a complete stranger gives you money, from nowhere; out of the blue. What’s the first thing that comes to your mind? Be honest, Don’t lie.
That’s what I thought.
Anyway, Being completely mind-paralyzed is bad. I mean … have you seen—how they have to literally drive paralyzed people everywhere… They become furnitures (not trying to be insensitive); they really can’t do anything… on their own.
You’ll end up—A furniture trader!
Analysis Paralysis In Trading (How Can You Tell?)
In school (school of candles), I attended every class. Wyckoff 101, Fibonacci 203 (borrowed course), Way of the candles, Price-action 105, Order blocks and Market structures 103, Supply and Demand, Indicators not manipulators… Weird ones! I took all.
Trust me —I was a diligent student. But, I had no direction.
I practically learned everything and anything. I mean—I wanted to be a great trader (don’t we all).
The next class (Final year) required… Mastery. I realized that—sticking to one thing was a problem. Oh! No, I can’t choose. I literally attended all classes—just to find out what was best for me—even after taking these classes… in my first year.
Hello Jane, I know this is kind of awkward… But, what’s your major?
Uh… Order blocks.
Imagine! I couldn’t even come up with something. What the H-E-L-L do you want Jamal? You’re just going round in circles.
I couldn’t choose. Wanted to take action but, how could I? No one gave me the memo. I don’t even know what making decisions feels like. “Making Decisions” suddenly sounds like the strangest word in—the dictionary.
So, tell me have you been in this position. All you keep doing is learning—anything; everything. But, no actions!
Two ways you can tell:
Can’t seem to make a decision.
Always looking for a better solution—without actions!
For analysis paralysis in trading It’s not something you can cheat. As a trader, You can’t go over or under it—Dealing with it is… the only solution.
You keep delaying actions—whilst over-analyzing every situation. For this trader—you keep imaging downsides… Always the negatives; never positives. Imagine taking a trade—but, you’ve already imagined—300 scenarios of your plan going badly.
Pfft… heh—who does that? Uh! you. You’re literally mentally paralyzed. What other options do you have than over-thinking everything.
Are You Asking The Right Questions?
Ta-ta… I envy them so much. Anyway, You learn to be in the comfort zone because…
Why stress your brain till it’s paralyzed. Your brain is literally “yours truly”—It would always try to keep your safe. It will protect you, which is good. But, you become safe and unsuccessful.
In trading, which do you prefer?
Actually making a decision irrespective of the outcome or… staying out and avoiding everything.
I mean if we’re being honest—the second option looks safe and comfortable. Will you choose that though? Remember you want to be rich; you want financial freedom.
Even if you go through hell—do it without hesitations.
Yup—That quote is a reference to the previous sentence. Eh… your lack of decision making will only make you—miss out on a million market opportunities. So, are you asking the right questions?
When you literally ask yourself the right questions… It gives room for a clearer thought process and faster decision-making.
Honestly though—Let’s blame google.
An increase in options; an increase in choice. The fear of making the wrong choice arises. Then you become mentally paralyzed.
Most traders today are stuck.
I remember meeting a guy (Joe)—In one of my trading communities—in school. This guy found it hard to make a decision. Heh… So he buys and sells at the same time.
Analysis paralysis in trading can make you a fan of gambling. But, there’s a solution…
You can start by answering the right questions. What are the right questions?
Is it worth the risk?
Will it matter in 5 minutes?
What was my first choice?
Can you answer these questions? Make it a habit to answer these questions before—you take a trade. Not just trading—anything at all… Train that brain of yours.
Is It Worth The Risk?
You know some-times the best way to eliminate choices is to—know the risk attached to each choice. Imagine having a $50 account (your only money) and trying to take a trade. You’ll probably over-think every thing because—you just can’t lose that money. I mean… Heh—that’s all you have right?
So, the first question should be… “If I take this trade, is it worth the risk”. Note that… you might lose—but, the keyword here is “risk”. How much are you willing to let go of?… That should be the first thought.
Try this exercise and you have to be truthful—always!… If I was given $50 and I was told to give someone $5 (out of your $50)… Would I be okay with that?
If you will, then you can decide to risk 10% of that account—knowing that you won’t feel bad if you lose.
Ergo, You’ve just made a decision—because you eliminated your options.
I mean losing 10% of $50 is better than losing all.
Now what next? you need to eliminate all trades that will make you lose more than 10%. See, No mulling— just progress.
Note that… Not all trades are negatives. But, we should always consider the risk.
Will It Matter In 5 Minutes?
Now you know the risk you’re willing to take, the next question is—Will it matter in 5 minutes?
Ever heard of the “5 by 5 rule”?
Well, the 5 by 5 rule states that—if you come across an issue take a moment to think—whether or not it will matter in 5 years. If it won’t, don’t spend more than 5 minutes stressing out about it.
Forget the “5 years”—My own 5 by 5 rules is… don’t waste 5 seconds pondering over it, if it won’t matter in 5 minutes. Mine works right?
I mean… 5 years is a pretty long period you know. By the way, the market waits for no man. The fact of the matter is, there are some problems that do not need your full attention.
Why stress over some money you’re okay losing. If after 5 seconds you’re cool with it then—go ahead!
Do me a favor. Let’s practice… Um—can you remember what you just did 5 seconds ago? If you can, it matters; If you can’t, “It’s irrelevant and doesn’t matter. There, fixed right!
What Was My First Choice?
The human mind is like a sick computer virus.
It’s basically, randomly, just processing relevant and irrelevant informations and thoughts. You tend to have all these choices, thoughts and feelings all mixed up—especially during pressure. I was listening to Roger Khoury the other day and he said, “When driving a car in a—calm state—you’re basically just following the rules of the road right? But, what happens when you’re late for a meeting—You find yourself breaking all these rules.”
Similarly… same applies to the market. You don’t have time; you’re supposed to make a decision—If not, the market leaves you.
Then if you’re like me that attended all classes in—Pretoria, you probably don’t have a particular strategy. Different options; different opinions. What happens?
You become paralyzed!
All this can be avoided if you remember your first choice. Many traders fail to understand that our gut feelings, our instincts—matter.
Where do instincts come from?
In as much as the brain behaves sick sometimes—It also stores useful informations… knowingly or unknowingly. These useful informations are usually processed when needed.
Do you ever know something and wonder—how you know that thing?
It’s cos’ you probably already came across that stuff but, you ignored it. Cos’—It didn’t matter. But, look who wasn’t ignorant “your brain” yeah, remember… “Yours truly” loves you.
Those first choices… are thought of for a reason. So, make them your last resort—always!
Havoc Of Analysis Paralysis In Trading
Hey guys, my name is Jamal and I’m a victim of Analysis Paralysis in trading … “Hey Jamal”…
Sounds familiar. Yeah, group home.
My encounter with Analysis Paralysis in trading wasn’t a great one. There were consequences. Each with its own baggage.
After I narrowly graduated from the School of Candles, Pretoria. I mean I’ve learnt everything—I was ready for the market.
On Tuesday, May 3, 1994, I deposited $50,000 to my trading account. As a graduate of School of Candles—what was the next thing? To get into the real world of trading .
A nasty encounter in the market occurred. I found a GJ (gbp/jpy) trade, the daily had a bearish head and shoulder, the—4 hour, a double bottom. On my chart, I had Bollinger bands, Moving averages, Relative strength index… Name it.
Yeah —I was that confused. Didn’t know if to—buy or sell. Oh! No, a clash of interest.
My indicators… some gave me buy signals; others sell signals. Oh my God! What now? What’s the direction—Now I’m exhausted, tired, I can’t think straight!
The market decides to buy… Yeah, I guess I’ll go long now.
The sound your phone makes when you just placed a trade. Greedy old Jamal, used 2 standards for US30 on a $50,000 account. I was more than confident.
The market does it thing. What! no… no… n0—Why is there a sell taking place now? No!
The Havoc
That’s it… That was so easy I lost it all.
Everything! “What was the point of school then?” I thought. Useless! You’re so useless Jamal. You can’t get anything right.
I couldn’t make a decision… My brain said, “Pause”. I was paralyzed and I failed. Three things happened to me:
My trading performance reduced
Creativity was gone. Couldn’t decide on a strategy and all patterns became useless.
Lost my willpower. I couldn’t make a decision—too many options.
Thank you for listening! “Thanks for sharing Jamal”.
How To Overcome—Final Words
Don’t ask me what I went to a group home to do. Analysis paralysis in trading affects you mentally—It builds into a habit and you become the hesitant trader.
Do you remember him? That guy who couldn’t make decisions, that insecure coward. Yeah—that was who I became.
June 23, 1994, I was in bed. Thinking, crying, staring—”What went wrong?”, I thought. How come… I mean i’ve gone to one of the best schools, learnt everything there is to learn, and graduated with a 2:1. So, what exactly is the problem.
I discover that—I was.
“Jamal you are the problem”—I discovered 6 things. These 6 things I’m going to tell you are very important. I’m telling you because—I love you.
You shouldn’t follow my past; you shouldn’t make my mistakes. My mom’s teaching helped. Remember when she gave me the trading elements and principles…
Steps To Overcoming This Nuisance.
This is the truth; this is my truth. After a month I discovered that:
You need to trust you. No one else opinion matters in the business of trading. It’s your business—You should mind it.
Limit the amount of research (information you consume) you do. It’s called “learn and earn” for a reason—Not “Learn and continue learning”.
Talk to someone. If you think you’re stagnant, you need to pour out all those information—on someone. Teach them!
Perfection isn’t the key. Progress is!
Know your end goal always.
Notice every thoughts and emotions. If possible, write them down.
If you follow this manual, you should never have reason to be stuck or mentally paralyzed. Remember sharing is caring!
Tell someone about this article. Most traders have no idea what analysis paralysis in trading is.

The Quarters Theory (15 minute) Part 4-4If you use the 15 minute time frame for entries, exits, stop losses and targets, I would strongly suggest you use the quarters theory- BUT- it is actually the eighth theory (place these lines every 12.5 pips away from each other).
Example 15 minute chart of GbpJpy pair today:
(Place lines every 12.5 pips away from each other)- if you are scalping and or day trading. These will define your trades and structure.
150.500
150.375
150.250
150.125
150.000
149.875
149.750
What do you see about price action at these different price action line levels? Does PA go right thru them without any issues? Does price action stop and reverse? Does price action reverse at these lines? What pair are you trading- What price is on chart now? What session(s) are open now? What Time is it?
Look left on all charts and put these either quarter lines on them above 1 hour or eighth lines on time frames below one hour time frame.

The Quarters Theory (1 hour) Part 3-4The quarters theory on one hour time frame is great for both day trading and/or scalping.
Make sure you put the quarter lines every 25 pips away from each other, just find the closes whole round number and start there with adding lines on charts.
On noted GbpJpy chart the quarter lines are as follows:
150.750- yellow line
150.500- red line
150.250- yellow line
150.000- black line
149.750- yellow line
These lines help with structure of price action, what has happened before at these lines? go left
These lines help with entries, exits, stop losses, targets and risk management.

The Quarters Theory (4 hour) Part 2-4Quarters Theory example on a 4 hour chart of AudJpy:
What does chart show you?
1) Whole round numbers (black lines)- 100 pips away from next round whole number
2) Quarter numbers (yellow and red)- 25 pips away from next quarter number
These lines make it a lot easier to trade any time frame, why?
1) You can set you enter and exits at these lines on charts
2) These quarter lines give you structure and informs you where price action swings had happen before
3) These quarter lines give you a great place to set your stop losses, on 1:1 or higher risk reward setups.
4) These define your trade, so you can set your risk management via quarter lines on charts
Per attached chart you might know where I think price action will continue to today and/or tomorrow. Yes, you could do a 50 pip stop and 50 pip target on these 1:1 trades but you need a 60% or higher win rate if you only do 1:1 RR trades. But this is not hard to do if you have the knowledge. If you either day trade and/or scalp, I would strongly advise you to you tube and/or google The quarters theory and start using them to define your trades, lot size, entries, exits and targets. This will help you greatly in your trading.

The Quarters Theory (Daily) Part 1-4On example daily chart of EurAud (on this article)- what do you see related to the quarters theory? support and resistance? trading edge?
I see 100 pip round whole numbers (black lines) divided into four equal parts of 25 pips apiece (red and yellow lines)-
If you did trade with 100 pip stop losses- this would be a great way to trade either position, swing or daily charts- from whole round numbers to next whole round number.
Those would be 100 pip stop losses vs 100 pip targets or 1:1 Risk Reward setups- you would need to have a win rate of 60% or more to make a profit with this type of trading, or you could set a 100 pip stop loss and let trade run for either a couple, few or many more days and have a higher Risk Reward setup.
The quarters theory started with 1000 pip areas, like example from 1.6000 to 1.7000 would be 1000 pips, break this down into four equal parts or as follows:
1.6000- major round number-
1.6250- minor number-250 pip area
1.6500- minor half number- 250 pip area
1.6750- minor number- 250 pip area
1.7000- major round number
This can be done on any charts from monthly down to 1 minute and should be done for knowing possible entries, exits and risk reward (lot sizes)- on every trade you make. I use the quarters theory for scalping, it will give you a trading edge and control your trades within a certain structure of the market.

I Just Took a Big Proft - What Should I do?Hi Traders, welcome back to another workshop. This topic is often a big question mark within a lot of traders, wondering should they continue trading after getting a jackpot trade? When it comes to this, again, there's no right or wrong. It is all about your plan, mindset, and performance. Below I've summarized the 3 main highlights of this workshop
1. Identify whether it is a good win or bad win
- If a winning trade is within your trading plan, something that you carefully planned and executed, then it is a good win. Because most likely it is something that is repeatable and duplicable, which can contribute a big part to your long-term consistency.
- If a winning trade is not within your trading plan, then often it is categorized as a bad win. You took the trade based on impulsive behaviour, you jumped into the chart just start taking blind trades. Yes, it is still a winning trade, but as a professional trader we do not determine the quality of a trade based on the outcome. It all depends on the execution of the strategy and the quality of the setup itself. You can have the best setup where everything aligns but still lose money. Think about it.
2. Do a mindset checking - "Is my mindset still clear?"
- Is your mindset still at at peak? If the answer is yes, then feel free to continue trading, because who knows it could be one of those good months?
- But if the answer is no, then probably you should take a step back. You can either trade less size to track your performance or you could perhaps stop trading and focus on something else, then come back stronger.
3. Set a drawdown limit (Very important)
- Always pay yourself first. Active trading is still considered a job. I understand the importance of compounding, but always take a small portion of the money and pay yourself first, then continue growing your account.
- By setting a drawdown limit, it calms your mind as you secured portion of the profits. It always avoid you from performing poorly due to a different mindset approach then eventually give back all of them back to the markets.
Let me know your thoughts in the comments below.
If you enjoy the content, make sure you click the like button and share it with someone who need to read this.
