1-2-3-4 Reversal Trading Strategy (Part 2 of 2 Bearish) 1-2-3-4 Forex Reversal Trading Strategy
A 1-2-3-4 reversal chart pattern is build up of 4 definable points, known as point 1, 2 , 3 and 4. A typical 1-2-3-4 chart pattern is best traded after a strong currency pair up - or downtrend and can be defined by an easy set of trading rules.
A trader can confirm the reversal trade using a technical indicator such as DMI or MACD. (or other ones)
1-2-3-4 Basic Rules for Short Trades
Point (1): The high in an up trending currency market.
Point (2): A downward correction in the up trend, the lowest bar in the correction before the price moves back up to point (3).
Point (3): The high in the move up from Point (2) but a failure to make a new higher high(Point 1).
Point (4): Go short 1 pip below point (2)
Daily chart of GBPAUD shows and example of a sell 1-2-3-4 Reversal Trading Strategy, with a 1: 5+ Risk Reward setup. 50 pip stop and 285 target.
This would have been a six day trade, but can use this same strategy on lower time frames. I use the Fib Extension tool for profit targets, help alot.
Risk Management

1-2-3-4 Forex Reversal Strategy (Part 1 of 2 Bullish)A 1-2-3-4 reversal chart pattern is build up of 4 definable points, known as point 1, 2 , 3 and 4. A typical 1-2-3-4 chart pattern is best traded after a strong currency pair up - or downtrend and can be defined by an easy set of trading rules.
A trader can confirm the reversal trade using any technical indicator such as DMI or MACD (or others).
1-2-3-4 Basic Rules for Long Trades
Point (1): The low in a down trending currency market.
Point (2): An upward correction in the downtrend, the highest bar in the correction before the price falls back up point (3).
Point (3): The low in the move down from Point (2) but a failure to make a new lower low(Point 1).
Point (4): Go long 1 pip above point (2)
Noted daily EurUsd chart example has a 1: 3+ Risk Reward setup with a 30 pip stop and 100 pip target/profit. This would have happened within 6 days, yes this can be used on shorter time-frames, but I would not go lower then 15 minutes or 1 hour using this strategy.
I used the Fib Extension tool for profit areas when using this strategy to set targets. 127.20% extension target looks great for most profits, like this chart.

Without this, you will not become a profitable trader
Yes, this is risk management.
Without proper risk management, your trading strategy based on levels, indicators, patterns, etc.will not make any sense.
Any trading strategy should be supported by strict risk management, where the maximum allowable losses per transaction and the risk ratio are observed:the profit is always more than 1/2.
You don't have to be right in every trade. It's just that your profit in successful transactions should be greater than the losses in unprofitable transactions. This correct use of risk management will lead you to success.
____________
The example shows one of the real scenarios of any trading system where the rules of risk management are observed:
Deposit of 10,000$
The risk per transaction is -1% (or -100$)
Total trades:
4 profitable trades = +14%
10 losing trades = -10%
Total: +4% (or + 400$)
Even though only 30% of the total number of profitable transactions, we still have a profitable result.
Learn risk management and become a consistently profitable trader.
❤️ Please, support our work with like & comment! ❤️

Fibonacci Expansion (How To Use)PLOTTING A FIBONACCI EXPANSION:
- Select the Fibonacci Expansion Tool
1) Start From The Top Of The Trend (In A Down Trend)
2) Set The Middle Point Where The Correction Started
3) Set The 3rd Point, Where The Correction Ended
Possible Target areas and/or zones are plotted below this 3rd point for you to utilize as per your risk management and trading style.
*For an uptrend set up you would just need to turn the above upside down, not hard but will help lessen your stress when trading FX.

8 TRADING HABITS OF SUCCESSFUL TRADERS👩💻👨💻
Hey traders,
Consistently profitable traders have a lot of things in common. Watching how they act and following their ideas & thoughts we can spot a lot of commonalities among them.
In this article, I have collected 8 trading habits that a trader should have to become successful.
1️⃣ - Continuous Learning 📚
The markets are infinitely deep in their nature.
Trading & constant monitoring of the market always unveil new, uncharted elements and things.
With 8 years of day trading, I can't help wondering how many new things I learn each and every day.
With continuous learning you evolve, you become better and it improves your trading performance & results.
2️⃣- Emotional Stability 🙏
The market is a wild beast who always wants to bite us.
And most of the time it manages to do that:
drawdowns, losing streaks...
Those who trade for at least 1 year know how unpredictable and unstable the market is.
A perfectly looking trading setup can easily turn into a big losing trade.
Of course, that is painful, of course with more and more losers, the anxiety will pursue us, the stress will overwhelm us.
Only by remaining stable and calm, you will manage to overcome the negative periods.
Learn to control your emotions, learn to take losses!
3️⃣ - Constant Practice 💪
Pro traders never stop, they always watch the charts, they always monitor the prices, and follow the market.
Trading requires constant TRADING.
Just spending one single week on a vacation without charts, you can not imagine how hard it is to return back.
The trading skills must be constantly maintained.
4️⃣ - Trade Journaling 📝
Pro traders always assess their past performance & results.
They track each and every trading position that they opened.
Both losing trades and winning trades require analysis and observations.
Only by studying the past results the trader can improve his trading performance and evolve. Only by identifying mistakes & peculiar commonalities, the trader learns to lose less than he makes.
5️⃣ - Anticipation of Different Outcomes 👁
Everything can happen in financial markets.
Pro trader always reasons in probabilities.
He knows that 100% chances do not exist.
Accepting the probabilities the trader (even while opening the trade) is always ready for completely different outcomes and accepts each and every move of the market.
6️⃣ - Flexibility & Adaptivity 🕺
The markets are always changing.
If you were trading before COVID crisis, I guess you feel how the reality among us shifted. With fundamental changes in our daily lives, the markets changed as well.
It is hard to say what exactly has altered though, however, we all can feel it.
In order to survive in a constantly changing environment, one should adapt. One should look for ways to be one step ahead.
To beat an evolving market, the traders should constantly polish their trading strategies, drop the things that don't work anymore, and adopt the new, reliable ones.
That is the only way to stay afloat.
7️⃣ - Selection of Right Markets 📈
The trader always knows what to trade and he always has a reason.
He admits that some financial instruments are appropriate for his trading style while some are completely not.
Pro trader does not wander around aimlessly from one market to another. He has a plan to follow and rules to rely on.
8️⃣ - Realistic Expectations ⭐️
Many newbie traders drop trading just because of wrong expectations.
The desire to get rich quick, to catch 20/1 risk to reward trades without substantial losses is playing a dirty trick with them.
The true trader is not greedy, in contrast, he is humble and the only thing that he wants is simply to win more than he loses and make that amount sufficient enough to have a good living.
Adapting these 8 habits, you will see dramatic improvements in your trading.
And even though most of them require a substantial effort and many years of practicing, trust me, it is worth it and it will help you in your daily life as well.
Would you add some other habits to this list?🤓
Let me know in a comment section.
❤️Please, support this idea with a like and share your feedback in a comment section!❤️

Fibonacci Extensions Part 5What Are Fibonacci Extensions?
Fibonacci extensions are a tool that traders can use to establish profit targets or estimate how far a price may travel after a pullback is finished. Extension levels are also possible areas where the price may reverse.
Key Takeaways:
Common Fibonacci extension levels are 61.8%, 100%, 161.8%, 200%, and 261.8%.
The Fibonacci extensions show how far the next price wave could move following a pullback.
Fibonacci ratios are common in everyday life, seen in galaxy formations, architecture, as well as how some plants grow. Therefore, some traders believe these common ratios may also have significance in the financial markets.
Extension levels signal possible areas of importance, but should not be relied on exclusively.
The Difference Between Fibonacci Extensions and Fibonacci Retracements
While extensions show where the price will go following a retracement, Fibonacci retracement levels indicate how deep a retracement could be. In other words, Fibonacci retracements measure the pullbacks within a trend, while Fibonacci extensions measure the impulse waves in the direction of the trend.

Fibonacci Retracement Definition Part 4Fibonacci Retracement Definition Is:
In finance, Fibonacci retracement is a method of technical analysis for determining support and resistance levels.
It is named after the Fibonacci sequence of numbers, whose ratios provide price levels to which markets tend to retrace a portion of a move, before a trend continues in the original direction.
A Fibonacci retracement forecast is created by taking two extreme points on a chart and dividing the vertical distance by important Fibonacci ratios.
0% is considered to be the start of the retracement, while 100% is a complete reversal to the original price before the move.
Horizontal lines are drawn in the chart for these price levels to provide support and resistance levels. Common levels are 23.6%, 38.2%, 50%, and 61.8%.
Yes, you can add or change any and/or all of these numbers to your trading style- they can be used to enter a trade, set stop loss and targets.
This retracement percentage lines are short term reversal areas to possible take new trades with the main trend of day, week or month.

YOUR PROFIT FORMULA | Three Essential Ingredients 🤔💭💫
Hey traders, We must admit that it is phenomenally difficult to become a consistently profitable trader.
This journey requires years of practicing and training, constant losses, and nervous breakdowns.
If you are a struggling trader, if you are still looking for your way to succeed in this game, here is the formula that will help you to chase consistent profits.
💰Consistent profits = 📝Trading Strategy + 🤬Emotions + 📈Market Sentiment
Let's discuss each element separately.
📝Trading Strategy:
To be in profit in a long run requires an understanding of what do you actually trade.
You must have strict and objective entry conditions.
You must rely on the objective & verifiable rules for the execution of market analysis.
You must have a plan to follow.
A plan that is backtested and proved its efficiency.
🤬Emotions:
Even the best trading plan, the most accurate trading strategy can be easily beaten by emotions.
Emotional decisions such as revenge trading and early position close
can easily blow the account of any size in a blink of an eye.
The most disappointing thing to note right here is the fact that you can be taught how to execute technical analysis but you can not be taught to control your emotions.
Your main enemy here is yourself and being in a constant battle with your greed and fear it is very easy to go broke.
Only by being humble, disciplined and patient, you can successfully apply a trading strategy.
📈Market Sentiment:
Mastering your emotions and having studied a trading strategy, it looks like it is finally the time to make money.
However, occasionally the market tends to be irrational.
Being chaotic and unpredictable, sometimes the market neglects every technical and fundamental rule.
Crisis, euphoria: the reasons can be different.
The fact is that such things happen.
And it is your duty to learn to deal with unfavorable market conditions.
💰To become a consistently profitable trader, you must become the master of these three elements.
Only then the doors to freedom and independence will be opened to you.
❤️Please, support this idea with a like and comment!❤️

Three Types of Drawdown | ForexBeeThere are three types of drawdown in trading
Absolute drawdown
Relative drawdown
Maximum drawdown

Zombie Companies and You!Much of the massive amount of new money the Fed is printing is going into Zombie Companies.
How Zombie Companies Survive
Zombie Companies are firms that don’t survive by producing value for their customers. Instead, they survive by parasitically draining resources from the overall economy by borrowing at near 0% interest from the Federal Reserve. The Federal Reserve just creates this money out of thin air.
How this Harms Everyone
So this borrowing has the same negative effect on everyone’s paycheck purchasing power as criminal counterfeiters do. Instead of consumers having the power to support businesses that do provide valuable goods and services, the Fed effectively steals that money from consumers and gives it directly to corporations without them having to produce value for consumers.
Stolen Productivity Gains
Productivity gains allow the government to do this without increasing the consumer price inflation too much. In the first half of the 20th century, the financial benefits of technological innovation and productivity gains were generally evenly enjoyed by society.
Immediate Effects on the Stock Market
The immediate effect of dumping money into corporations is that their stock value rises. You can see this in the recent explosive growth in the US stock market. However, it can’t go on forever, because it would lead to catastrophic hyperinflation as seen many times throughout history and most recently in Venezuela.
Long-Term Effect of Sustaining Zombie Companies
You can see the long-term fallout in Japan’s “Lost Decade”. Japanese banks continued to support weak or failing firms. The result was three decades of poor economic growth.
Long-Term Effect of Killing Zombie Companies
This effect can also be seen in the Stagflation of the 1970s. The US abandoned the Gold Standard in 1972 allowing the Federal Reserve to print as much as they wanted. What followed was almost no economic growth for a decade and a 17X explosion in the price of gold relative to the dollar. Then Jimmy Carter appointed Paul Volker the chairman of the Fed. Volker had a will of steel required to force America to endure the short-term pain of increasing interest rates. This pain took the form of massive unemployment as zombie companies went bankrupt or were forced to restructure to live within their means. However, the long-term result was two decades of great stock market performance through the ’80s and ’90s.
Possible Future Scenarios
Based on all past periods of massive monetary supply inflation like this, it’s very likely the US will eventually reach a point where the bubble pops and there’s a stock market crash.
Pre-Crash Strategy
Ideally, you’d have the Federal Reserve and Wall Street’s insider information that would help you predict the timing of the crash and get out in advance. Then you could keep enjoying the amazing returns from the bubble as long as possible. However, for the rest of us, the best we can probably do is put our money in precious metals ETF’s to be protected from these losses.
Post-Crash Scenarios
1. Fed Responsibly Raises Interest Rates
If the Federal Reserve begins behaving responsibly at that point, they would raise interest rates and force all the zombie companies to go bankrupt or restructure to begin surviving by providing value and earning money. This was the approach of Fed Chairman Paul Volker in 1979. Higher interest rates will temporarily increase unemployment and make the stock market sharply fall even more in the short term. However, after this correction, it will great opportunity to sell your gold ETF’s get back into the stock market at the bottom and enjoy significant future growth.
2. Fed Continues Low-Interest Rate Policy
This was the approach of Japan in the ’90s. The zombie companies were kept on life-support. The result was that it took 3 decades for the market to get back where it was before the crash. Given that it’s unlikely anyone has the political will to cause the short-term pain of higher interest rates, this seems like the most likely scenario.

How to use trendline to identify price action structure/patternHi everyone:
Many have asked me about how to properly use trendlines to identify price action structures and patterns. So in today’s educational video, I will go over this topic in more detail.
First, I use the trendline as a “frame” to identify structures and patterns, and NOT use it as a Support/Resistance.
What I do is to put in the trendline for the highs and lows of the price action that can help me to pinpoint what the price is doing, what kind of a correctional structure that it is currently in.
Typically after an impulse phase of the market, then we start to identify a structure/pattern by connecting the swing highs and lows.
Second, as I always point out in my videos/streams, a structure/pattern needs at least 2 swing highs and lows to classify as a structure.
Certainly more swing highs and lows are good, but it's not necessary. Often I get asked about the “third touch” or more. To me it's not necessary, but if price does form the third touch, I would proceed the same as the price has a second touch.
Third, we are identifying the price action correctional structure, and sometimes the market is not perfect, it will not give you a textbook looking bullish flag as an example.
Hence the backtesting and chartwork from each trader is important to get your mind familiarized with the market and its “imperfect” development of the price action.
After identifying the impulse phase, then look to see what the market is doing. Is it falling into a consolidation ?
Not much movement except sideway price action, or ascending/descending like consolidation will give you a clue on whether the price is correcting to continue, or correcting to reverse.
Take a look at the educational videos I have made in the past regarding the type of correctional structures we typically see in the market. All the videos are down below.
Continue to backtest and do chart work to get familiar with drawing in the structures/patterns. The more you do these, the better and easier it is for you to identify them in your trading journey.
Remember, the market is not perfect, so not all the structures/patterns will be “Textbook” like on the real, live market. Learn to deal with the “imperfect” market, so you can better utilize price action analysis to your advantage.
Any questions, comments or feedback welcome to let me know :)
Thank you
Below are all my price action structures/patterns videos on different type of corrections.
Continuation and Reversal Correction
Identify a correction for the next impulse move in price action analysis
Impulse VS Correction
Multi-time frame analysis
Continuation Bull/Bear Flag
Parallel Channel (Horizontal, Ascending, Descending)
Reversal Ascending/Descending Channel
Reversal Rising/Falling Wedge
Reversal Double Top/Bottom
Reversal Head & Shoulder Pattern
Reversal “M” and “W” style pattern
Reversal Impulse Price Action
Continuation/Reversal Expanding Structure/Pattern

Supply & Demand zone trading (Continuation and Confirmation)You should use a few charts when you trade (I use three minimum)- daily, 4 hour and 1 hour (enter on either 4 hour or 1 hour) scalps or day trades.
You want to used supply and demand zones to trade from, either continuations or bounces out of back into major trends.
Please practice finding and trading out of during your trading- in zones is mostly accumulation and sideways/ or ranging price action.
As noted on example charts: both demand and supply zones can switch after price action breaks areas and turn into the opposite one. Be flexible.

What Type Of Forex Trader Are You? Four Types Of Forex Traders:
1) Day Trader- A day trader is one who closes all trade positions at the end of each trading day and makes sure there are no open positions overnight. Day traders function with an extensive knowledge and experience of what the Forex entails. This category of Forex traders makes use of a variety of methods to make proper trading decisions that lead to success. Some trade securities with the use of technical indicators and analysis in the calculation of favorable trade entry and exit time frames while other trade based on instincts.
2) Position Trader- A position trader trades securities in the Forex market by holding a trade position for a long-term, in a period of weeks to months and sometimes, years. These set of traders, unlike day traders, are less concerned with short-term price fluctuations and the economic news release of the day. Position traders are not active traders. They initiate few trade positions in an entire year.
3) Scalper Trader- A scalper trader holds a trade position for a short-term period in an attempt to make profits out of the short hold. These set of traders buy and sell securities many times in a day with the mindset of making a small percentage of consistent profits out of the market. A scalper uses a manual and automated trading system on various platforms thereby developing functional strategies that generate profits from the bid and ask spreads. The manual system of trading involves the trader making trade executions while sitting in front of his computer while the automated trading strategy involves the trader setting rules and guidelines on how to use trade signals.
4) Swing Trader- A swing trader are those who make profits and returns in the Forex market by holding a trade position overnight to several weeks. These set of traders make use of fundamental analysis, the intrinsic value of a security, price trends, patterns, and technical analysis to search for financial instruments with short-term price momentum. Swing traders trade by the identification of securities which has an extraordinary possibility to move in a short time frame. The goal in swing trading is to trade on large price moves on a daily basis by spending longer time (weeks and months) monitoring the security in question.

Different forex trading order types:What we are going to do here is give a refresher on the types of orders in Forex trading so you can begin really taking advantage of what is available and hopefully incorporate additional order types to your trading style and money management approach better.
Please read carefully everything in the picture, I'm sure will be helpful for you!
The list of order types in forex trading:
Market Orders
Limit Orders
Take Profit Orders
Stop Loss Orders
Trailing Stop Orders
P.S. Did you like my article? Share it with your friends, it will be the best “thank you" :)
Ask me questions and comment below. I’ll be glad to answer your questions and give necessary explanations.

Rally Base Rally (Need2Know)Part 2: Rally Base Rally
Rally- Prices go suddenly upwards
Base- Price goes into a range or sideways makes a demand zone
Base areas are always best times to get on trades with right risk management always.
Rally- Price breaks out of demand zone and continues on upwards

Drop Base Drop (DBD) Need2KnowPart 1: Drop-Base-Drop
Drop- market suddenly is bearish
Base- market ranges or goes sideways, then
Drop- market again breaks out of range and goes down
Note: The Base area on 1 hour, 4 hour and daily charts are best times to set up any new trades with right risk management as always.

Can You Trade On Daily Charts With Small Account? YesYes, you can.
All you need to do is lower lot sizes from standards to Micro lot, Mini lot or Nano lot sizes instead.
Like chart example shows you and example of trading a breakout of two weeks ago with 150 pip stop vs 350 pip target, or 1:2.5 Risk/Reward. Risking around $100 to get a reward of $250 in four days is great risk management (same week).
Good Luck- just use commonsense, discipline and patience

Trading Daily Charts (Might Save Your Trading)If You Master Forex Trading On Daily Charts, You Can Trade For A Lifetime. (Understand the language of candlesticks on daily charts)
1) Quality trades not Quantity of trades- Trade your best trade setups only at swing points on daily charts.
2) Patience- You make money waiting not trading. You do not need to trade 20-30 times on lower time frames per month, when 2-3 times will make same money with less emotions and stress. Also, you will have more time freedom to enjoy life and find balance. Forex trading is not everything you are.
3) Probabilities- Only trade your best set ups at swing points (ex: like support/resistance, fib ret 50% to 61.8% area, swing points, etc..
4) Lower Lot Size- Related to using high stop loss, but like chart example let trade run for one or two weeks. 1:5 to 1:8 Risk Reward on trades will be goal.
5) Turtle Not Rabbit Trading Is Key- Trading Forex is a turtle marathon not a rabbit sprint race. Slow down- have faith in your strategy and edge.
6) Daily Trading Might Be Your Holly Grail- Look for entering only on Engulfing, Harami or Pin-bar setups on daily charts (that is all you need).
If you are part of the majority of Forex traders whom trading is difficult, DO NOT trade lower time frames which are under 1 hour (to much noise).
Only trade daily time frames until the end of this year and master them. Then maybe, next year can go to lower time frames of 4 hours and 1 hours. You tube videos on Forex trading position sizing, risk management and Forex daily charts. Daily charts help develop a more effective and accurate market bias, higher risk and reward (look at example chart) with 50 pip stop risk vs. 5xs to 8xs reward- which is great. Slow ans stead wins the race (Hare vs Turtle).

Market Makers (They Are Buyer & Seller Liquidity Providers)What Is A Maker Maker?
Market Maker refers to an institution or individual that offers prices for specific Forex pair(s) that it holds in inventory, and is prepared and able to buy or sell those assets at any time. Market Makers are High frequency trading companies. Market Makers must be compensated for the risk they take, generally by commissions, per trade.
Market makers tend to oftentimes be surrounded by a bit of an aura of mysticism in light of the fact that other market participants consider them all-knowing entities who can do no wrong.
Is that the case?
Most definitely not. Instead, why not look at market makers as liquidity providers so as to see them for what they actually are: yet another market participant, with pros as well as cons associated with their status. The liquidity they provide tends to be quite useful and what the (in)famous bid-ask spread is all about.
In contrast to conventional brokers, marker makers assume a high level of risk because of the high number of units they hold their inventory.
Market makers are entrusted with promoting market efficiency by keeping markets liquid. To ensure impartiality for the benefit of their clients, brokerage houses who act as market makers are legally required to separate their market making activities from their brokerage sales operations.

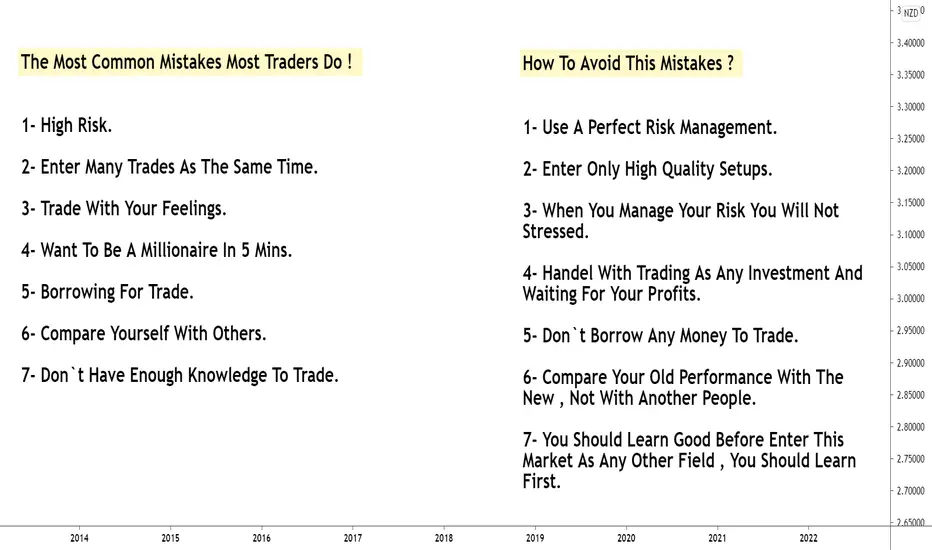
The Most Common Mistakes Most Traders Do, How Can Avoid It ?This is an educational + analytic content, If You Did What We Mentioned Above , Your Performance Will Increase At Least 80% And You Will Feel It`s More Easy And Deserve All Effort .
How to place stop loss like a Pro TraderStop loss placement is perhaps not the most glamorous of trading topics to discuss, but it is a critically important one. If you do not know how to properly place your stop loss, you will be in for a very, very rough ride as you trade the markets. Essentially, for a trader, everything hinges on proper stop loss placement and risk management. If you understand these two aspects of trading and how to approach them properly, making consistent money in the market will become much, much easier for you.
Note : This lesson is based on higher time frame charts and the concepts are not applicable to very low time frames which is a different world of trading and not something I do or recommend so I can’t comment on it.
The theory behind placing stop losses like a pro trader
The first thing to understand and drill into your head about stop loss placement is that you should NEVER place a stop loss based on some random amount of pips. I know a lot of traders do this because I get emails from traders telling me they use “20 pip stops” or “50 pip stops”, etc. etc. This is NOT proper stop loss placement and it is definitely NOT how professional traders place their stop losses…
A stop loss should typically be based on a level in the market. Price should have to breach a level to ‘prove’ your trade wrong. You want to see price invalidate your view by giving you fact-based evidence you are wrong, that evidence comes in the form of the most logical nearby level of support or resistance being breached.
You need to take into account the context of the market you are trading and determine what level price would have to break through before your original view doesn’t make technical sense anymore. Let’s take a look at two examples to make this clearer…
The first example below shows a random pip amount stop loss placement, the second example shows a stop loss placed within the context of the market and nearby levels. Make note of the end results of both trades…
Notice in the chart below the trader placed his stop loss at an arbitrary 50 pip distance from entry. Traders typically do this because they don’t understand how to place stops properly and also because they want to trade a bigger position size. This is wrong. You need a logic / chart-based reason to place a stop loss, not just a random pip distance or a pip distance that will allow you to trade the size you want. Notice this trader would have been stopped out for a loss just before the market shot higher, without them on board…
In the next chart, we can see how this trade worked out for the trader who knew how to place stops properly / like a pro and who wasn’t placing his stop arbitrarily or based on greed (to trade a bigger size). Notice the stop loss was placed beyond the key support level and beyond the pin bar low, giving the trade good space to work out but also being placed at a point that would logically invalidate the trade if price moved beyond it….
Let’s briefly go over typical stop loss placement on two price action setups I teach; the pin bar signal and the inside bar signal . You will notice, I used a risk reward ratio of 2 to 1 on each trade, this is my ‘default’ risk reward. In other words, I always start any trade by seeing if a 2 to 1 (or more) risk reward is realistically possible given the market structure and context the pattern formed within. For expanded examples, you can reach out to me for my lesson on how to place stops and targets like a pro .
Note: Be aware of the average volatility over the last 7 to 10 days of the market you’re trading. You want your stop at least half of ATR (average true range) if not more or you will get stopped out due to noise.
The Average True Range is a tool we can use to see average market volatility over XYZ days. It is a good tool to utilize for stop loss placement when no nearby key levels are present. To learn how to apply and use the ATR tool more in-depth, you can reach out to me for my article on the average true range.
The example below shows how to use the ATR for stop loss placement and how it can keep you in a trade despite initial choppy conditions after the pattern…
IMPORTANT STOP LOSS PLACEMENT TIPS
It’s important to consider reward or target potential before taking any trade. You base the potential target of a trade on the stop loss distance. If the stop has to be too wide in order for the trade to have enough space to potentially work out, and the risk reward potential doesn’t stack up, then it’s usually not the best idea to take the trade.
Risk reward and position sizing are intimately related to stop loss placement obviously, and crucial topics in their own right. But, we are focusing here in this lesson just on stops, be aware that stops are paramount and take precedence over targets, in a way, stops are a qualifier for the target and overall risk reward and will effectively help you filter trades you should take and should not.
It is important to note that stops should always remain constant and can’t be widened, however targets can be widened, stops should only ever be tightened and moved into break even and trailed, make sure that’s concrete in your trading plan.
Stops are crucial to managing risk because once we find the stop loss placement we can then determine our position size on the trade and then we know ahead of time the cost and risks of the trade. As part of our trading business plan, stops are a cost of doing business as a trader, they are also there to force us to get out if we are wrong on a trade, despite our emotional bias towards staying in a trade, which in the end can cost us dearly if we were to hang onto a loser until we blew out our account balance.
CONCLUSION
A properly placed stop loss is truly the starting point of a successful trade. It allows us to proceed with calculating reward targets on trades and position size, effectively allowing us to execute our predetermined trading edge with a clear mental state and discipline. Traders who do not focus on stop loss placement first or put a lot of importance on doing it right, are doomed to fail and blow out their accounts.
I hope today’s lesson has given you a little ‘snapshot’ into how I approach stop loss placement. My trading course and members’ area will further educate you on how I place stop losses and how I incorporate stop loss placement into my overall trading strategy. To learn more, you can reach out to me privately.

Forex Correlations ( Need To Know )Noted chart only has a few highly traded pairs and their either highly correlated negative or positive pairs on daily charts.
If you trade more then one pair at a time, you should know which pairs either mostly go same direction and or go opposite direction.
You might not want to do two trades that have a positive correlation or negative correlation for diversity and so you do not lose two trades at same time.
There are websites which have further information on Forex correlation- you should check out.

NVDA, Continuation of correction or making new ATH ?Is NVDA on the way to make a new ATH or correction still continues? We have to follow.
NVDA is a beautiful example of different scenarios possibility! If we look at the chart (right side) we simply may consider that correction is completed at 0.382 Retracement of last rally with clear abc form of correction but, is this the only possible scenario? Of course NOT
Flat corrections may mislead many traders. Being aware about flat corrections and its characteristics is necessary but not enough at all.
Being realistic is a key. We have to consider all possible scenarios and control our emotions. Traders who are long from the last low may not want to see the other possible scenario. They certainly wish to see new ATH but it may takes some more time than they expect!.
On the left side of the chart we can see the flat correction. In a flat correction wave (a) is a 3 leg wave. wave (b) typically goes above 0.618 Retracement and touches 0.786 and even goes higher to 0.88 Retracement . Then, when every one expect a new high it suddenly goes for a 5 leg down wave (c).
Which scenario is going to happen? No one knows. We have to use some risk management tools to manage our risk . Of course opening a position at such conditions is gambling not trading.
We always trade objectively and try to see all possible scenarios. Don't we?
