The Different Types Of Trading StrategiesHello everyone, as we all know the market action discounts everything :)
_________________________________Make sure to Like and Follow if you like the idea_________________________________
In today’s video, we are going to be talking about The Different Types Of Trading Strategies, We are going to compare them to each other and look at their characteristics.
Characteristics include 1) Time Duration, Type of Chart, Trade Targets & Risks, Frequency of Trades, Entry and Exit Time.
There are 4 types of trading styles :
Most people fall in the first 3
1) Scalping
2) Day trading
3) Swing trading
4) Position trading (Refers to holding a certain position over a very long time frame like a number of years, I think this type of trade is more of an investment than trading but technically it's still trading so I had to mention it ).
So Let Us Start...
1) Scalping
Time Duration is between a few seconds and a number of minutes
The Analysis is done on 1,2 and 5 minutes charts
Small targets considering the very short trade duration
High frequency of trades because of the small risk on each trade
Scalpers need to know exactly when to enter and when to exit a trade because a small mistake can have a huge impact on the trade
2) Day trading
Time Duration from 15 min to a number of hours
The analysis is done on 30 min, 1 hour, and 4-hour charts
These trades have a larger target than Scalping
Day Traders have a lower trade frequency than scalpers and its usually between 2-10 trades per week
Day Traders doesn’t have to be so precise with entry and exits like in Scalping because being late for a trade on a daily basis won't have that much of an impact on the trade.
3) Swing trading
Time Duration typically last from a day to a couple of months
The Analysis is done daily, weekly & monthly charts
Because of the time frame, Targets usually are way larger than day trading or scalping
Low frequency in trades, Usually between 2-15 trades per month
Entry and exits here don’t have a big impact because the targets are so big
So now you ask yourself how do I know which type of trader am I?
And it comes down to 2 main factors :
Personality: You could be someone who likes to hold trades and profit big so swing trading is for you, Or you could be someone who doesn’t like to hold trades over a day period so scalping or day trading could be for you.
Lifestyle: So you may not have the time to always watch the market and how it's moving, so scalping and day trading are not for you, but for swing trading, u only have to check the market once a day so it's the better option for you.
Don’t feel like you need to decide what type of trader you are, you should try all of them and see for yourself what are you comfortable with after all there is no right answer.
I hope that I was able to help you understand The Different Types of Traders better and if you have any more questions don't hesitate to ask.
Hit that like if you found this helpful and check out my other video about the Moving Average, Stochastic oscillator, The Dow Jones Theory, How To Trade Breakouts, The RSI, The MACD, and The Bollinger Bands, links will be bellow
Risk Management

8 Major Currencies Nickname & Sessions Best Times to Trade 8 Major Currencies is when base currencies session is open. Why? It is time when highest liquidity & volume is trading.
Sydney:
AUD
NZD
Tokyo:
JPY
CHF
Frankfurt/London:
GBP
EUR
New York:
USD
CAD
PLEASE CONVERT SYDNEY-TOKYO-FRANKFURT/LONDON-NEW YORK sessions to your individual time zones: to get exact times of open and closes and overlapping sessions of TOKYO/LONDON and LONDON/NEW YORK sessions. Overlapping are highest liquidity and volume times of the Forex session.

8 Benefits Of Trading Forex8 Benefits Of Trading Forex-
-Low cost
Generally, retail brokers make their profits from the Bid/Ask Spread, which is apparently very transparent to users.
-No middle-people
It allows you to trade directly with the market accountable for the pricing of the currency pair.
-No fixed lot size
Lot sizes differ broker to broker - standard lot, mini lot, micro lot or even nano lots. This enables you to start trading from as low as $50.
-Low transaction costs
The retail transaction cost (bid/ask spread) is usually as low as 0.1% and for bigger dealers, this could be as low as 0.07%.
-No one can control the market
The foreign exchange market is large and has many participants, and no single participant (not even a central bank) can control the market price for a prolonged time period. Therefore, the chances of sudden extreme volatility is very rare.
-24-hour open market
The Forex market starts, from the Monday morning opening of the Sydney session to the afternoon close session of New York session.
- Use of Leverage and Margin
Forex brokers permit traders to use leverage and with low margin, which gives ability to trade with more money than what is available in your account.
-Very High Liquidity
Because the size of Forex market is huge, it is extremely liquid in nature. This allows you to buy or sell currency any time you want under normal market conditions. There is always someone who is willing to accept the other side of your trade.

The Bid-Ask Spread (What Is It?)The spread is the difference between the bid price and the ask price.
The bid price is the rate at which you can sell a currency pair.
The ask price is the rate at which you can buy a currency pair.
Whenever you try to trade any currency pair, you will notice that there are two prices shown, left price is BID and right price is ASK.
The spread is brokerages commission on that trade, that is why all trades start off in negative until that spread is negated before turning profitable.
For Your Information:
The lower price is called the “Bid” and it is the price at your broker (through which you’re trading) is willing to pay for buying the base currency.
The higher price is called the ‘Ask’ price and it is the price at which the broker is willing to sell you the base currency against the counter currency.

What Is The 80/20 Rule? (Forex trading)What is the 80/20 rule? this applies to play, work, trading, business and all parts of your life.
20% (of your trading) equals 80% (of your results).
An 80/20 mindset enables you to take control!
- More Time
- More Focus
- More Money
- More Freedom
- Less Stress
" Time Is A Gift"
"Time Is Money"
Questions To Ask Yourself?
1) Can you trade less and make more money trading?
2) Can you trade only high quality trades with the right pair, at right price, during right session & at right time?
3) Can you focus on only trading only one or few Forex pairs and know everything about them? news, price action etc...?
4) Can you trade with a simple and repeatable trading system and edge to profit in long run? Is trading strategy flexible?
5) Can you always use discipline when trading? using risk management: stop, entry and targets to protect your account?

Risk Management (Your #1 Priority)Risk Management in Price Action Trading
Risk management in price action trading is much like risk management in any other style of trading; the same basic rules apply:
1. Know your maximum risk tolerance, i.e. the loss you are willing to take on each trade, before you place the trade. A common rule is that traders will not put more than 2% of their funds in the market at a time.
2. Understand correlation between assets, and to what extent you would like to be diversified.
3. Know when you will exit before you enter.
4. Know your reward/risk ratio.
5. Identify what you expect to happen and why, and what price point negates that expectation. This is price point at which you should put stop. Of course, with risk management, techniques are important, but, ultimately, it is up to the trader to ensure they are psychologically prepared for all that is involved.
Even if a trader is using a fully automated system, he/she must still have confidence in the system, and must know when any losing streak experienced is just a temporary losing streak versus a more fundamental problem suggesting the system is no longer valid.

Risk management lessonI mentioned it on another day already, but this topic is very important so I decided to share it again to reach as much as possible. Hope it will help some!
The last weeks it happend again, I saw some traders with less knowledge (young and old) who crashed their accounts very hard. They lost a lot of money and for some it was very dreadful!
It is hard to watch this people how they burn money and bring even his own family in financial danger. That´s why I decided to share one important chapter from my book here to you.
May be some will find very helpful, or some will remember this rules again.
I will keep it a bit shorter here as in my book, but the main points are still mentioned!
I can´t say it often enough, keep the important rules in trading. Trading is not the way to get rich quick, it is a serious and hard business! It take a lot of time to learn, it requires a lot of patience and it will happen a lot of failures.
This failures are even more important than your success! Success will not open up how it will not work, failures will.
Let´s talk about risk management!
For each investment you have to consider you take for each trade the risk to lose money, that´s why it is mandatory to handle each investment with a good risk/reward distribution.
You have to keep in mind, the determined risk/reward is only theoretically and can result complete different. But with knowledge you can dedicate a good entry for your trades to keep your risk as low as possible.
Determine important support and resistance levels and think about all situations what could happen and what will you do if you are going into the red or into the green? Which levels are the best entry and exit?
This all will help you to determine your riks/reward ratio.
What is the Risk/Reward Ratio?
Successful day traders are generally aware of both, the potential risk and potential reward before entering a trade.
The goal of a day trader is to place trades where the potential reward outweighs the potential risk.
These trades would be considered to have a good risk/reward ratio.
A risk/reward ratio is simply the amount of money you plan to risk, compared to the amount of money you believe you can gain.
For example, if you think a potential trade may result in either a $400 profit or $100 loss, the trade would have a risk/reward ratio of 1:4, making it a favorable setup. Contrarily, if you risk $100 to make $100, the trade has a risk/reward ratio of 1:1, giving you the same type of unfavorable odds that you can find in a casino.
Which ratio should you desire?
Like described above, finding trades with high risk/reward ratios (1:2 or higher), will help you maintain higher average profits and lower average losses, making your trading strategy more sustainable.
The common suggestion between traders is a distribution of minimum 1:2 ratio. In reality there are often even better ratios available, if you do your technical chart analysis.
But what should you do if you have to cut losses?
We have to place our stop loss right below our support or other important levels we determined before.
The purpose is to cut losses before they grow too large. Stopping out of a losing trade can be one of the hardest things for traders to do consistently. However, failing to take stops can result in margin calls, unnecessarily large losses, and ultimately account blowouts.
How big should I enter a position?
To lower your risk I recommend to think about your size to enter a position.
Overall you shouldn´t risk money you need, only deposit money in your broker you can afford.
Entering small can be the smartest way to safe your account.
I suggest that because of four reasons, the first reason is, you don´t risk to much of your funds and your stop loss should be tight anyway.
The second reason is, you can average down if the price is going in the other direction, but consider this option only if you are sure what you are doing.
The third reason is, you can buy the dips/pullbacks if the trend is strong and still heading in your desired direction.
In addition, the fourth reason is, your emotional control is stronger if the price movement is heading in the wrong direction.
That brings me to another topic.
Should you use leverage?
Yes I know, big leverage will give you big gains...but as a beginner you will not have the experience to know which trade has a very big potential or not.
Even experienced traders use only a small amount to enter a position and not the whole fund.
If you use leverage the losses can be much higher and the problem with that is, if you lose money, your leverage will also decrease significantly and the losses are harder to recover after each loss.
So the answer of the question, if you should use leverage:
For beginners we can easily answer: Take your hands of a big leverage!
You can so hardly blow up yourself with that tool, it is ridiculous. Your way back into the profit zone will probably take years.
But you have to save yourself and after a period of time, a period of taking profits and cutting losses you will gain knowledge until you feel much more comfortable on the market and you understand how trading really works, then you can consider to use leverage.
Conclusion:
As I said, I want to share only some big points about this topic, because I think many new investors don´t understand how important that topic is!
Safe yourself and have fun in trading and learning!
Sincerely,
TradeandGrow
Trade safe!

The Hard Truth About Trading 😅
Well, that is just a joke.
Or not a joke?
In every good joke, there's a sliver of truth...
So many people blew their trading accounts in a blink of an idea chasing the profits, so many people went bankrupt practicing leverage trading...
Do not be that guy in a picture.
Be a true trader!
Never forget about risk management and don't be greedy.
Never let your emotions control you.
Stay calm and humble while you trade.
Have a great weekend!
❤️Please, support these drawings with like! It really helps!

🔋 Live to trade another day 🔋As the weekend has come we have lost many fellow traders in the days that have passed and we will lose many more in the next week and the week after that... but if they only knew the basic principles of what this video goes over, they (their accounts) would still be here with us!
Our mission is to help other traders become successful and in an effort to achieve our goals we come up with simple yet effective tips and tricks on achieving our goals, by helping you achieve your goals!
This video goes over some ideas and tips on how you can survive as a trader, the tips we go over are:
LIVE TO TRADE ANOTHER DAY:
- Use position sizing
- Have a definite exit area
- Prepare properly before starting to trade
- Review your trades daily or weekly (always seek improvement)
- Always follow your process & system
- Don't listen to others, find your own trades daily
- Cut your losers when the market tells you the trade is done, you
can always re-enter
We hope this video helps you achieve consistency! If you like it check out the other related videos on our channel!
Happy Weekend Traders!

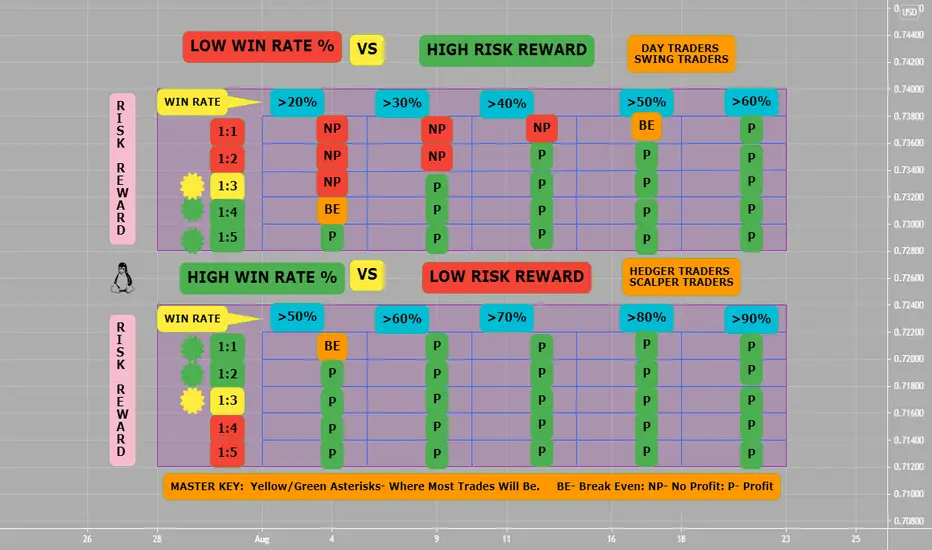
Trading Style? High Win Rate? High Risk Reward? Can't Have BothWin Rate, Risk/Reward, and Finding the Profitable Balance
You generally need to make a choice in your trading Forex: either have a high win rate % and low risk reward (hedge traders or scalp traders) or low win rate % and high risk reward. (day traders and swing traders).
Either can be successful, but it is a personal choice and different style of trading. Sometimes you can change depending on: pair, price, time & session that you are trading. End of Tokyo to end of London is high volume and liquidity daily time, so day trading might work and swing trading mid week. Hedging is mostly a high end money way of trading related to taking positions on both sides of a pair and scalping is going for many trades in same session, but make little pips per trade, but having high leverage per trade. These are great anytime of session, but do pretty good during low liquidity and volume times.
Win-rate is how many trades you win, usually given as a percentage. Such as 50%, 5 out of 10, or 50 out of 100. Means 50% of trades placed result in a profit.
Win rate is what many people focus on. They want to be right, often! Yet reward:risk (R:R) is just as important. R:R is how much a trader wins on winning trades versus how much they lose on a losing trade.
Most day traders focus on the win rate or win/loss ratio. The allure is to eventually reach that stage where nearly all their trades are winners. While this appears to make sense, having a high win rate doesn't mean you'll be a successful trader or even a profitable one. Your win rate is how many trades you win out of all your trades. For example, if you make five trades a day and win three, your daily win rate is three of five or 60%. If there are 20 trading days in the month, and you win 60 out of 100 trades, your monthly win rate is 60%.
What Is Leverage?Leverage is the use of borrowed money (called capital) to invest in a currency, stock, or security. The concept of leverage is very common in Forex trading.
By borrowing money from a broker, investors can trade larger positions in a currency. As a result, leverage magnifies the returns from favorable movements in a currency's exchange rate. However, leverage is a double-edged sword, meaning it can also magnify losses. It's important that Forex traders learn how to manage leverage and employ risk management strategies to mitigate Forex losses.
KEY TAKEAWAYS:
Leverage, which is the use of borrowed money to invest, is very common in Forex trading.
By borrowing money from a broker, investors can trade larger positions in a currency.
However, leverage is a double-edged sword, meaning it can also magnify losses.
Many brokers require a percentage of a trade to be held in cash as collateral, and that requirement can be higher for certain currencies.
Leverage simply allows traders to control larger positions with a smaller amount of actual trading funds. In the case of 50:1 leverage (or 2% margin required), for example, $1 in a trading account can control a position worth $50. As a result, leveraged trading can be a "double-edged sword" in that both potential profits as well as potential losses are magnified according to the degree of leverage used.
Example: USD/CAD at 50:1 or 2% leverage ( in this example, if you place a 100,000 USD/CAD trade with 50:1 leverage, your margin requirement will be $2000. Trade Size: 100,000 Margin: $2,000 Trade Size: 10,000 Margin $200 and Trade Size 1,000 Trade Size $20. *Required Margin. Required margin is the minimum account balance needed to hold a position.

Leverage 50:1 (maximum Reward Risk)Should you use 50:1 leverage or maximum Reward Risk on any one trade? Is that using proper risk management?
Per chart example:
1) You could either lose on chart one trade 10% of your account or
2) You could win on chart one trade 25% of your account
Using Leverage is a double edged sword, which can be used or abused in the context of risk management, lot size, margin and leverage.
Bad risk management is number #1 reason why traders blow accounts.
Use 2% of account on one single trade, adjust lot size accordingly, stop losses and targets- this is a marathon not a sprint.

Leverage Trading (Example)What is leverage in Forex?
Leverage is a facility that enables you to get a much larger exposure to the market you’re trading than the amount you deposited to open the trade. Leveraged products, such as Forex trading, magnify your potential profit - but also increase your potential loss.
Leverage works by using a deposit, known as margin, to provide you with increased exposure to an underlying asset. Essentially, you’re putting down a fraction of the full value of your trade – and your provider is loaning you the rest.
Leverage and risk management
Leveraged trading can be risky as losses may exceed your initial outlay, but there are risk-management tools that you can use to reduce your potential loss. Using stop-losses is a popular way to reduce the risk of leverage. Attaching a stop-loss to your position can restrict your losses if a price moves against you. However, markets move quickly and certain conditions may result in your stop not being triggered at the price you’ve set.

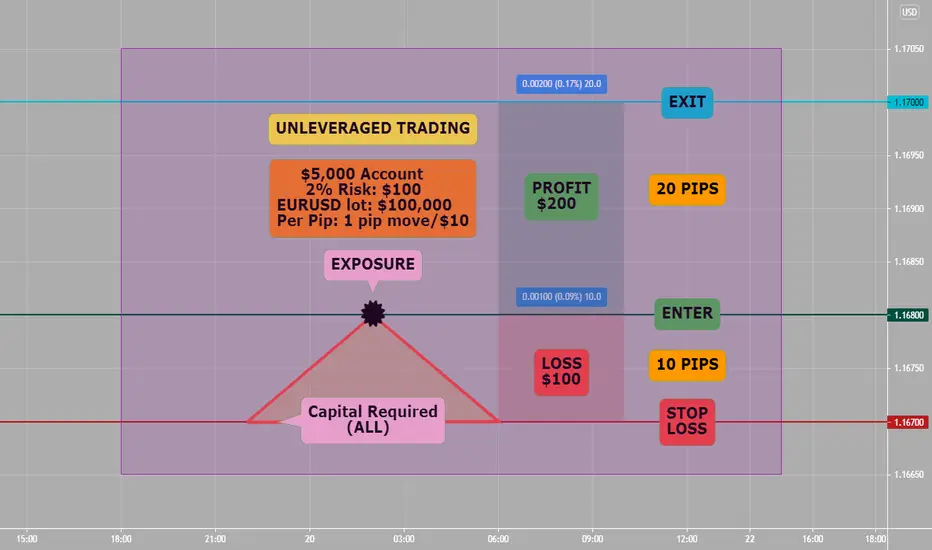
Unleveraged Trade (Example)Pure Forex trading without using leverage. Either loss $100 or win $200 on chart example of EURUSD.
MrRenev portfolio exposedHere is my current short term portfolio. This might give the reader an idea of how a moderately diversified short term portfolio might look. I use various tools (including turbos, options...) so it's hard to say how much I have in, but I know how much of original risk I got. Which is today €500. I added my little XRP bag from earlier this year to my crypto holdings to get to exactly 500.
It makes more sense to build a PF looking at risk rather than the size that doesn't mean anything by itself. Of course I have some winners and I have trailed my stop so this is why I precise "original" risk, that's the risk when I opened the position.
The whole thing is maybe €40,000 with €25,000-€30,000 in Forex which would make it around 70% but it is less volatile, in "risk" terms it's actually 30%. Entry stops are tight (for example 0.50% with FX, 2% with S&P, 1% with commodities depends). I am sure I have 25 to 30K in FX, it's the rest that is hard to evaluate.
Here is the detail:
30% - Forex: 2 longs on the Yen, 2 shorts on AUD, and short USDZAR.
25% - Commodities: Gold, Platinum, Natural Gas. All long.
23% - Indices: All in the S&P500 long, pyramided in since April.
12% - Crypto: Mostly Bitcoin. And a bit of XRP (it's less than 6 month old).
10% - Stocks: Pfizer & Moderna.
I also have a few stocks & cryptos that I hold long term and have not listed here. And cash in the bank. And physical goods in my house. I even have stamps and a few old coins. I don't check on it every day, or week, or month, or year, but I really don't care about the long term stuff, I am focussed on the long term. Looks like I have found a perfect trick to not worry.
I am not "ultra" diversified, but some billionaires have hinted that diversification may be for idiots. If you saw Ray Dalio present his "holy grail" you know that (roughly) you get a huge improvement in risk adjusted returns going from 1 to 5 (good) positions, a little more improvement going from 5 to 10, and it basically flatlines past 10 positions no matter how much you add. This is universally true, I'm sure it can be proven by a mathematician and the limit of growth will be Euler's number 2.718 (like maybe the stdev can only be improved 2.718X?), no matter how many uncorrelated positions are added. The reasons for having dozens of positions is either you're such a whale you have to, or you're trying to attract clients and plenty of positions makes you look pro and justifies the cost and also makes it look too complicated to do for a novice.
My positions shown here are all short term, with:
FX and Commodities and Stocks (65%) all under 2 months
S&P500 and Crypto (35%) all under 6 months
I have been long US indices since September or October of 2020 but it was tech100 and I closed it all since then.
33% of my holdings are correlated to the US stock market but I am in the green on the S&P and have guaranteed stops, I have pyramided into my winner over time, so there is actually no major risks there. I am not a professional risk manager and I don't give advice but I don't think I have crazy risks.
No single instrument (a currency, an indice) ever has a leverage over 5 (when adding all pairs or all correlated indices). The max leverage I have been using on a position ever as far as I can recall is 2 (0.25% stop loss with a leverage of 2 = risk of 0.50% on the single position). Anyone who understands elementary school level maths should be able to understand the problem with too much volatility:
A 3% drawdown takes a 3.09% profit to get back to breakeven. This is 3% more (3.09% is 3% more than 3%).
A 10% drawdown takes an 11.11% profit to get back to breakeven. This is 11.11% more.
A 30% drawdown takes a 42.9% profit to get back to breakeven. This is 42.9% more.
A 70% drawdown takes a 233.33% profit to get back to breakeven. Good luck.
Simply since this is short term there will be much more volatility, so careful with leverage! (Indeed, if a long term portfolio had say 15% deviation happen every 100 years, the short term one could have this every 100 months or even 100 weeks).
And then there are the black swan events... They don't happen but when they do it stings. And in one's career they WILL happen.
Bill Hwang got destroyed by having 5 leverage on all his money, concentrated in a few stocks. The "Swiss Franc Tsunami" was a 15% drop. You'd have to be a complete mongrel to get wiped out, that would require over 6 leverage on a single currency. Legend james Cordier had next to 100 leverage divided between only half a dozen commodities, he was riding at least a 10X on NatGas alone. Even if you had 10 leverage on stocks but distributed in 10 a 20% gap down wouldn't wipe you out it's very unlikely they ALL gap down. Don't go 10X in stocks even if diversified, that was just for the example, in the EU it's not even possible anyway max is 5.
I even posted ideas for some of those positions
With Bitcoin I think I post everything. Not sure.
Almost 1 year ago, "buy area visited", hah I actually bought the very bottom. As I said this is nearly 1 year old but I moved to the S&P500 back in April to catch a new swing. 2 different trades within a long term bull bias. Buying pullbacks with tight stops you get stopped often but you also buy the very bottom often. I probably mentioned my transition to the S&P500 somewhere but without details and I don't write every single time I add or take profit or reduce my position.
Might add a bit to crypto if it keeps going. Hopefully I get to short GME soon, should reduce my overall stock risk, maybe. It can always shoot up while the rest crashes down, I don't think this is likely it's a 1/100 thing, it does happen, and you want to make sure you'll survive it, but it doesn't happen that often so it's worth taking the risk.
Typicall I might have something like this:
10 positions
2 wins I'm trailing (> 5R)
3 little wins trying (2.5-4.5R)
5 positions around my entry (between -1R and 2.5R)
I rarely see red in my accounts, losers go quite fast. So mostly I look at positions in the green. It has the benefit of feeling good. Losers hold losers, that simple.
Individual positions are very volatile, I might see a currency pair have a drastic move against me and crush my soul, but then I log in my accounts and I see my overall profits have not moved much, while the 1 pair was crashing 3 other ones sligthly went up. So it makes it more of a slow and steady growth rather than some hysterical bipolar game.

Impact of Trading Costs on 2% Max RiskRecap: Price is still within Decision 1 and 2. The analysis side of this post is of what is happening in that area and how minor levels are being formed. Money Man hopes that it is self-explanatory, especially to those who follow his normal analyses. But he also wants to elaborate on the previous “2% Max Loss” ed post. It is linked below and built on other ed posts linked there. Disclaimer – You should let your own mind work through this if you take your money seriously.
This is not to be used as a quick reference but is a rough illustration as to effects – something for you to mull over if you have not already. Money Man sat down and drew a rough graph comparing trading costs of 0% (in green), 0.5% (say 0.25% to open trade and 0.25% to close it again) (in orange) and 1% (in red) total trading costs (what the exchange charges / spread). Basically, putting trading costs on top of a 2% Max Loss graph.
If you are to follow the 2% Max Loss route, or whichever percentage, then what would strike you is how the effect of % trade costs grow with trade size and affects it. It sounds obvious and why write a post about it? Again, Money Man’s aim is to illustrate how awareness can temper decisions.
A quick conclusion would be how the possible negative effects of short term (overtrading) with big size, even with 2% risk management, gets amplified by trading costs. Also, how costs hamper the amount you can risk and how it thus then hamper your possible gains beyond simply an upfront cost, but in a risk management environment, what you ultimately can risk.
Various exchanges have various cost structures, and many hit the small volume trader much harder than the big volume traders – they want the liquidity and market makers. The structure is normally stepped and the change from one costing level to another is high.
Conclusion: Do not be confused by all this. Simply follow your risk plan. Consider that say 2% risk on every trade is not the same as 2% for the week, etc and decide if you want to build the costs into your trading before you make a trade. The saying that comes to mind is: “If you are not calculating the costs of your trading; somebody else is”. Remember: No guarantees, only probabilities. Very Important to me: Please like if you appreciate the effort, Please comment and develop this further and Please follow if you see this analysis thread going somewhere you would like to know about.

Position Size Calculator (Use It On All Trades)Example CADJPY daily setup is a swing trade using the position size calculator, on chart.
This should be down on all trades down, for risk management and to trade Forex for a lifetime and be part of the winners in trading.
Yes, this example is on daily, but practice on 4 hour, 1 hour or lower charts using position size calculator.
There are several free ones online, fine one you like and book mark it for easy access when needed. Good Luck.

Supply Zones & Demand Zones (Where Swings Happen)Supply zone are areas of resistance on charts which price action reverses at a swing point and goes bearish and Demand zones are areas of support on charts which price action reverses at a swing point and goes bullish.
Once Big Banks have consumed all of the SELL ORDERS- from a demand area price action will go up. No sell orders left, sharp move up. This is so that Big banks can move market quickly consuming buy orders along the way to their targets.
Once Big Banks have consumed all of the BUY ORDERS- from a supply area price action will go down. No buy orders left, sharp move down. This is so that Big banks can move market quickly consuming sell orders along the way to their targets.
Price action is #1 (ALWAYS)- Big banks will range for as long as they need to do accumulate positions for what direction they take Forex pair in future, that is why use the COT REPORT (to get a heads up on this information and to keep you trading with them not against them (which is a failing/gambling trading)
There are major supply and demand zones on higher time frames on 4 hour or higher charts (used for swinging or daily time frame trading) and minor supply and demand zones on 1 hour or less time frames (used for scalping or day trading)
Using supply and demand zones should be part of your normal practice and trading, they will give you possible entries and targets. You can tell weak and strong supply and demand zones, by how easily price action goes thru it and/or stops (makes a base at) or reverses at... They tell you a lot in Forex trading.

Breakout & Return Strategy (#1 Setup)Example is on CADJPY 15 minute example chart. This is #1 best risk to reward setup for retail traders- scalpers and/or day trading. The noted risk to reward on chart example was 1:2 or 20 pips stop to 40 profit or target. Use this with engulfing, harami or pinbar candlestick(s) setups. good luck.

How To Trade High Impact Expected USD News (Patience)When USD news comes out before a 4 hour candle closes, I use discipline, patience and wait. A Lot of high impact expected news hits at 5:30 am (PST/USA) when New York session opens. This is London session and New York session overlapping 4 hours which I think is best 4 hours of day to trade.
My Rules Area: (USD high impact expected news)
1) Use either a 5 minute or 15 minute time frame to trade on.
2) I use forexfactory.com for my news and results.
3) Use a highly traded USD currency (like Eurusd, UsdCad, UsdChf,Gbpusd or Usdjpy) to trade with.
4) If high impact news hits at 5:30 am---- then EURUSD example on chart (8/12/21 PPI mm) --- comes in---> refresh page and get results.
Results were USD positive: actual 1.0% and forecast was 0.6% so was higher then forecast and/or expected, so USD shows strength, if you are trading the following pairs EURUSD , USD,AUD, GBPUSD, should go down, USDCAD,USDCHF & USDJPY should go up- related to USD high impact news results.
5) If high impact expected USD news hits prior (5:30 am PST/USD) to a 4 hr candle--I WAIT for top of hr of 6:00 am -10:00 am candle for any new trades.
Why? let both spreads calm down to a normal range and all of the scalper traders clear out, to set up any possible further trades. This gives you 30 minutes to set up whole trade: Entry, Stop Loss and Targets for this. Remember EURUSD only has an ATR of 53-60 for last 5 weeks, so stops/targets are close.
Chart set up is: 5 stop loss vs 14 pip target. Note high impact USD expected news was positive, so set up a bearish or sell trade with EURUSD. *Trade was entered on reversal of 5 minute DOJI candlestick right start of new 4 hour/6:00 am (not shown related to short time frame for TV/public to look at). I use both 5 minute time frame and 15 minute time frames to trade high impacted expected news on. Note: Price Action & Risk Management ALWAYS!!!

Trading Psychology Is Worth 95% To Overall Failure or SuccessThe Cold Hard Truth
"You Are You're Own Worst Enemy"
You will probably develop technical skills required in placing trades and learning money management. But you constantly end up sabotaging yourself.
What Is Trading Psychology?
Knowing when to quit and when to push
Using a stop losses
Hitting targets
Controlling greed, fear and hope
*Discipline, Discipline, Discipline!
If you want to be 10% successful FX traders then do the following: Have a trading plan and view, have money management rules, have emotional control, each trade is unique and has nothing to do with last trade, you do not revenge trade, you only trade during certain times not 24/7 & review trade results.
Do opposite of above if you are part of the FOMO traders whom do not treat Forex trading as a probability based business but as gambling.
Note: If a Forex trade is not doing what and when you want it too, then FIRE it ( get out of it), you are the BOSS.
Have a detailed trading plan. More specifically have a detailed set of money management rules within a trading plan to take control over EMOTIONS.

8 WAYS TO IMPROVE YOUR TRADING | Tips From Experienced Trader 🤓
In my years in trading, I’ve been approached by the new and semi-experienced traders for help and advice, and that's how it's supposed to be. Those that «have become» help those aspiring ones.
Then I thought that tens of thousands of people are joining tradingview every day, and most of them are beginners and inexperienced traders, So I decided to share some knowledge here with you today. Condensed wisdom of years in trading. 🦉
You see, trading is unique in that it is accessible to people of all walks of life. Your previous education, social status, and other barriers, that might prevent you from entering some industries are completely absent in trading. The only tool you need is your brain, as trading is essentially an exercise in pattern recognition and our cognition is based on pattern recognition and the endless chain of association.🧠
So the CORE is your ability to learn and recognize patterns, and everything else gets added like pearls on the string. Master these KEY points below, and the Gods of trading might smile at you!
✏️🗒️ MAKE A TRADING PLAN - Develop a strategy!
This bit seems obvious, yet so many traders arrive to this idea only after losing their first account. Don’t be like that, and you will lose your first account much slower. Research all the main strategies that are out there, and dive deep into the one you found appealing(for any reason). This step might take a year or even more, yet, trust me, this will be time well spent. I would advise simple multi-timeframe top-down technical analysis. I might be biased, as that’s the strategy I use myself, but learning it will give you the basics that you will NEED ANYWAY, whichever strategy you will end up using later. Also, I would choose it because it is intuitive and simple to use. You will be able to identify key levels on the chart after a week of staring at the charts and then work your way up, polishing entries, adding indicators if you like.
🔁 Review your plan after every trading session!
After you started trading, even on a demo, DO YOUR HOMEWORK, or else all the trading that you do is in vain, and you will NEVER LEARN. Start your day by reviewing the previous day’s trades, as you will have a fresh perspective that isn’t clouded by emotions of the moment. This WORKS WONDERS! Have a diary with trades, write down your thought process of how you arrived at the particular trade. Then write down your assessment of the next day nearby. Several months' worth of a journal like that is a GOLD MINE, where you can mine data, looking at what works, what does not, etc…
⚠️ DON’T RISK MORE THAN YOU CAN AFFORD TO LOSE - Protect your positions!
USE STOP LOSS and place it the moment you entered the trade. Don’t let your mind play tricks on you. As your inner voice will tell you «Why SL? I will close that trade manually, If I see that I was wrong» Nah, you won’t. You are kidding yourself. So DO use SL, don’t give your money to the market makers!
💯 Don’t risk more than 5% of the account!
Now that we know we need to use SL, I strongly advise you to never risk more than 5% of your account in one trade. In fact, I do not risk more than 1% per each trade myself. Use a lot calculator to help you determine how much you are risking in dollar value per trade. It is a bit boring, but will save you a ton of money!
And who said trading needs to be fun, huh? You are a grownup and it's your job!
😌 BE DISCRETE AND DISCIPLINED -Once you have the system, don’t overthink it!
After you mastered your system, backtested it on multiple pairs and begin trading on demo, stop worrying about whether the strategy is good or bad. You chose it, it showed results on the backtest, now get out and test it on the market. Time will show if your choice was correct.
📜 Follow the rules and reflect on the results later!
Once the system is chosen, make the rules that are as simple and clear as possible so that you could approach each trade with a ready-made algorithm. This will take a lot of stress off your mind.
💢 CONTROL YOUR EMOTIONS - Too much anger or excitement alike hurt your trading!
Having a strict algorithm helps massively, and when trading you need to learn to abstract yourself from the monetary values on the screen. These are just numbers, and you are playing a game of probability, so there will be winning and losing streaks. Learn to treat both with indifference.
🌁 Play it cool!
Trading is a battle of wills. Whoever has the hardest balls wins. So be cool!
⌛️ BE PATIENT - Keep your eyes on the big picture!
When even considering trading as a potential career, please accept the simple fact that there will be losses, a lot of them, all the time. You will NOT be making money for quite some time. Accept it as part of the game and it will be much easier for you physiologically. If you come with the make easy money fast mindset, you will lose!
🏅 Winning takes time!
I’ll stress it again, learning trading will take a lot of time, and there are some hard times ahead of you, so prepare for this beforehand, and no, you are NOT unique or special, so you will have to go through the same trial and error ordeal as others. There are no shortcuts.
✔️ ACCEPT YOUR LOSSES AND MOVE ON - Remember that you are in this for the long haul!
When feeling down because each trade this week was a losing one, imagine yourself free from the location, from your job, from all the constraints that usual people have, and remind yourself, that that’s exactly what you are working towards, because the moment you can make stable returns, you can multiply your income by a factor of x10 overnight. It might be a factor of an x100, it just depends on how big your balls are. So whenever you want to quit, think of what life could have been like if you persisted!
🚫 A loss is a part of the learning process!
You will lose multiple accounts. There is no way around it! This is your way of learning, and no one has created a different one so far. You might be as good as a God on demo, but the moment you enter the real world emotions kick in and you will have to learn a lot again. So when entering trading, be prepared to pay the market a fair price for educating you. And remember that the reward is much greater still!
📰 READ THE NEWS - Current events can affect the markets!
This one is certainly not for beginners! If you start doing that from the start, it will be too much info for you and you will get lost in the constant swirl of hot air that surrounds the markets. But once your strategy is good enough and you are beginning to be profitable, you might want to start paying attention to the key events and dates that might have an effect on your trading. I never actively trade fundamentals myself, but who said that you shouldn't?
🤏 Keep in mind big political events that can cause big moves!
This! If the FOMC meeting is tomorrow, you better close all your positions today, because whatever analysis you made might get invalidated by what the FED minutes bring to the market. We are playing probabilities that we can predict based on past experience, but whoever is trying to predict the FED and the market's reaction to it is fooling themselves, so once such a whale enters the room our ability to predict rationally vanished, thus we need not trade that day at all. And the FOMC is just an obvious example. Important statistical data such as CPI, jobs, etc might affect the pair you are trying to trade, and you better know about it. As a famous trader’s saying goes «Not being in the Market Is a position too»
🆕 UPDATE YOUR TECHNOLOGY - Slow internet connection or an old computer might make you miss your trade!
There is a side note yet do not neglect your workstation. Don't let it be dirty or messy, and make sure your equipment, i.e. a computer or a smartphone work properly. Missing a trade because of a bug is SUCH a pain! You don’t want that, right?
📈And not trading update charts is even worse as some level breakouts can happen in seconds.
That one is less relevant today thanks to tradingview charts being awesome, yet always make sure that the data on the chart is given to you without a delay. Trading a setup that ain’t there anymore is not good…
🦉📚 These are the «words of wisdom» that came to my head today, and I really hope I helped some of you get back on track, or begin your path as a trader with a slightly better understanding of what is ahead of you.
❗️ JUST REMEMBER: IT IS POSSIBLE! But it will take time, money, and effort, so brace yourselves, and may the odds be always in your favor!
💖Adios, Amigos! Give me a like and comment, if you agree with what I said!💖
