Engulfing Candlesticks (2 of 3)Engulfing Candlesticks
The other important candlestick pattern I think price action traders need to have knowledge on is the engulfing candlestick. Like pin bar the engulfing candle is a reversal pattern, which means that a reversal is supposed to take place immediately after you see one form in the market. Unlike the pin bar the engulfing candlestick is a two bar reversal pattern, a pattern which requires there to be two candlesticks present in order for it's formation to be complete.
The formation of a bearish engulf is always a signal that a reversal to the downside is about to take place. The pattern itself consists of two candlesticks.
The bearish engulfing candlestick itself, which I've marked with an arrow, and the bullish candlestick that formed an hour before. The bullish candle is first candle required in the bearish engulf setup. This is the candlestick which the market will always engulf with a bearish candle immediately after it's formation.
In order for a bearish engulfing candle to form, a bullish candle must have formed immediately prior. You can't have a bearish candlestick engulfing another
bearish candle, it has to be a bullish candle in order for it to be a bearish engulf.
Bullish engulfing candlesticks are of course the opposite to bearish engulfing candles, which means their appearance is a sign the market is going to reverse
to the upside. Like the bearish engulfing candle they are also a two bar pattern, but instead of the first candle in the pattern being a bullish candlestick, like we see with the bearish engulfing formation, the first candle in a bullish engulfing setup will always engulf a bearish candle. A bullish engulfing candle cannot engulf another bullish candle, it can only engulf bearish candles.
Engulfing candlesticks are best used as signals to enter trades at pre-existing points where you expect the market to reverse, such as support and resistance
levels or supply and demand zones. They can be traded on their own without any other confirming factors being present, but in my opinion they don't tend to work out as well as pin bars do.
Risk Management

Pin Bar/Hammer Candlestick (Part 1 of 3)The pin bar is a single candle pattern which can be found forming across all currencies and all time-frames in the market. It falls into the category of price
action reversal patterns due the fact it's appearance is supposed to be a signal a reversal is going to occur. Although it must be said that very few pin bars actually cause large reversals to take place in the market, (I'll explain why in a minute).
Like most price action patterns the pin bar comes in two varieties:
The bullish pin bar, which signals a reversal to the upside may be about to take place, and the bearish pin bar, which is a sign a reversal to the downside is
probably going to occur. You can see that the vast majority of these bullish pins did cause the market to reverse once they had formed, but they didn't all cause it to reverse for the same duration of time. Some caused large upswings to take place whilst others only created small retracements.
Again, you can see that the pin bars which formed on here also caused reversals of varying sizes to take place. The reason why pin bars cause different sized reversals to occur, is because of the action that caused the pin bar to form in the first place. Pin bars and all the other candlesticks you see forming on your charts, form as a result of traders making decisions in regards to the market price. Pin bars happen to form exclusively from the bank traders either placing trades because they want to make the market reverse, or from taking profits off trades which they've already got placed.
The reversal created by the pin bar which has formed as a result of the bank traders taking profits off their trades, is naturally much smaller than the reversal caused by the pin which has formed from the bank traders placing trades to make the market reverse. It's obvious why this is, I mean if you took some profits off a trade you would want the market to continue moving in the direction to which your trade had been placed so you could make more money from the trade. The bank traders want the same to happen when they cause a pin bar to form from taking profits off their own trades, which is why the reversal caused by some pin bars forming are much smaller than the reversals caused by other pins forming.
Bullish and bearish pin bars are really good reversal patterns to watch out for if you're a price action trader, but they must be traded in the right way and you must understand why they form in the market. Most of the books and guides out there on pin bars do not teach traders what causes them to form, when it's knowing what causes them to form that will allow you to determine which pins have a high probability of working out successfully.
Head & Should Pattern (How To Trade)The Head And Shoulders Pattern
The first price action reversal pattern we're going to look at is the head and shoulders pattern. Without doubt one of the most popular and well known price
action patterns in the market, the head and shoulders formation is one which all price action traders need to memorize and understand if they want to become
good at spotting reversals using price action. As you've probably already guessed, the head and shoulders pattern is a reversal pattern which has a swing
structure very similar to that of person's head and shoulders.
You can see from the image the structure of the pattern does bear a striking resemblance to somebody standing up with their head straight and their
shoulders level with one another. Most head and shoulders patterns are supposed to look like the one you can see in the image above, but a large
percentage of them will actually have features which are a little different from one another. For example, you might see a pattern form with one of the shoulders being a little bit higher than the other, or the distance of two shoulders from the head will be smaller or bigger than what you can see in the pattern above. These small differences do not alter the pattern in any meaningful way. So long as the head is always found in the middle and the two shoulders are found to be either side, it's a head and shoulder pattern.
If the high of the right shoulder is found to be below the swing low of the move up which created the head, then it's not a head and shoulders pattern and should not be treated as such.
Rules:
1) measure from top of head to neckline for excepted target goal, once price action breaks neckline.
2) These patterns are infrequent, but powerful on 1 hour or higher time frames.

Alert-Confirm-Enter StrategyThe A.C.E. strategy is one of the easier ones to do if you scalp or day trade in Forex.
A- Alert Candle 1st one
C- Confirm Candle 2nd one
E- Enter Candle 3rd on
This can be done on bearish an bullish set ups:
1) ALERT- Look for the last trend ending candlestick. 1st candlestick (which is part of three bar pattern)
2) CONFIRM- Look for a longest trend ending candlestick (doji, pin bar, harami etc... (2nd candlestick)- top of this in bullish reversal is enter price and bottom of this in bearish reversal is enter price.
3) ENTER- Look for 3rd candlestick to go into new direction breaking top (bullish) or bottom (bearish) of 2nd candlestick to Enter trade.
4) Put stop loss above top of bearish trade or below bullish trade. For trade on 1 hour chart, I like 20 pips, with a 1:2 or higher risk reward setup.
Please look at example chart and look for many more on other one hour charts for pairs you trade. Keep trading as simple as possible. GbpAud.

The Death of Buy-and-Hold reduxAs a follow-up to my previous article, “The Death of Buy-and-Hold” , Bitcoin in these last four months has demonstrated quite vividly to us the error of that outdated methodology, that Buy-and-Hold is truly dead and technical trading is superior to what is called “investing” today.
In the two month period from February, 2021 through April, Bitcoin enjoyed a meteoric rise, gaining 100% in value during that 60 day period. However, as they say, “The bigger they are, the harder they fall…“ And fall it did… Bitcoin gave back every penny in the following two months crashing back to its February levels.
The most profitable, reliable, and consistent trading systems available to the average investor, as I demonstrated in previous articles , are those systems based on "supply and demand" methodologies. We can’t fight the hedge funds. We can’t fight China. We can’t fight the “whales” of the crypto market.
… But we can follow their footprints as traders .
I backtested Bitcoin based on my own proprietary supply and demand methodology, but I would assume that any supply and demand system would achieve similar results because we are all chasing the same protagonist (or antagonist, depending on how you look at them).
The results: From January 1, 2021 through June 22, buying and and holding Bitcoin would’ve net a zero return for the investor! Following a supply and demand methodology, however, the casual trader who might work on the 4 hour charts, checking in on their account once or twice per day, I identified 11 trading opportunities which resulted in a net profit of 42 percent .
Why would the investor make zero and the trader make 42%? Buy-and-hold only works in one direction… When the product gains value. Supply and demand trading lets you profit rain or shine, by the day or by the hour, in good times and bad.
I bring this up, not ultimately as an "I told you so" but as an encouragement: Yes, indeed, it is possible to pull a reliable, steady income from the markets, from the cryptos , from the indexes , from the commodities , rain or shine, week after week, once you learn to "see the money flow" and follow the trail as a trader .
One does not have to have their livelihoods be subject to the whims of the economy, of policies imposed by public officials, of Tweets from CEOs, from natural disasters, from supply chain disruptions, the whims of totalitarian nations, nor an employer, employees, or customers.
Most importantly, Supply and Demand trading protects us from the large financial institutions who regularly engage in Market Manipulation , whose tactics include fear and greed news cycles, whose analysts and "experts" foment 'sentiment' among their viewing audience, whose priority is to broadcast information that will financially benefit themselves, and not their viewers.
Trade well!

It always works the same way...Human-sheep hybrids psychology.
No matter where I look I see the same flaws manifest in different ways
A quote
By 1998, Yahoo was the beneficiary of a de facto Ponzi scheme. Investors were excited about the Internet. One reason they were excited was Yahoo's revenue growth. So they invested in new Internet startups. The startups then used the money to buy ads on Yahoo to get traffic. Which caused yet more revenue growth for Yahoo, and further convinced investors the Internet was worth investing in. When I realized this one day, sitting in my cubicle, I jumped up like Archimedes in his bathtub, except instead of "Eureka!" I was shouting "Sell!"
The majority just ends up becoming bagholders one way or another.
Here are comments on the housing bubble from 2006
" Since the early seventies, our economic expansions have really been credit bubbles in disguise, and they have been paid for by inflating the money supply. The net result each time has been a reduction in the middle class standard of living. In the sixties, the family could easily make due on one income; do the math today…dual incomes aren’t enough now. "
thehousingbubbleblog.com
The lucky investors are the ones whose invetment falls like a rock and goes all the way to zero because they panic sell.
The unlucky one are the ones for who the price slowly falls and keeps giving them copium.
Virtually no one manages to make money trading, but they all manage to reach their primary goal which is to feel like a trader.
Technically humans are less able to adapt to gradual change than frogs, so the expression boiling frog is not that accurate.
Humans are huge bagholders with herd mentality. Some are bigger bagholders and more easilly enslaves.
Funny how it's impossible to find any useful tangible info on the subject on the internet you just get drowned in a sea of ideology propaganda.
The Milgram's experiments on obedience to authority are also interesting to read about. The vast majority complied with it, and even 65% went all the way to the final 450 volt death sentence.
What's great about the Milgram's experiences is they were used to criticize the holocaust (for stupid people that want to report me: I'm obviously not saying criticizing it is a bad thing), and they fall in line with the western ideology, so we can find plenty on the subject and read about it. That's their greatest quality: we can actually freely read about them.
You can't read (In Germany and France at least) anti LGBT research, articles, stats. That is illegal and incitation to hatred.
Spitting on a religion and printing drawings of the prophet sodomizing a sheep, which directly incites to hatred both in the arab world and in the west where people's head are cut off, is legally NOT incitation to hatred .
I'm just saying... You're in China you won't read about Tiananmen Square. The west used writtings and research by Gustave Le Bon and other guys I forgot the names of, that did a great job on herd mentality, propaganda, compliance, etc, and good luck finding much about it... Anyone that talks about it won't go to jail but will be a "crazy conspiracy theorist" and the herd believes it (they literally use the tactics they are accused of to silence critics it's hilarous).
With herd mentality did you know you could move a guided robot that looks like a sheep and the whole herd will come running?
It is also possible to use this to remote control fish in an aquarium? It is very fun.
It works the same way from humans but slighlty harder or more subtle.
For example the vast majority in urban areas will walk by someone dying on the ground, but if 1 person stops to help then the crowd stops too.
For example in a crowded area if people see 2-3 people run for their lives the whole crowd will follow, in that case the crowd might have to even the non-sheep.
In open concerts you start with a few weirdoes dancing and once the trend starts the crowd quickly dances and befor you know it the people not dancing are the weirdoes.
Bitcoin investors were considered idiots by "normies" or sheeple if you prefer, and somewhere between 2012 and 2017 investing in BTC became the norm and the skeptics are the idiots.
These herd trends look like the growth of a bacteria population (or viral pandemic), also appear in markets, but this is a story for another time.

📚 Leveraged & Margin Trading Guide + Examples ⚖️
Leveraged trading allows even small retail traders to make money trading different financial markets.
With a borrowed capital from your broker, you can empower your trading positions.
The broker gives you a multiplier x10, x50, x100 (or other) referring to the number of times your trading positions are enhanced.
Brokers offer leverage at a cost based on the amount of borrowed funds you’re using and they charge you per each day that you maintain a leveraged position open.
For example, let's take EURUSD pair.
Let's buy Euro against the Dollar with the hope that the exchange rate will rise.
Buying that on spot with 1.195 ask price and selling that on 1.23 price we can make a profit by selling the same amount of EURUSD back to the broker.
With x50 leverage, our return will be 50 times scaled.
With the leverage, we can benefit even on small price fluctuations not having a huge margin.
❗️Remember that leverage will also multiply the potential downside risk in case if the trade does not play out.
In case of a bearish continuation on EURUSD, the leveraged loss will be paid from our margin to the broker.
For that reason, it is so important to set a stop loss and calculate the risks before the trading position is opened.
❤️Please, support this idea with a like and comment!❤️

👶 Trading For Beginners | ORDER TYPES 👦👧
There are multiple ways of opening a trade in a trading terminal.
Here is the list of universal order types that you MUST know:
1. Market Order
A market order is a trade order to buy or sell a desired financial instrument on a current market price.
In such an order type, the price is determined by the market.
Constant price fluctuations and spreads make market order quite risky way of opening a trading position.
2. Limit Order
A limit order is a trade order to buy or sell a desired financial instrument at a specific price level. It allows the trader to enter the market on a strict price level ignoring the price fluctuations and spreads.
A limit order can be referred to as a buy limit order or a sell limit order.
3. Buy/Sell Stop Order
Buy stop order is used to buy at a price above the market price, and it is triggered when the market price touches or goes through the Buy Stop leve.
Sell stop order is used to sell when a specified price is reached.
The selection of order types is based on a trader's trading style.
Let me know in a comment section which order types do you apply in your trading!
Please, like this post and subscribe to our tradingview page!

Last Two Hours Of London Session StrategyThis is how to go about trading this last two hours of London session strategy: Works on all Gbp and Eur pairs (and all Major pairs with USD).
This is either a scalp or day trading that will reverse mostly direction of current trade (sometimes continue) daily trend for 20 to 40 pips, during last two hours of London session.
1) First look at 4 hour time frame charts ( for trend, momentum and if pair is on support or resistance, etc..)
2) Then enter and exit of either the 5 minute time frame for best entries or 15 minute time frame.
3) I use 10 to 12.5 pip stop loss with targets 20 to 40 pips away depending on ADR (average daily range) of pair and where price is currently at in master Forex cycle of day or week.
4) With right stop, entry and targets this will give you a high winning rate (mostly reversal of daily trend) quick or around two hour profitable strategy, with right risk management. Please back-test.
The example chart is on a 15 minute chart related to Trading view not being able to post for public 5 minute charts, but mostly you want to enter and exit all trades via 5 minute frame for this two hour before London close strategy.
Would have been a 1:3 risk reward and or 10 pip stop vs 30 pip target- that is great within two hours. On the current example GBPCAD chart.

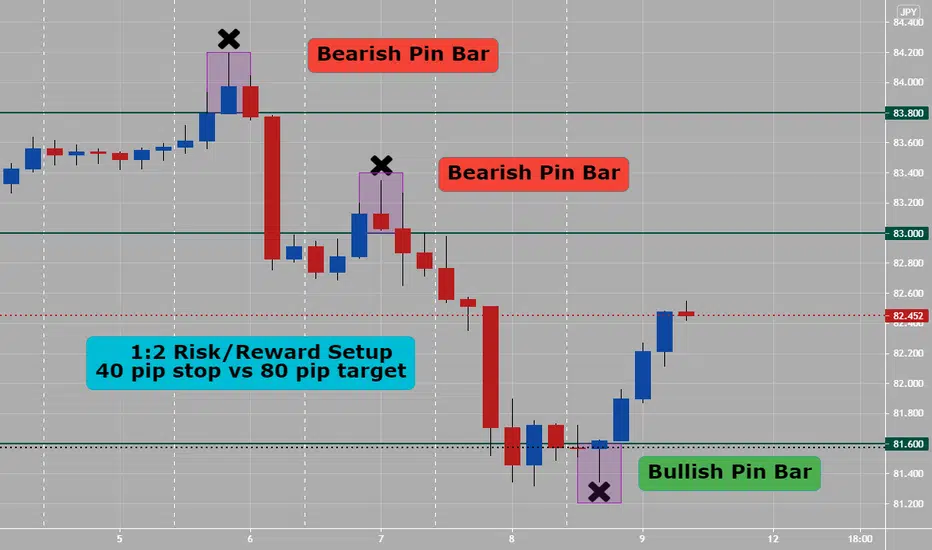
How To Set Up A Trade On Hour ChartIf you have a $5,000 account (USD currency)- want to trade Aud/Jpy currency with a 2% risk, what do you do? You need to know trade size on all pairs and pip value, so you can set stop loss, entry order and take profit/exit order- per your trading strategy and risk management tolerance.
1) go to Forex pip calculator online
2) Aud/Jpy current value of a pip Value of standard lot (units 100,000) is $900.45< yes, that is right!! What they are saying is every pip the AJ pair moves on a standard size is a $900 USD move (Crazy) Can you trade this lot size? NO. How about Micro Lot (units 1,000)? yes, pip value is $9.00.
3) On one hour AJ pair example chart, there are three noted trades: two bullish (1st and 3rd) and one bearish (2nd).
4) If you catch all three trades with by placing a 1: 4 Risk/Reward setup on them. What does that mean? (stop loss is around $100 per trade, related to 2% of account if you have $5,000 USD)- As your account gets higher, lets say $100,000 USD or more, even 1% would work- but to each their own)
5) Your stop loss is over entry of any bearish trades or under entry of any bullish trades by 10 pips or ($90.00 of risk) to make 40 pips or ($360.00)- possible on all three noted trades on chart. If you would have hit all three trades just right, you would have been in the money after two days around $1,000 USD with only risking 2% of your account. This is how the turtle beat the hare in Forex trading race- slowly but surely. If you trade micro lot of 500 units, you could have a larger 20 pip stop stop (around $100) and 40 pip targets would with a pip value of $4.50 instead (trade conservatively until confidence grows)
Put yourself in best position for success in Forex trading: Before any new trades know where to put stop, entry and profit orders. After your trade is active just let it play out, because the market is out of your hands at that point. Note keep in mind: right pair, right price, right session & right time.

Shooting Star (How To Trade)Bearish Shooting Star
When it occurs, it will be at the height of a current uptrend
— typically an extended trend. It’s a lot like a shooting star falling from the heights of the heavens. At the end of that trend, the stock experiences one last
effort to push higher, only to reverse on itself. Hence the name, shooting star. It goes up, only to fall back.
Entry
Where would you enter?
More aggressive traders may anticipate the reversal as the candle is forming. Otherwise, you can wait until the close of the shooting star, enter, and set your stop at the high of the shooting star candle.

Risk Management in Price Action TradingRisk Management in Price Action Trading
Risk management in price action trading is much like risk management in any other style of trading; the same basic rules apply:
1. Know your maximum risk tolerance, i.e. the loss you are willing to take on each trade, before you place the trade. A common rule is that traders will not put more than 2% of their funds in the market at a time.
2. Understand correlation between assets, and to what extent you would like to be diversified.
3. Know when you will exit before you enter.
4. Know your reward/risk ratio.
5. Identify what you expect to happen and why, and what price point negates that expectation. This is the price point at which you should put your stop.
Of course, with risk management, techniques are important, but, ultimately, it is up to the trader to ensure they are psychologically prepared for all that is involved. Even if a trader is using a fully automated system, he/she must still have confidence in the system, and must know when any losing streak experienced is just a temporary losing streak versus a more fundamental problem suggesting the system is no longer valid.
In terms of actual techniques, there are a few concepts traders can bear in mind:
1. Enter at support/resistance levels, or levels that suggest turning points in the market
2. Put your stop loss between such levels, or at points where there is no real signs of a force that will cause a change of direction in the market.
Basically, traders want to enter at turning points. Levels between turning points, “empty zones,” of sorts, are where stops can be put as they are where ideas are often disproved. For example, if you entered a trade at a support level expecting price to rally, you could place your stop at a level sufficiently below the support level you entered at, provided it was not a support level as well.

What Is Price Action Trading?What is Price Action Trading?
The “Price Action” method of trading refers to the practice of buying and selling securities based on the fluctuations, or “action,” of their prices; typically the data of these price changes is represented in easily-readable candlestick or bar charts, which are the bread and butter of the price action trader.
Traditionally, price action traders rely on a “naked” chart – they reject the inclusion of indicators with the conviction that, since all supplemental indicators are necessarily lagging interpretations of the basic data available on the price chart, the action of price is itself the most reliable and accurate indicator.
The patterns of price movements reveal in real time the balance between the supply for sale and the buying demand of any given security or currency pair. Any price change implies a shift in the relationship between buyers and sellers; an increase in supply will push price down, whereas an increase in buying demand will send price higher.
The price action trader bases their trades on predictions of whether buying demand is greater than the supply of sellers – and therefore price is poised to head higher – or vice versa. In the Forex market, this means that a trader will endeavor to buy (or “go long on”) a currency pair when the base currency, the one quoted first, is likely to appreciate against the counter currency, the one listed second; conversely, they will sell (or “go short on”) a currency pair wherein they expect the counter currency to appreciate relative to the base currency.
In order to make these predictions, price action traders interpret the confluence of many factors, particularly trends, candlestick patterns, and price levels known as “support and resistance.” The risk management practices are essential to profitable trading.

3 Bar Reversal Pattern strategy 3 Bar Reversal Pattern strategy
Great to trade the M.A.T. strategy or three bar reversal pattern. Measure-Apex-Trigger (three bars)
Find an establish trend either bearish or bullish.
This reverses trend into a new trend into other direction
Rules:
1st candle: Measure Bar- last trending candle before low of trend (apex candle)
2nd candle: Apex Bar (lowest bar in downtrend or highest bar in upper trend)- used to enter new trend going opposite direction
3rd candle: Trigger Bar- makes a new high into bullish trade or new low into bearish trade.
Use Apex bar (lowest candle) open for reversal trades going against established trend into new direction
Chart example is 1 hr on EurAud would have give you a 1:2 setup of risk/reward using right risk management during this bullish trade today.

📚 Leveraged & Margin Trading Guide + Examples ⚖️
Leveraged trading allows even small retail traders to make money trading different financial markets.
With a borrowed capital from your broker, you can empower your trading positions.
The broker gives you a multiplier x10, x50, x100 (or other) referring to the number of times your trading positions are enhanced.
Brokers offer leverage at a cost based on the amount of borrowed funds you’re using and they charge you per each day that you maintain a leveraged position open.
For example, let's take EURUSD pair.
Let's buy Euro against the Dollar with the hope that the exchange rate will rise .
Buying that on spot with 1.195 ask price and selling that on 1.23 price we can make a profit by selling the same amount of EURUSD back to the broker.
With x50 leverage , our return will be 50 times scaled .
With the leverage, we can benefit even on small price fluctuations not having a huge margin.
❗️Remember that leverage will also multiply the potential downside risk in case if the trade does not play out.
In case of a bearish continuation on EURUSD, the leveraged loss will be paid from our margin to the broker.
For that reason, it is so important to set a stop loss and calculate the risks before the trading position is opened.
❤️Please, support this idea with a like and comment!❤️

Order Types (How To Set Up)Order Types:
Market Order- Placed at market price
Limit Order- Entry or exit order placed above or below market
Stop Order- Entry or exit order placed above or below market.
Rules for Placing Forward Orders:
above current price:
BAS: Buy Above is a Stop Order
SAL: Sell Above is a Limit Order
below current price:
BBL: Buy Below is a Limit Order
SBS: Sell Below is a Stop Order
*YOU need to know this prior to trading Forex- always use a entry, stop and target order when entering any new trades. Risk management.

Top 10 Patterns (Pin Bar) #8Pin Bar patterns are in the top three patterns to know: Example is bearish pin bar with nose which happens at a high liquidity time and volume too.
Three types of pin bars are: Standard pin bar, Pin bar with nose and Pin bar with no real body.
In general, Pin Bars are two types. The bullish pin bar, and the Bearish Pin bar. Bullish Pin Bar signals Long or Buy trade entry, and a Bearish Pin Bar signals the Short or Sell trade entry. Use 1 hour, 4 hour or daily pin bars at major support or resistance for better results. Fib Ret tool helps & pullbacks work.
Every pin bar consists of a real body or a head. And a tail or long shadow.The real body is the difference between the opening price and closing price of a
candle. So, if the closing price is higher than the opening price of a pin bar, then this types of pin bars are called the bullish pin bar. And if the closing price is lesser than the opening price, then this types of pin bars are called the bearish pin bar. A bullish pin bar is the sign of buyer’s strength and a bearish pin bar signals the strong selling pressure of a certain security.
Based on the formation of pin bar, you will find 3 types of valid pin bars in a price action chart.
1- Standard Pin Bar: The first type of pin bar is the standard pin bar, this types of pin bars contains a real body and a long tail. They are the strongest than other two pin bars. You will see no extra shadow or wicks attached to the real body of this types of pin bars.
2- Pin Bar with extra shadow: The second types of the pin bar, is the pin bar with a nose or extra wick attached to the real body. These pin bars are also called as the hanging man. This types of pin bars shows less strong market momentum than the standard pin bars. The nose above or below the real body indicates the opposite directional force and hence shows weakness of the pin bar.
3- Pin Bar with no real body: This type has no real body but a tail. That means the opening price and closing price of the pin bar is same. The signal strength of this types of pin bar is very week. If you can find a strong bullish or bearish candle after these types of pin bars, then this patterns gives a very strong trading signal.

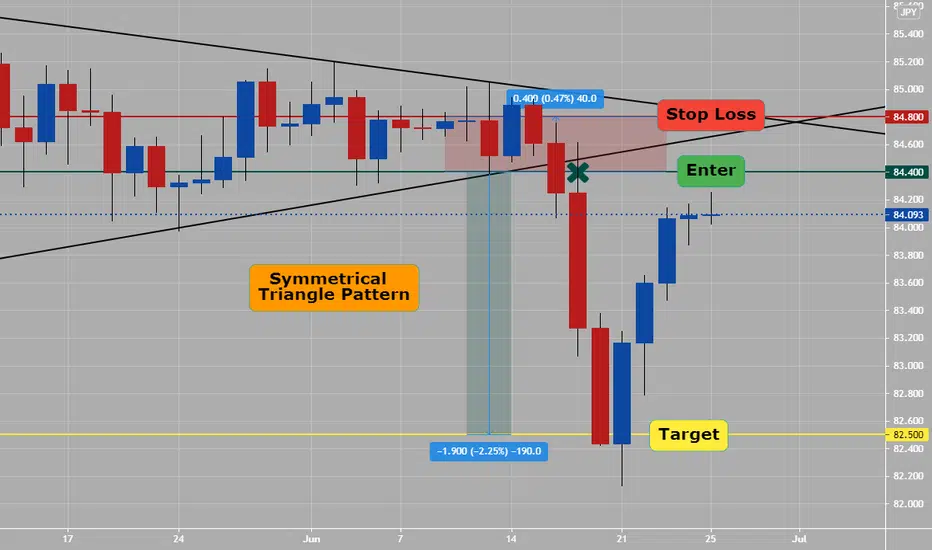
Top 10 Patterns (Triangles) #6Triangles: Example of bearish triangle on daily AudJpy chart
Triangles are also continuation signals like rectangle patterns and flags. Triangle patterns are three types: ascending, descending, and the symmetrical triangle, which is the most common of the three.
Ascending and descending patterns are similar to each other. The only difference is that the ascending triangle has a flat upper trend line. In contrast, the descending triangle has a flat lower trend line.
The symmetrical triangle has the unique ability to form during both up trends and downtrends of the market, and it appears with converging trend lines.
Confirming a continuation is also very simple with the symmetrical triangle as breakout points of the lower trend line during a downward trend is enough indication for the continuation of that downward trend.
Similarly, a breakout of the upper trend line during an upward trend is enough indication for the continuation of that upward trend.
Top 10 Patterns (Ranges or Rectangle) #4On 1 hour GbpChf example- sideways, rectangle, box or ranging price action- do not trade this. This is where a lot of money is lost by retail traders.
Now the rectangle is not a reversal pattern like the previous entries on this list. Instead, it is a continuation pattern, which means that it is generally used by traders to confirm whether or not a particular trend should go on.
You can either find a bullish rectangle or a bearish rectangle depending on the circumstances that create them. For example, you will find a bullish rectangle during an upward trend and a bearish rectangle during a downward trend.
It essentially depicts a trading area where the bulls and the bears compete with each other where they bulls push the price up when the price nears support. The bears move the price down when the price approaches resistance.
Look to trade either:
Breakouts or Breakouts and then pullbacks to enter any new trades.
Chart example showed a 1:2 or 1:3 risk reward setup. Be picky and be patience in the FX trading world.

Fighting the need to be right in the marketsIn most industrial countries the educational system was created not to truly teach students, but to generate good workers for factories and other companies. Yes, we want these highly trained individuals to be able to think critically and generate new ideas. However, we want them to be excellent employees who follow the boss's instructions. So, how do we do that? We do it through our educational process where children learn that the teacher is always right.
Children attend school for 12 to 16 years, and it is often reinforced that the instructor is always correct. For example, as a student, you are required to take tests. You learned that if you get fewer than 70% of the questions correct, you are a failure. "Why didn't you receive 100?" your father asks when you show it to him. So, your father expected you to be correct as well. As a result, we have a strong desire to be correct. If you don't get it correctly at least 70% of the time, you're labeled a failure. However, you want to be correct 100% of the time so that your father does not criticize you. As a result, you begin to criticize yourself first in order to solve the problem before your dad does.
Let's take that and apply it to the stock market, futures market, or any other investment you could make. You want to be correct, and that to you means making money. Let's assume you buy a stock for $100 and know how to establish a stop loss: if it drops below $95 per share, you'll sell.
Let's assume the price falls to $95 per share. You really want to be right, so you'd be wrong if you got out, or at least feel like you were. Your mind races with ideas such as, "It's simply a temporary setback." "Analysts expect a significant boost in earnings this quarter; I'm reluctant to sell at this time." "What if a few traders are manipulating the downturn?"
So you hang onto the stock and watch it fall even further. It drops to $90. Now you have a 2R loss. If it was hard to take a 1R loss, it’s even harder to take a 2R loss. And all the same, arguments apply. Thus, you hold onto your stock. Now the stock drops to $85 and you have a 3R loss. You know you really should get out, but now your portfolio is down $4k and you can really write off $3k in losses, so you’d better keep this stock. You know it will turn around.
Now you know why a psychologist and an economist won the Nobel Prize in economics for basically showing that it was very hard for people to take losses. People according to those Nobel prize winners become much more “tolerant of risk” when they are behind. The Nobel winners also showed that people tend to tolerate little risk when they are ahead, making it difficult to let profits run.
People tolerate risk more when they are behind (i.e won’t cut their losses) and tolerate risk less when they are ahead (i.e they won’t let their profits run).
So what can you do about your need to be right?
Instead of focusing on being right, focus on not making any mistakes, whereas a mistake occurs when you don’t follow your rules. Your rules should be the golden rules of trading (previous article material).
If you consider breaking these rules as being wrong (i.e., making a mistake), you’ll find that suddenly you can make money in the stock market or any other investment field.
In short, you must think in terms of probabilities and statistics. As a result, you can pay attention to just following your system, and making as few mistakes as possible, because when you do that, you “know” what your results will be in the long run (knowing the expectancy of your system).
Trade with care.
If you like our content, please feel free to support our page with a like, comment & subscribe for future educational ideas and trading setups.

MACD - Lesson on what it is, how to useHere’s the basics of a MACD – I will say, I personally don’t use it, but I know it’s a popular indicator amongst newer traders.
What is a MACD?
A fairly straightforward indicator that calculates the difference between two exponential moving averages – of course this can be tweaked and modified but the standard settings seem to be 26 day and a 12 day.
Moving average convergence divergence (MACD), invented in 1979 by Gerald Appel, is one of the most popular technical indicators in trading. The MACD is appreciated by traders the world over for its simplicity and flexibility, as it can be used either as a trend or momentum indicator.
Click on the image for the lesson on MA's.
The 12 day is considered the fast one and the 26 the slow one – so when people refer to a fast or slow line it is to this they are referring.
The calculation is then done on the closing price of both EMA’s.
The second measurement is known as a trigger – see image for the 3 components (in orange) the trigger is often, a nine-day EMA of the MACD itself is plotted as well.
Histogram - The MACD histogram is an elegant visual representation of the difference between the MACD and its nine-day EMA.
The histogram is positive when the MACD is above its nine-day EMA and negative when the MACD is below its nine-day EMA.
If prices are rising, the histogram grows larger as the speed of the price movement accelerates, and contracts as price movement decelerates. The same principle works in reverse as prices are falling.
How to use it?
The MACD generates a bullish signal when it moves above its own nine-day EMA, and it sends a sell sign when it moves below its nine-day EMA.
What does this mean?
Because there are two moving averages with different “speeds”, the faster one will obviously be quicker to react to price movement than the slower one.
When a new trend occurs, the faster line (MACD Line) will react first and eventually cross the slower line (Signal Line).
When this “crossover” occurs, and the fast line starts to “diverge” or move away from the slower line, it often indicates that a new trend has formed. This in essence is Divergence…
What you will notice here in the recent Bitcoin move; is when the cross happened the price fell.
But unfortunately, the divergence trade is not very accurate, as it fails more than it succeeds.
So, it’s not as easy as plugging in a MACD and running with it!
The MACD histogram is the main reason why so many traders rely on the indicator to measure momentum, due to it responding to the speed of price movement.
Many traders use the MACD indicator more frequently to gauge the strength of the price move than to determine the direction of a trend.
In the image below; I have removed the EMA’s and kept only the histogram to show the example.
You will see that from point A to B on the chart and how it is represented in the histogram & then again from point C to D – both showing bullish momentum from a low point.
And in this example below; the Histogram shows more negative strength from X to Y.
The Truth
No indicator is perfect – no trader is perfect; two wrongs won’t make it right. Some traders swear by MACD and others avoid it. The one thing I can say, is if you keep to its rules then you could make it work for you. Using the indicators histogram over price or entries with Divergence might be what your looking for, then MACD is useful. But don’t rely on especially as the only entry/exit tool.
Why did I write this if I don’t use it? Like many indicators, they are lagging – the issue is most educational content online shows MA’s, MACD’s, RSI. Newer traders assume there is some holy grain in terms of indicators. There isn’t – all of what indicators say, can be seen in price – after all it’s what they are calculated on. I’ve written this to highlight the logic of a MACD for newer traders looking or using it. To at least highlight what it is your looking at.
Hope it helps somebody out there!
For more educational content, see the links below in "related ideas".
Disclaimer
This idea does not constitute as financial advice. It is for educational purposes only, our principle trader has over 20 years’ experience in stocks, ETF’s, and Forex. Hence each trade setup might have different hold times, entry or exit conditions, and will vary from the post/idea shared here. You can use the information from this post to make your own trading plan for the instrument discussed. Trading carries a risk; a high percentage of retail traders lose money. Please keep this in mind when entering any trade. Stay safe.

BITCOIN. "The cycle of dominance".A table to be able to see how much altcoin can go up or down with respect to the dominance and price of BTC and to know when there is a high season and Dump phase.
BTC dominance graph CRYPTOCAP:BTC.D
