Market Flow with Convergence🟪 Overview
The "Market Flow with Convergence" indicator leverages advanced volume metrics to accurately measure the underlying market pressure by analyzing the cumulative buying and selling volumes with the TICK index. This unique combination helps identify potential market reversals and trends, providing a comprehensive view of market flow. The indicator is particularly useful for those looking to capture convergence and divergence signals, crucial for making informed trading decisions.
🟪 Features
Volume-Based Convergence: Calculates the buying and selling pressures based on volume data, to produce color coded convergence. Visually represents areas where buying or selling pressures align.
Divergence Detection: Identifies and visually represents areas where buying and selling pressures diverge from each other, which can indicate key market turning points.
TICK Index: Incorporates data from the TICK index, normalizing and smoothing the cumulative data to highlight potential market reversals and trends.
Cumulative Flow Crossovers: Identifies and visually represents areas where buying and selling pressures crossover and become the dominant market flow.
Customizable Visualization: Uses conditional coloring and shapes to provide a clear, easy-to-interpret visual representation of the market state, making it easier to spot critical signals at a glance.
🟪 How it Works
Leveraging a combination of volume analysis and market breadth data, particularly the TICK index, to assess the underlying market pressure. By normalizing key market metrics, the indicator provides a clear view of buying and selling activity over time. The flow is standard across all charts, but convergence will change based on the charts ticker.
The indicator tracks and aggregates movements in the TICK index, allowing for an assessment of the market's cumulative momentum. This cumulative measure, combined with volume-based analysis, helps traders identify potential shifts in market trends, whether they be continuations or reversals.
The visual output of the indicator is designed to be intuitive and actionable. Key market conditions are highlighted through color-coded histograms and plot shapes, making it easy to interpret the data and apply it in real-time trading scenarios.
Understanding the Convergence Color Codes
Gray: represent periods of the markets lack of convergence, where neither buyers nor sellers have a decisive advantage. These conditions may indicate market indecision or a potential reversal point. The gray bars can also suggest a period of consolidation before a significant move.
Green: this indicates that buying pressure is greater than selling pressure, suggesting a bullish market condition. This is typically seen when the market may be trending upwards or when buyers are gaining control.
Red: signifies that selling pressure exceeds buying pressure, indicating a bearish market condition. This can be a signal that the market is trending downwards or that sellers are dominating the market.
Understanding Flow Crossovers
Green Dots: correspond to crossovers where the buying pressure (from the TICK) crosses above the selling pressure. This crossover often signals a potential upward move or a bullish market opportunity.
Red Dots: indicate a crossover where the selling pressure (from the TICK) crosses above the buying pressure. This crossover typically suggests a potential downward move or a bearish market signal.
🟪 Usage Examples
If the selling flow is consistently over buying and convergence is red, it indicates a strong and sustained bearish trend. This points to a potential downward move, with sellers predominantly in control.
When the buying flow is consistently over selling and convergence is green, it indicates a strong and sustained bullish trend. This can lead to a potential upward move, with buyers predominantly in control.
No convergence can mean it's time to be cautious. This could be a sign of market indecision, and it's often wise to wait for confirmation. This can lead to sideways market conditions or inverse of the current dominant flow.
🟪 Settings
This indicator does not require any user inputs as it automatically calculates the necessary data based on the ticker's price and volume information. It’s ready to use immediately upon application to any chart.
🟪 Limitations
This indicator is only works during the New York session of trading. It's flow values will not function outside of that trading session.
🟪 Conclusion
We believe in providing user-friendly tools to help speed up traders technical analysis and implement easy trading strategies. The "Market Flow with Convergence" offers a unique way to gauge prevailing market conditions, with simple visual cues for identifying trends.
🟪 Risk Disclaimer
All content, tools, scripts & education provided, are for informational & educational purposes only. Trading is risk and most lose their money, past performance does not guarantee future results.
Breadth Indicators

Whaley Breadth Thrust IndicatorThe Whaley Breadth Thrust Indicator (WBT) is a momentum-based technical indicator designed to identify the strength of market trends. It measures the market's breadth by comparing advancing stocks to declining stocks, providing insights into whether a market is in a bullish, neutral, or bearish state. This script calculates the indicator based on the advancing and declining U.S. stocks; however, it can be expanded to other markets as well.
Breadth Thrust Ratio (BTR):
This is calculated as the ratio of advancing stocks to the total number of advancing and declining stocks.
Formula: BTR = Advances / (Advances + Declines + small_offset), where the small offset prevents division errors.
Smoothing:
The BTR is smoothed using a 3-period Exponential Moving Average (EMA) to reduce noise and highlight significant trends.
Thresholds:
0.30: Indicates a strongly bearish market.
0.40: A bearish threshold; crossing below suggests bearish momentum.
0.60: A bullish threshold; crossing above suggests bullish momentum.
0.70: Indicates a strongly bullish market.

MM Market Range MapWhat this script does:
The purpose of this script is to help traders identify when the major sectors of the market are moving in one direction - also known as a "market trend day".
How this script works:
The indicator uses QQQ, SMH and NVDA to represent the technology side of the market, and XLF, XLV & IWM to represent everything else. It tracks where price is within the day's range for each of those symbols, and presents that data in a table and in also in a dot-based "map".
How to use this script:
Using the dot-based map, you can see if all symbols were ever at the highs or lows of their range together. You can use this information to decide which direction you should be trading (ie. with trend). For example, in order for there to be healthy bullish moves in the market, you would want this indicator to show you that all sectors are at the highs or trending in that direction.
What makes this script original:
Most indicators and even the TradingView watchlist measure the percent changed on the day from the closing price of a stock on the prior trading day, essentially telling you what sentiment is since yesterday. This script tells you the sentiment today since it is priced from the opening print. It also provides the map so you can see if they were ever at the highs or lows together throughout the day, which can be an early indicator that the market will trend.
ELMo HeatmapA heatmap display of the Entropy, Liquidity, and Momentum (ELMo) strategy status across a group of tickers.
Background color indicates ELMo's opinion of that row(green - bull, red - bear). White dots indicate bullish signals and black are bearish signals.
Top row is current ticker, remaining 7 rows are each a configurable ticker. The defaults are:
SPY
QQQ
DIA
IWM
BTCUSD
GLD
TLT
If you have appropriate data feeds, I also like the following ticker list:
ES1!
NQ1!
YM1!
RTY1!
BTC1!
GC1!
VX1!

4C Data Table SuiteOverview
The 4C Data Table Suite is a versatile TradingView indicator, designed for traders who focus on the critical role of prior bar levels in their strategy. By highlighting the high and low points of previous bars, this tool aids in pinpointing crucial support and resistance zones, which often act as psychological triggers for market participants. The unique feature of this indicator is its dual-color coding: it colors bars green for bullish closes and red for bearish closes in the Prior Bar Table, and for the current timeframe, it highlights whether the current price is above (green) or below (red) these levels.
Concepts
1 — This sophisticated indicator is not just about visual cues; it provides a rich tableau of data including:
• Current timeframe countdown to bar close
• GMT-adjusted clock for precise trade timing
• Real-time updates on market internals and volatility measures such as the NYSE TICK and ATR
2 — The configuration is highly customizable, allowing users to:
• Adjust the table's positioning and text size
• Choose color settings for text, background, and borders to suit their visual preference
• Toggle the display of various data components based on their trading needs
3 — The Prior Bar Table is particularly valuable for:
• Traders using prior bar levels as triggers for trade entries and exits
• Quick visual assessment of market sentiment
• Real-time decision-making supported by dynamic color coding based on current price movements relative to prior highs and lows
Features
• Prior Bar Levels Table: Visualizes high and low levels of prior bars with intuitive color coding, aiding traders in assessing market trends.
• Dynamic Color Coding: Updates colors based on the closure of the previous bar and current price positions relative to the past bar's highs and lows.
• Comprehensive Market Data: Includes a suite of essential data such as market internals, the prior bar’s range, and the latest price information.
• Customizable Visuals: Offers extensive options for customizing the appearance and data presented, ensuring the tool fits seamlessly into any trader's strategy.
How to Use
1. To add the indicator, search for "4C Data Table Suite" under indicators on TradingView and apply it to your chart.
2. Navigate to the indicator settings to customize the display properties, including table position, color schemes, and which data points to display.
3. Utilize the toggles within the "Prior Bar Levels Table" settings to adjust the visibility and behavior of the table, depending on your trading approach.
Limitations
• This indicator is optimized for use on time-based charts and may not perform as intended on tick charts or non-standard timeframes.
• The color coding is based on the closure of bars, which may not always reflect intrabar movements, potentially affecting real-time decision-making in highly volatile markets.
Notes
• Ensure your TradingView interface is set to the correct timezone settings to align the GMT clock accurately.
• The dynamic color updates are designed to provide at-a-glance insights but should be used in conjunction with other analysis tools for best results.
*If you find that the indicator is blocking some of the candles at the bottom of the screen, go to (Chart) Settings, Canvas, and then adjust the Bottom/Top margin by increasing the % Amount.
Thanks
Special thanks to the TradingView community and developers whose feedback and insights have helped refine the functionalities of the 4C Data Table Suite. Your collaborative spirit is what makes continuous improvement possible.

Normalized and Smoothed Cumulative Delta for Top 5 NASDAQ StocksThis script is designed to create a TradingView indicator called **"Normalized and Smoothed Cumulative Delta for Top 5 NASDAQ Stocks."** The purpose of this indicator is to track and visualize the cumulative price delta (the change in price from one period to the next) for the top five NASDAQ stocks: Apple Inc. (AAPL), Microsoft Corporation (MSFT), Alphabet Inc. (GOOGL), Amazon.com Inc. (AMZN), and Meta Platforms Inc. (FB).
### Key Features of the Script:
1. **Ticker Selection**:
- The script focuses on the top five NASDAQ stocks by automatically setting their tickers.
2. **Price Data Retrieval**:
- It fetches the closing prices for each of these stocks using the `request.security` function for the current timeframe.
3. **Delta Calculation**:
- The script calculates the delta for each stock, which is simply the difference between the current closing price and the previous closing price.
4. **Cumulative Delta Calculation**:
- It calculates the cumulative delta for each stock by adding the current delta to the previous cumulative delta. This helps track the total change in price over time.
5. **Summing and Smoothing**:
- The cumulative deltas for all five stocks are summed together.
- The script then applies an Exponential Moving Average (EMA) with a period of 5 to smooth the summed cumulative delta, making the indicator less sensitive to short-term fluctuations.
6. **Normalization**:
- To ensure the cumulative delta is easy to interpret, the script normalizes it to a range of 0 to 1. This is done by tracking the minimum and maximum values of the smoothed cumulative delta and scaling the data accordingly.
7. **Visualization**:
- The normalized cumulative delta is plotted as a smooth line, allowing users to see the overall trend of the cumulative price changes for the top five NASDAQ stocks.
- A horizontal line is added at 0.5, serving as a midline reference, which can help traders quickly assess whether the normalized cumulative delta is above or below its midpoint.
### Usage:
This indicator is particularly useful for traders and investors who want to monitor the aggregated price movements of the top NASDAQ stocks, providing a high-level view of market sentiment and trends. By smoothing and normalizing the data, it offers a clear and concise visualization that can be used to identify potential market turning points or confirm ongoing trends.
Market Internal Pivots by SyntaxGeekThis indicator combines simple pivot detection with market breadth ratios.
The thought was to show market breadth strength or weakness where price was making potential pivots.
Lookback can be adjusted and currently it supports NYSE and NASDAQ market breadth.
Configuration is limited given the simplicity but live breadth printout can be displayed at current candle.
Max label count is at 500 but the indicator makes use of the visible chart library and will redraw old pivot labels when scrolling back, up to 500.
Considering that market breadth data is only available during RTH, do not expect data during ETH sessions. I've only tested this up to 1hr timeframe so I can't guarantee higher timeframes will present correctly.
Feel free to leave feedback, happy trading!
Support ResistanceThis indicator was written in pine script code, inspired by the L3 Banker Fund Flow Trend Oscillator indicator whose link I gave below.
This indicator is designed to track the flow of banker funds in the market by analyzing price movements and generating entry signals based on specific criteria. It uses a combination of custom functions and moving averages to identify potential points where bankers might be entering the market.
Key Features:
Fund Flow Trend Calculation:
The indicator calculates the fund flow trend using a combination of weighted moving averages. This helps in identifying the overall trend and potential reversals.
Bull Bear Line:
A key component of the indicator is the Bull Bear Line, which is derived from the typical price, lowest low, and highest high over a specified period. This line helps in determining the strength and direction of the market trend.
Banker Entry Signal:
The indicator generates a banker entry signal when the fund flow trend crosses above the Bull Bear Line, and the Bull Bear Line is below 25. This condition is indicative of a potential entry point for bankers.
Visual Representation:
Entry prices and indices for the last five banker entry signals are stored and used to draw dashed lines on the chart, representing these significant levels.
A dynamic rectangle is drawn between the last two entry prices, which extends to the right until the specified conditions are met. The rectangle's color changes from red to green if the price crosses above it by at least one bar, indicating a potential support zone.
Usage:
Trend Identification:
Use the fund flow trend and Bull Bear Line to identify the prevailing market trend and potential reversal points.
Entry Signals:
Pay attention to the banker entry signals as potential points of entry based on institutional fund flow.
Support and Resistance:
The dynamic rectangle can act as a support zone. Monitor price action relative to this rectangle for potential trading opportunities.
This indicator is a powerful tool for traders looking to align their trades with the movements of large institutional players. By understanding and tracking the flow of banker funds, traders can gain valuable insights into market dynamics and make more informed trading decisions.
Market Breadth - AsymmetrikMarket Breadth - Asymmetrik User Manual
Overview
The Market Breadth - Asymmetrik is a script designed to provide insights into the overall market condition by plotting three key indicators based on stocks within the S&P 500 index. It helps traders assess market momentum and strength through visual cues and is especially useful for understanding the proportion of stocks trading above their respective moving averages.
Features
1. Market Breadth Indicators:
- Breadth 20D (green line): Represents the percentage of stocks in the S&P 500 that are above their 20-day moving average.
- Breadth 50D (yellow line): Represents the percentage of stocks in the S&P 500 that are above their 50-day moving average.
- Breadth 100D (red line): Represents the percentage of stocks in the S&P 500 that are above their 100-day moving average.
2. Horizontal Lines for Context:
- Green line at 10%
- Lighter green line at 20%
- Grey line at 50%
- Light red line at 80%
- Dark red line at 90%
3. Background Color Alerts:
- Green background when all three indicators are under 20%, indicating a potential oversold market condition.
- Red background when all three indicators are over 80%, indicating a potential overbought market condition.
Interpreting the Indicator
- Market Breadth Lines: Observe the plotted lines to assess the percentage of stocks above their moving averages.
- Horizontal Lines: Use the horizontal lines to quickly identify important threshold levels.
- Background Colors: Pay attention to background colors for quick insights:
- Green: All indicators suggest a potentially oversold market condition (below 20).
- Red: All indicators suggest a potentially overbought market condition (above 80).
Troubleshooting
- If the indicator does not appear as expected, please contact me.
- This indicator works only on daily and weekly timeframes.
Conclusion
This Market Breadth Indicator offers a visual representation of market momentum and strength through three key indicators, helping you identify potential buying and selling zones.

Last Candle OHLC (Ticks or Points)What the Code Does
1. **Draws Lines and Labels**:
- It draws lines on your chart to show the high, low, open, and close prices from the previous period (like the previous day or week).
- It also labels these lines with numbers that tell you how far the current price is from these levels.
2. **Shows Price Movement**:
- You can see how far the price has moved from these levels in terms of small price changes (ticks) or larger units (points).
- This helps you understand price movements and potential levels of support or resistance.
3. **Customizable**:
- You can choose whether to show these lines and labels, and you can select if you want to see the movement in ticks or points.
- The lines can extend into the future on your chart to help you anticipate where prices might be in the coming days.
### How It’s Useful:
1. **Identify Key Levels**:
- It helps you spot important price levels from past periods, which can act as support or resistance.
2. **Understand Price Movement**:
- You get a visual sense of how much the price has moved from key levels, which can help you gauge market volatility.
3. **Plan Trades**:
- By seeing where the price has been and how it has moved, you can better plan your trades, like deciding where to enter or exit based on these levels.
4. **Flexible for Different Markets**:
- It works across various markets, like stocks, futures, and forex, adjusting to the specific characteristics of each instrument.
In short, this tool helps you visualize and understand past price movements and levels on your chart, aiding in your trading decisions.

Enhanced Alligator Trend Indicator By Er. Parvez HaleemPurpose: The Enhanced Alligator Trend Indicator aims to identify strong and reliable buy and sell signals on the price chart by combining the Alligator Indicator with trend strength and volume filters. It is specifically designed for use on a 1-minute chart to enhance precision in short-term trading decisions.
Components:
Alligator Indicator:
Jaw Line (Blue): Calculated as a simple moving average (SMA) of the closing price over a specified period (default: 13 bars). Represents the long-term trend.
Teeth Line (Red): Calculated as a simple moving average (SMA) of the closing price over a shorter period (default: 8 bars). Represents the medium-term trend.
Lips Line (Green): Calculated as a simple moving average (SMA) of the closing price over an even shorter period (default: 5 bars). Represents the short-term trend.
Trend Strength Indicator:
Relative Strength Index (RSI): Measures the strength of the current trend, using a default period of 14 bars. RSI values above 50 suggest a bullish trend, while values below 50 suggest a bearish trend.
Volume Filter:
Volume Threshold: Filters signals based on trading volume to ensure they only appear when volume exceeds a specified threshold (default: 100,000). This helps to avoid low-volume noise and enhance signal reliability.
Additional Trend Filters:
Short-Term SMA: A simple moving average with a default period of 20 bars, used to assess short-term trend direction.
Long-Term SMA: A simple moving average with a default period of 50 bars, used to assess long-term trend direction.
SMA Crossover: A bullish crossover occurs when the short-term SMA is above the long-term SMA, and a bearish crossover occurs when the short-term SMA is below the long-term SMA.
Signal Generation:
Buy Signal: Generated when:
The Lips line is above the Teeth line, and the Teeth line is above the Jaw line (indicating a bullish alignment in the Alligator Indicator).
The RSI is above 50 (indicating strong bullish trend strength).
The trading volume exceeds the specified volume threshold (indicating sufficient trading activity).
The short-term SMA is above the long-term SMA (confirming a bullish trend).
Sell Signal: Generated when:
The Lips line is below the Teeth line, and the Teeth line is below the Jaw line (indicating a bearish alignment in the Alligator Indicator).
The RSI is below 50 (indicating strong bearish trend strength).
The trading volume exceeds the specified volume threshold (indicating sufficient trading activity).
The short-term SMA is below the long-term SMA (confirming a bearish trend).
Plotting on Chart:
Alligator Lines: The Jaw, Teeth, and Lips lines are plotted directly on the price chart in blue, red, and green, respectively, to indicate the long-term, medium-term, and short-term trends.
Buy/Sell Signals: Buy signals are plotted below the price bars in green, and sell signals are plotted above the price bars in red. These signals are marked with labels ("BUY" and "SELL") to clearly indicate trading opportunities.
Debugging: RSI and SMA lines are plotted but hidden by default. They can be revealed for verification purposes to ensure the correctness of the indicator’s calculations.
Alerts:
Buy Alert: Triggers when a buy signal condition is met, sending a notification that a buy opportunity has been identified.
Sell Alert: Triggers when a sell signal condition is met, sending a notification that a sell opportunity has been identified.

High Low Lines (500 candle 5min)This TradingView script is designed to visualize the highest high and the lowest low from the previous 576 candles on the chart. It draws horizontal lines representing these values and updates them at a specific time each day.

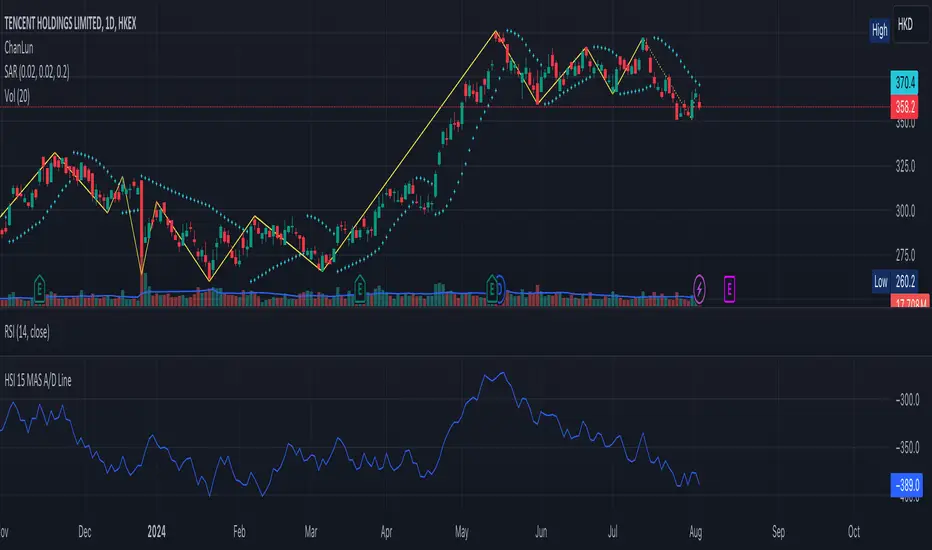
HSI 15 MAS A/D LineHSI 15 MAS A/D Line
This script calculates the Advance-Decline Line (AD Line) for the top 15 most active stocks within the Hang Seng Index, representing a significant 65.82% of the index's total weight. The AD Line is a crucial breadth indicator, measuring the difference between the number of advancing and declining stocks within the selected 15 constituents. By tracking this cumulative difference over time, the AD Line provides insights into market trends and potential reversals, reflecting the underlying strength or weakness of the market.
Features :
Top 15 Constituents : The script focuses on the 15 most influential stocks based on their weight in the Hang Seng Index, ensuring that the analysis is concentrated on the stocks that most impact the index's movements.
Advance-Decline Calculation : The script calculates whether each stock in the list is advancing or declining on a given day and then sums these values to create the AD Line.
Cumulative Indicator : The AD Line is plotted as a cumulative indicator, providing a clear visual representation of the overall market trend based on the breadth of advancing versus declining stocks.
How It Works :
Symbol Input : The script uses TradingView's `request.security` function to pull data for each of the 15 stocks.
Calculation of Advances and Declines : For each stock, the script determines whether it is advancing or declining compared to the previous day’s closing price.
Cumulative Sum : The script then cumulatively sums the number of advancing stocks minus the declining ones to plot the AD Line.
Use Case :
This AD Line is useful for traders and analysts who want to gauge the strength of the market trend beyond just price movement, by analyzing how many stocks are participating in the trend. It's particularly effective in confirming or questioning the sustainability of a trend, making it a valuable tool in both bullish and bearish market conditions.
Important Notes :
Ensure that the 15 selected stocks represent a diverse cross-section of sectors within the Hang Seng Index for a more accurate reflection of the market’s overall health.
The AD Line should be used in conjunction with other technical indicators to make more informed trading decisions.
Prospect Theory IndicatorProspect Theory Indicator
This indicator is designed based on Prospect Theory, which was developed by Nobel laureates Daniel Kahneman and Amos Tversky. Prospect Theory explains how people make decisions involving risk and uncertainty, highlighting their tendency to value potential losses more than equivalent gains and their focus on relative gains and losses rather than absolute outcomes.
Features:
1. Reference Points: The indicator calculates and displays the highest and lowest prices over a specified period (default is 14 periods). These are the reference points used to evaluate current price movements.
2. Risk/Reward Ratio: It calculates the risk/reward ratio by comparing the current price to the reference points. The risk is defined as the distance to the lowest point, and the reward as the distance to the highest point.
3. Visual Indicators:
• Green Line: Indicates the highest reference point (High Reference Point).
• Red Line: Indicates the lowest reference point (Low Reference Point).
• Green Triangle: Displays when the reward outweighs the risk, suggesting a favorable condition for entering a trade.
• Red Triangle: Displays when the risk outweighs the reward, suggesting a cautious approach.
4. Labels: Provides real-time labels showing the risk/reward ratio, and marks the current conditions as “High Risk” or “High Reward” based on the calculated ratio.
Usage:
• Entry Signals: Use green triangles for potential buy entries when the reward is higher than the risk.
• Exit Signals: Use red triangles as a signal to review your positions, as the risk has become higher than the reward.
• Risk Management: Continuously monitor the risk/reward ratio to maintain optimal risk management in your trading strategy.
This indicator helps traders make more informed and objective decisions, mitigating the emotional biases described by Prospect Theory.

Volume Insignts AnalyzerDescription:
The Volume Insight Analyzer is an advanced Pine Script designed for traders who want a comprehensive view of volume dynamics on their charts. This script combines multiple volume-based indicators to help identify key trading opportunities, including significant volume days, volume dry-ups, and pocket pivots.
Key Features:
VDU (Volume Dry-Up) Detection: Automatically identifies and marks days when the volume is significantly below its moving average, helping to spot potential breakout or breakdown points. Customizable volume thresholds allow for tailored analysis based on your trading strategy. The Volume Dry-Up label appears when the volume is substantially below its average level and the price is near a key moving average. This condition indicates a period of equilibrium between supply and demand, suggesting a potential low-risk entry point for traders.
Pocket Pivot Analysis using 5 and 10 Length Pocket Pivots: Highlights days with exceptionally high volume compared to recent history, indicating potential pocket pivots. Visual markers on the chart and volume bars color-coded for 5 and 10-day lengths. Pocket pivot points are identified when the volume on a given day exceeds the maximum volume observed over the past several days. Specifically, a 5-day pocket pivot point is marked when today's volume surpasses the highest selling volume of the last 5 days. A cluster of 5-day pocket pivot points within a base is a strong indicator of stock strength. Similarly, a 10-day pocket pivot point following a Volume Dry-Up (VDU) suggests a potential entry opportunity. Moreover, a pre-existing cluster of 5-day pocket pivot points before a 10-day pocket pivot point provides greater conviction in the trade.
Volume Moving Averages: Set different lengths for primary and secondary moving averages to track volume trends over daily, weekly, and monthly timeframes. Options to display moving average lines on the volume chart.
Volume Visualization:
a. Major and Minor Volume Bars: Option to display bars that are either above or below average volume levels. Adjustable settings to show or hide these bars based on user preference.
b. Volume Bar Coloring: Volume bars are color-coded based on significant volume thresholds, including green for bullish signals, red for bearish signals, and orange for volume dry-ups.
Volume Metrics Table: A customizable table that displays real-time volume metrics including Relative Volume (RVOL), Turnover, and the number of high volume days. The table can be oriented horizontally or vertically and styled according to your theme preferences.
Visual Indicators:
a) Volume Dry-Up (VDU) Labels: Clearly marked VDU events with textual annotations on the chart.
b) Bullish and Bearish Arrows: Arrows indicating potential bullish or bearish closes based on volume analysis, enhancing decision-making.
Customization Options:
a) Dark and Light Theme Support: Toggle between dark and light themes to match your chart settings.
b) Adjustable Parameters: Easily configure input settings such as volume thresholds, MA lengths, and table display options to fit your trading style.
How to Use:
Set Parameters: Adjust the script settings such as volume thresholds, moving average lengths, and display preferences according to your analysis needs.
Analyze Volume Patterns: Use the indicators and visual markers provided by the script to identify significant volume patterns and potential trading signals.
Monitor Metrics: Refer to the volume metrics table for a quick overview of key volume-related statistics and trends.
Make Informed Decisions: Utilize the visual cues and volume data provided by the script to enhance your trading strategy and make more informed decisions.
Disclaimer:
This script is for informational purposes only and should not be considered as trading advice. Use it in conjunction with other analysis tools and consult with a financial advisor if needed. Trading involves risk, and past performance does not guarantee future results.

Tick Weighted Average Price %B Breadth by SyntaxGeekSource concept
This indicator operates with the same calculation as TiWAP %B , review that for the general premise.
What this study aims to deliver
This TiWAP %B is a breadth indicator, that can track price movements against TiWAP for up to ten stocks configured. Benefits including acting as a "eyes on glass" scanner for trading individual stocks, trading index, futures or etf knowing that top market liquidity is in alignment to ideas generated from the data displayed.
How to use
Configure up to ten stocks with weights for index and assigned custom colors, if less than ten are desired just disable them by unchecking the box next to the stock in question.
Track stocks movements against TiWAP calculations which display how the stock is moving in relation to tick market breadth (either NYSE or NASDAQ internal TICK).
As stocks move the representative plot moves to the location within the TiWAP bands, as default configured this will be the 1st, 2nd and 3rd deviation bands.
Extra features apart from standard TiWAP %B
Average plot - this will present the weighted average for all stocks %Bs combined.
Smoothing - this will smooth each stock %B, and subsequently the average, with a period configured (EMA).
Bar coloring - this colors bars on the main pane according to average trend strength.
Special considerations
TiWAP, as well as TiWAP %B, require a fair amount of initial TICK data (for session anchorage) in order to build up proper projections - care should be taken in early session using the data.
Also, keep in mind that each stocks band widths will be of varying amounts, so while stocks could all be around the same deviation band there could be more or less significance to that given band width (more indicators coming).
Plots have largely been left open to editing, customize each stock with different style as well as the average. There is a global stock plot transparency setting to ease quick glance comparisons between stocks and the average.
The cloud fill and target level relation features had to be stripped due to plot limitations but perhaps some things could be restored with more time :)
Happy trading!

S&P Short-Range Oscillator**SHOULD BE USED ON THE S&P 500 ONLY**
The S&P Short-Range Oscillator (SRO), inspired by the principles of Jim Cramer's oscillator, is a technical analysis tool designed to help traders identify potential buy and sell signals in the stock market, specifically for the S&P 500 index. The SRO combines several market indicators to provide a normalized measure of market sentiment, assisting traders in making informed decisions.
The SRO utilizes two simple moving averages (SMAs) of different lengths: a 5-day SMA and a 10-day SMA. It also incorporates the daily price change and market breadth (the net change of closing prices). The 5-day and 10-day SMAs are calculated based on the closing prices. The daily price change is determined by subtracting the opening price from the closing price. Market breadth is calculated as the difference between the current closing price and the previous closing price.
The raw value of the oscillator, referred to as SRO Raw, is the sum of the daily price change, the 5-day SMA, the 10-day SMA, and the market breadth. This raw value is then normalized using its mean and standard deviation over a 20-day period, ensuring that the oscillator is centered and maintains a consistent scale. Finally, the normalized value is scaled to fit within the range of -15 to 15.
When interpreting the SRO, a value below -5 indicates that the market is potentially oversold, suggesting it might be a good time to start buying stocks as the market could be poised for a rebound. Conversely, a value above 5 suggests that the market is potentially overbought. In this situation, it may be prudent to hold on to existing positions or consider selling if you have substantial gains.
The SRO is visually represented as a blue line on a chart, making it easy to track its movements. Red and green horizontal lines mark the overbought (5) and oversold (-5) levels, respectively. Additionally, the background color changes to light red when the oscillator is overbought and light green when it is oversold, providing a clear visual cue.
By incorporating the S&P Short-Range Oscillator into your trading strategy, you can gain valuable insights into market conditions and make more informed decisions about when to buy, sell, or hold your stocks. However, always consider other market factors and perform your own analysis before making any trading decisions.
The S&P Short-Range Oscillator is a powerful tool for traders looking to gain insights into market sentiment. It provides clear buy and sell signals through its combination of multiple indicators and normalization process. However, traders should be aware of its lagging nature and potential complexity, and use it in conjunction with other analysis methods for the best results.
Disclaimer
The S&P Short-Range Oscillator is for informational purposes only and should not be considered financial advice. Trading involves risk, and you should conduct your own research or consult a financial advisor before making investment decisions. The author is not responsible for any losses incurred from using this indicator. Use at your own risk.

Stocks Above 5-Day Average (FOMO)Overview
Inspired by Matt Carusos's FOMO indicator, this breadth indicator is designed to provide a visual representation of the percentage of stocks within major indices that are trading above their 5-day moving average.
Functionality
The indicator plots the percentage of stocks trading above their 5-day moving average for the following indices:
S&P 500
Nasdaq
Russell 2000
Dow Jones
All Markets (MMFD)
The indicator includes two horizontal lines:
Upper Threshold: Default at 85%
Lower Threshold: Default at 15%
These lines are used to identify potential overbought (above upper threshold) or oversold (below lower threshold) conditions.
Plot Shapes:
Small circles are plotted at the points where the percentage of stocks crosses the upper or lower thresholds, with colors matching the respective index.
Table:
The current percentage of stocks above the 5-day average for each index.
A warning sign (⚠️) is shown in the table if the percentage crosses the upper or lower threshold, regardless of whether the index plot is enabled or not.

Six PillarsGeneral Overview
The "Six Pillars" indicator is a comprehensive trading tool that combines six different technical analysis methods to provide a holistic view of market conditions.
These six pillars are:
Trend
Momentum
Directional Movement (DM)
Stochastic
Fractal
On-Balance Volume (OBV)
The indicator calculates the state of each pillar and presents them in an easy-to-read table format. It also compares the current timeframe with a user-defined comparison timeframe to offer a multi-timeframe analysis.
A key feature of this indicator is the Confluence Strength meter. This unique metric quantifies the overall agreement between the six pillars across both timeframes, providing a score out of 100. A higher score indicates stronger agreement among the pillars, suggesting a more reliable trading signal.
I also included a visual cue in the form of candle coloring. When all six pillars agree on a bullish or bearish direction, the candle is colored green or red, respectively. This feature allows traders to quickly identify potential high-probability trade setups.
The Six Pillars indicator is designed to work across multiple timeframes, offering a comparison between the current timeframe and a user-defined comparison timeframe. This multi-timeframe analysis provides traders with a more comprehensive understanding of market dynamics.
Origin and Inspiration
The Six Pillars indicator was inspired by the work of Dr. Barry Burns, author of "Trend Trading for Dummies" and his concept of "5 energies." (Trend, Momentum, Cycle, Support/Resistance, Scale) I was intrigued by Dr. Burns' approach to analyzing market dynamics and decided to put my own twist upon his ideas.
Comparing the Six Pillars to Dr. Burns' 5 energies, you'll notice I kept Trend and Momentum, but I swapped out Cycle, Support/Resistance, and Scale for Directional Movement, Stochastic, Fractal, and On-Balance Volume. These changes give you a more dynamic view of market strength, potential reversals, and volume confirmation all in one package.
What Makes This Indicator Unique
The standout feature of the Six Pillars indicator is its Confluence Strength meter. This feature calculates the overall agreement between the six pillars, providing traders with a clear, numerical representation of signal strength.
The strength is calculated by considering the state of each pillar in both the current and comparison timeframes, resulting in a score out of 100.
Here's how it calculates the strength:
It considers the state of each pillar in both the current timeframe and the comparison timeframe.
For each pillar, the absolute value of its state is taken. This means that both strongly bullish (2) and strongly bearish (-2) states contribute equally to the strength.
The absolute values for all six pillars are summed up for both timeframes, resulting in two sums: current_sum and alternate_sum.
These sums are then added together to get a total_sum.
The total_sum is divided by 24 (the maximum possible sum if all pillars were at their strongest states in both timeframes) and multiplied by 100 to get a percentage.
The result is rounded to the nearest integer and capped at a minimum of 1.
This calculation method ensures that the Confluence Strength meter takes into account not only the current timeframe but also the comparison timeframe, providing a more robust measure of overall market sentiment. The resulting score, ranging from 1 to 100, gives traders a clear and intuitive measure of how strongly the pillars agree, with higher scores indicating stronger potential signals.
This approach to measuring signal strength is unique in that it doesn't just rely on a single aspect of price action or volume. Instead, it takes into account multiple factors, providing a more robust and reliable indication of potential market moves. The higher the Confluence Strength score, the more confident traders can be in the signal.
The Confluence Strength meter helps traders in several ways:
It provides a quick and easy way to gauge the overall market sentiment.
It helps prioritize potential trades by identifying the strongest signals.
It can be used as a filter to avoid weaker setups and focus on high-probability trades.
It offers an additional layer of confirmation for other trading strategies or indicators.
By combining the Six Pillars analysis with the Confluence Strength meter, I've created a powerful tool that not only identifies potential trading opportunities but also quantifies their strength, giving traders a significant edge in their decision-making process.
How the Pillars Work (What Determines Bullish or Bearish)
While developing this indicator, I selected and configured six key components that work together to provide a comprehensive view of market conditions. Each pillar is set up to complement the others, creating a synergistic effect that offers traders a more nuanced understanding of price action and volume.
Trend Pillar: Based on two Exponential Moving Averages (EMAs) - a fast EMA (8 period) and a slow EMA (21 period). It determines the trend by comparing these EMAs, with stronger trends indicated when the fast EMA is significantly above or below the slow EMA.
Directional Movement (DM) Pillar: Utilizes the Average Directional Index (ADX) with a default period of 14. It measures trend strength, with values above 25 indicating a strong trend. It also considers the Positive and Negative Directional Indicators (DI+ and DI-) to determine trend direction.
Momentum Pillar: Uses the Moving Average Convergence Divergence (MACD) with customizable fast (12), slow (26), and signal (9) lengths. It compares the MACD line to the signal line to determine momentum strength and direction.
Stochastic Pillar: Employs the Stochastic oscillator with a default period of 13. It identifies overbought conditions (above 80) and oversold conditions (below 20), with intermediate zones between 60-80 and 20-40.
Fractal Pillar: Uses Williams' Fractal indicator with a default period of 3. It identifies potential reversal points by looking for specific high and low patterns over the given period.
On-Balance Volume (OBV) Pillar: Incorporates On-Balance Volume with three EMAs - short (3), medium (13), and long (21) periods. It assesses volume trends by comparing these EMAs.
Each pillar outputs a state ranging from -2 (strongly bearish) to 2 (strongly bullish), with 0 indicating a neutral state. This standardized output allows for easy comparison and aggregation of signals across all pillars.
Users can customize various parameters for each pillar, allowing them to fine-tune the indicator to their specific trading style and market conditions. The multi-timeframe comparison feature also allows users to compare pillar states between the current timeframe and a user-defined comparison timeframe, providing additional context for decision-making.
Design
From a design standpoint, I've put considerable effort into making the Six Pillars indicator visually appealing and user-friendly. The clean and minimalistic design is a key feature that sets this indicator apart.
I've implemented a sleek table layout that displays all the essential information in a compact and organized manner. The use of a dark background (#030712) for the table creates a sleek look that's easy on the eyes, especially during extended trading sessions.
The overall design philosophy focuses on presenting complex information in a simple, intuitive format, allowing traders to make informed decisions quickly and efficiently.
The color scheme is carefully chosen to provide clear visual cues:
White text for headers ensures readability
Green (#22C55E) for bullish signals
Blue (#3B82F6) for neutral states
Red (#EF4444) for bearish signals
This color coding extends to the candle coloring, making it easy to spot when all pillars agree on a bullish or bearish outlook.
I've also incorporated intuitive symbols (↑↑, ↑, →, ↓, ↓↓) to represent the different states of each pillar, allowing for quick interpretation at a glance.
The table layout is thoughtfully organized, with clear sections for the current and comparison timeframes. The Confluence Strength meter is prominently displayed, providing traders with an immediate sense of signal strength.
To enhance usability, I've added tooltips to various elements, offering additional information and explanations when users hover over different parts of the indicator.
How to Use This Indicator
The Six Pillars indicator is a versatile tool that can be used for various trading strategies. Here are some general usage guidelines and specific scenarios:
General Usage Guidelines:
Pay attention to the Confluence Strength meter. Higher values indicate stronger agreement among the pillars and potentially more reliable signals.
Use the multi-timeframe comparison to confirm signals across different time horizons.
Look for alignment between the current timeframe and comparison timeframe pillars for stronger signals.
One of the strengths of this indicator is it can let you know when markets are sideways – so in general you can know to avoid entering when the Confluence Strength is low, indicating disagreement among the pillars.
Customization Options
The Six Pillars indicator offers a wide range of customization options, allowing traders to tailor the tool to their specific needs and trading style. Here are the key customizable elements:
Comparison Timeframe:
Users can select any timeframe for comparison with the current timeframe, providing flexibility in multi-timeframe analysis.
Trend Pillar:
Fast EMA Period: Adjustable for quicker or slower trend identification
Slow EMA Period: Can be modified to capture longer-term trends
Momentum Pillar:
MACD Fast Length
MACD Slow Length
MACD Signal Length These can be adjusted to fine-tune momentum sensitivity
DM Pillar:
ADX Period: Customizable to change the lookback period for trend strength measurement
ADX Threshold: Adjustable to define what constitutes a strong trend
Stochastic Pillar:
Stochastic Period: Can be modified to change the sensitivity of overbought/oversold readings
Fractal Pillar:
Fractal Period: Adjustable to identify potential reversal points over different timeframes
OBV Pillar:
Short OBV EMA
Medium OBV EMA
Long OBV EMA These periods can be customized to analyze volume trends over different timeframes
These customization options allow traders to experiment with different settings to find the optimal configuration for their trading strategy and market conditions. The flexibility of the Six Pillars indicator makes it adaptable to various trading styles and market environments.

PUMP IndicatorsPUMP Indicator Description
★ Supported Markets and Assets
The PUMP indicator is a versatile tool that can be effectively applied to various markets and assets, including:
▶ Korean Stocks: KOSPI, KOSDAQ, etc.
▶ U.S. Stocks: NYSE, NASDAQ, etc.
▶ Cryptocurrencies: Major cryptocurrencies such as Bitcoin (BTC), Ethereum (ETH), etc.
▶ Futures: Major futures contracts like gold, silver, crude oil, etc.
▶ ETFs: SPY, QQQ, etc.
★ Indicator Description
The PUMP indicator is designed to analyze price divergence and volatility.
It is provided with minimal representation on the chart, allowing users to use it in conjunction with other indicators, such as classical RSI, TRIX, CCI, ADX, BWI, Bollinger Bands, etc.
Everything displayed on the chart can be turned on or off in the options, allowing users to customize their setup.
The PUMP indicator is based on the concept of the MACD indicator, which calculates the difference between the leading line and the lagging line to generate signals.
GOOD, UP, and CR signals predict price increases.
DOWN and BAD signals predict price decreases.
WARN emphasizes that the buy position is not certain, regardless of price increases or decreases.
Therefore, the PUMP indicator is good to use with other indicators. It visually displays divergence and volatility signals along with the MACD movements below, and users can receive alerts for movements in their interested stocks using the alarm function.
It can be used as an indicator for viewing buy and sell signals, as well as predicting the price flow.
▶ (Drawback) Unlike typical TRIX, RSI, TRIX, CCI, ADX, BWI indicators, which are implemented in a new lower window, the PUMP indicator displays both signals and the leading and lagging lines simultaneously, so it is not implemented in a new window, meaning the baseline may vary depending on the daily chart appearance.
★ The PUMP indicator consists of the following components:
▶ PUMP Indicator Leading and Lagging Lines
PUMP t: Leading line (yellow)
PUMP p: Lagging line (blue)
The MACD displayed at the bottom of the chart calculates the divergence between the PUMP t leading line and the PUMP p lagging line.
▶ EA Formula
The core calculation of the PUMP indicator is as follows:
EA (Exponential Average): 100 * (eavg1 / eavg2)
Where eavg1 is the short-term EMA, and eavg2 is the long-term EMA.
It calculates the divergence of the index.
▶ The PUMP indicator is a fixed indicator (cannot be arbitrarily modified).
▶ Highlights: The method of calculating the interval or number of uses is an important part of the index calculation and is therefore private.
★ Signal Description
The PUMP indicator provides a total of six major signals:
▶ UP Signal: Occurs when the divergence between the MACD PUMP t leading line and PUMP p lagging line narrows, and the divergence of the exponential moving average widens compared to before.
▶ DOWN Signal: Occurs when the MACD PUMP t leading line crosses above the PUMP p lagging line.
▶ GOOD Signal: Represents an UP signal with added volume.
(The GOOD signal is not necessarily better than the UP signal. If a GOOD signal appears in a stock that has sufficiently fallen in price, it helps understand that a rebound has started. Therefore, the GOOD signal is made to find a rebound in stocks that have continuously declined, rather than finding signals in consistently rising prices.)
▶ BAD Signal: Occurs when the PUMP t leading line crosses above the 0 baseline, indicating a potential sell signal.
▶ WARN Signal: A warning signal occurring at high levels, indicating that buying is not recommended (regardless of buy or sell).
▶ CR Signal: Occurs in all sections where the PUMP t leading line crosses below the PUMP p lagging line.
★ Lower MACD Horizontal Baseline
The PUMP indicator provides three horizontal baselines from the MACD indicator for additional analysis:
▶ Pump H
▶ PUMP M
▶ PUMP L
It visually provides the divergence of the lower MACD indicator for rising and falling changes, with the default set to 0, and users can change the numbers in the options as needed.
★ Moving Averages
The PUMP indicator provides three basic moving averages:
▶ Buzz 7: 7-day moving average
▶ Buzz 26: 26-day moving average
▶ Buzz 120: 120-day moving average
The number of moving averages is fixed, but users can use them in conjunction with the moving averages provided by TradingView as needed.
★ Alert Function
Using the Alert function of TradingView, you can set alerts for various signals generated by the PUMP indicator.
▶ GOOD Signal Alert
▶ UP Signal Alert
▶ CR Signal Alert
▶ DOWN Signal Alert
▶ BAD Signal Alert
▶ WARN Signal Alert
★ Usage
1. The PUMP indicator is not focused on buy and sell signals but calculates the current price movement and divergence and is designed to express it through MACD leading and lagging lines and signals.
2. The PUMP indicator can be used alone or in conjunction with other indicators for technical analysis.
3. You can analyze buy and sell using the signals of the PUMP indicator along with fundamental analysis, such as news, issues, national policies, company profits, and sales increases.
4. The MACD leading and lagging lines at the bottom of the chart move inversely to the price, ensuring that the PUMP indicator does not interfere when used with other indicators.
5. You can receive real-time alerts using the alarm function.
Below, we attach pictures to help users understand.
============================================
PUMP 인디케이터 설명(한글)
★ 지원되는 시장 및 자산
PUMP 표시기는 다음과 같은 다양한 시장 및 자산에 효과적으로 적용할 수 있는 다용도 도구입니다:
▶ 한국주식: KOSPI, KOSDAQ 등.
▶ 미국주식: NYSE, NASDAQ 등.
▶ 암호화폐: 비트코인(BTC), 이더리움(ETH) 등 주요 암호화폐.
▶ 선물 : 금, 은, 원유 등 주요 선물 계약.
▶ 상장지수펀드(ETF) : SPY, QQQ 등.
★ 지표 설명
PUMP 지표는 가격 이격과 변동성을 분석하도록 설계되었습니다.
사용자가 만든 지표 또는 고전 RSI, TRIX, CCI, ADX, BWI, Bollinger Bands 등과 함께 사용할 수 있게 차트에 최소한의 표현으로 제공됩니다.
그리고 차트에 표현되는 모든 것들을 옵션에서 on / off 가능하게 하였기에 사용자가 커스텀 할 수 있게 하였습니다.
PUMP 지표 신호를 생성하기 위해 선행 라인과 후행 라인 간의 차이를 계산하는 MACD 지표의 개념을 기반으로 합니다.
GOOD, UP, CR 신호는 가격 상승을 예측합니다.
DOWN, BAD 신호는 가격 하락을 예측합니다.
WARN은 가격 상승과 하락에 관계없이, 매수 자리는 확실히 아님을 강조한 신호입니다.
그러므로 PUMP 지표는 다른 지표와 함께 사용하기 좋고, 이격과 변동성을 신호와 하단 MACD 움직임을 눈으로 볼 수 있으며, 알람 기능을 활용하여 관심 있는 종목의 움직임을 알람으로 받아 볼 수 있는 지표입니다.
매수와 매도를 보는 지표로 사용할 수 있으며, 가격의 흐름을 예상하는 지표로 사용할 수 있습니다.
▶ (단점) 보통의 TRIX, RSI, TRIX, CCI, ADX, BWI 지표들은 하단의 새로운 창에서 구현됩니다. 하지만 PUMP 지표는 신호와 하단 선행과 후행을 동시에 표현하기 때문에 새로운 창에서 구현되지 않기에 기준 축이 일봉의 모습에 따라 달라질 수 있습니다.
★ PUMP 지표는 다음과 같은 구성요소로 구성됩니다
▶ PUMP 지표 선행과 후행
PUMP t : 선행라인 (노란색)
PUMP p : 후행라인 (파란색)
차트 하단에 나타나는 MACD는 PUMP t선행라인과 PUMP p 후행라인의 이격도를 계산합니다.
▶ EA공식
PUMP 지표의 핵심 계산식은 다음과 같습니다:
EA(지수평균): 100 * (eavg1 / eavg2)
여기서 eavg1은 단기 EMA이고 eavg2는 장기 EMA입니다.
지수의 이격도를 계산합니다.
▶ PUMP 지표는 고정 지표입니다. (임의 수정 불가)
▶ 강조 : 이격의 계산법이나 사용하는 숫자는 지표 계산의 중요한 부분이므로 비공개입니다.
★ 신호 설명
PUMP 표시등은 총 6개의 주요 신호를 제공합니다:
▶ UP 신호: MACD PUMP t 선행과 PUMP p 후행의 이격이 줄어들 때, 지수 이동 평균의 이격도가 이전 보다 넓어지면 발생합니다.
▶ DOWN 신호: MACD PUMP t 선행이 PUMP p 후행을 상향 교차할 때 발생합니다.
▶ GOOD 신호: 거래량이 추가된 UP 신호를 나타냅니다.
(GOOD 신호가 UP 신호보다 좋다기 보다, 충분히 가격 하락한 종목에서 GOOD 신호가 나온다면 반등이 시작되는 것을 이해할 수 있게 만든 지표입니다. 그러므로 GOOD 신호는 가격이 꾸준히 상승하는 곳에서 신호를 찾기보다, 지속 하락하다 반등을 찾는 신호로 만들었습니다.)
▶ BAD 신호: PUMP t 선행이 0 기준선 이상으로 교차할 때 발생하며, 이는 잠재적인 판매 신호를 나타냅니다.
▶ 경고 신호: 높은 수준에서 발생하는 경고 신호로, 매수가 권장되지 않음을 나타냅니다(매수, 매도와 무관함).
▶ CR 신호: PUMP t 선행 라인이 PUMP p 후행 라인 아래로 교차하는 모든 구간에서 발생합니다.
★ 하단 MACD 가로 기준선
PUMP 표시기는 추가 분석을 위해 MACD 지표에서 3가지 가로 기준을 제공합니다:
▶ pump H
▶ PUMP M
▶ PUMP L
하단의 MACD 지표의 이격도를 상승 및 하강의 변화를 시각적으로 기준을 만들 수 있게 제공하며, 기본은 0으로 제공하고, 사용자의 필요에 따라 옵션에서 숫자를 변경할 수 있게 하였습니다.
★ 이동 평균
PUMP 표시기는 세 가지 기본 이동 평균을 제공 합니다:
▶ Buzz 7: 7일 이동 평균
▶ Buzz 26: 26일 이동 평균
▶ Buzz 120 : 120일 이동 평균
이동 평균의 수는 고정되어 있지만, 사용자는 필요에 따라 TradingView에서 제공하는 이동 평균과 함께 사용할 수 있습니다.
★ 알림 기능
TradingView의 Alert 기능을 사용하여 PUMP 지표 생성되는 다양한 신호에 대한 Alert를 설정할 수 있습니다.
▶ GOOD 신호 알림
▶ UP 신호 알림
▶ CR 신호 알림
▶ DOWN 신호 알림
▶ BAD 신호 알림
▶ WARN 신호 알림
★ 사용법
1.PUMP 지표는 매수와 매도에 중점을 둔 지표가 아니며 현재 가격의 움직임과 이격도를 계산하며 MACD 선행과 후행 그리고 신호로 표현하기 위해 만들어진 지표입니다.
2. PUMP 지표는 단일로 사용할 수 있고, 또는 다른 지표와 함께 기술적분석으로 사용할 수 있습니다.
3. 뉴스와 이슈, 국가의 정책, 회사의 이익, 매출의 상승 등 기본적분석과 함께 PUMP 지표의 신호를 이용하여 매수와 매도 분석을 할 수 있습니다.
4. 차트 하단의 MACD 선행과 후행은 가격의 움직임을 반대로 움직이며, 가격과 반대로 움직이게 함으로써 다른 지표와 함께 사용하였을 때, PUMP 지표가 방해가 되지 않게 하였습니다.
5. 알람을 사용하여 실시간으로 알람을 받아 보실 수 있습니다.
아래 사진을 첨부하여 사용자 이해를 돕습니다.
============================================
UP신호는 이격을
▶ The UP signal indicates horizontal divergence.
CR신호는 선행이 후행을 아래로 돌파
▶ The CR signal indicates vertical divergence when the leading line crosses below the lagging line.
WARN 신호를 확인
▶ Check the WARN signal.
BAD와 DOWN 신호
▶ BAD and DOWN signals.
PUMP 지표의 기준 3개
3 criteria for PUMP indicators
따로 그림을 그리지 않은 차트
▶ A chart without separate drawings.
============================================
다른 지표와 + 조합
+ Combination with other indicators

Stocksgeeks MBIThis indicator displays the Stocksgeeks market breadth dashboard for NSE (India) stocks.
Market breadth provides insights into the participation of stocks in a market's movement & the conviction in the overall mood of the underlying index. Various interpretations of market breadth exist, including gauging the quantity of new highs and new lows, or the number of advancing & declining stocks, or the percentage of stocks above or below certain moving averages.
This dashboard includes the following metrics:
4R
A count or ratio of advancing & declining stocks objectively depicts their participation in an index or stock universe. A positive market breadth is said to happen when more stocks are advancing than are declining.
The 4R column is based on 4% advances & declines.
The advances are calculated as the number of stocks having a daily percentage change ≥ 4% divided by the total number of stocks having a daily percentage change < -4%.
4R is the ratio between NSE (India) stocks advancing or declining by 4% daily.
4 chg is the % change from yesterday’s 4R value to today’s 4R value.
20R
When most of the stocks are trading above a specific moving average, the market breadth is termed strong. This dashboard uses 20-day EMA for short-term timeframes.
20R is the ratio between the % of NSE (India) stocks above & below the 20-day moving average.
20 chg is the % change from yesterday’s 20R value to today’s 20R value.
50R
For medium to long-term timeframes, this dashboard uses 50-day EMA.
50R is the ratio between the % of NSE (India) stocks above & below the 50-day moving average.
50 chg is the % change from yesterday’s 50R value to today’s 50R value.
52WH &52WL
These 2 columns display the net number of stocks on NSE (India) making new 52-week highs or new 52-week lows. A market is considered strong (bullish) when new highs exceed new lows.
Interpretation
The 52 week highs must be greater than 52 weeks lows for a bullish bias.
This is how the individual columns are coded:
4R: above 200 is green, below 50 is red
20R: above 75 is green, below 50 is red
50R: above 85 is green, below 60 is red
For all the changes (4 chg, 20 chg, 50 chg): above 20 is green and below -20 is red
To decide the overall color for the day, we subtract the number of red boxes from the number of green boxes for the day. If the output is greater than equal to 3, then the day color is green, and if this is less than equal to -3 then the day color is red. In case of no consensus, the overall day color is neutral.
The color of the 20R & 50R indicates the trend (green is uptrend, & red is downtend). The color of the 4R column & the chg columns (4 chg, 20 chg, 50 chg) indicates the strength of the trend.
Features
⦿ Expanded mode : This is the default state & displays the market breadth for the past 10 days.
⦿ Mini mode : This displays only the overall color for the day.
⦿ One-day mode : Turning off both the expanded & the mini mode displays the one-day mode, which displays the market breadth columns for the current day only.
⦿ Dark mode : One-click dark mode, as usual.
Dependency
The script uses the Pine Seeds service to import custom data hosted in a GitHub repository and accesses it via TradingView as the frontend. So, the number of bars appearing on charts is fully dependent on the amount of historical data available. Any error or omission, if there, is a reflection of the hosted data, & not that of Tradingview.
Limitations
Such data has some limitations, like it can only be updated at EOD (End-of-Day), & only daily-based timeframes can be applied to such data. Irrespective of the intraday changes, only the last saved value on the chart is seen. So, it's best to use this script as EOD, rather than intraday. At the time of publication of this script, 375 days of historical data was available.
Credits
The Stocksgeeks interpretation of the market breadth is from Umang , who has graciously allowed his concepts to be coded into a script for TradingView. This script uses the NSE Market Breadth data from Chhirag_Kedia via a pine seed from EquityCraze . Hats off to these amazing individuals, without whose efforts, such scripts wouldn't have seen the light of this day!

Macro Risk On/Off SentimentOverview
As an Ichimoku trader, I've always found it crucial to understand the broader market sentiment before entering trades. That's why I developed this Macro Risk On/Off Sentiment Indicator. It's designed to provide a comprehensive view of global market risk sentiment by analysing multiple factors across different asset classes. By combining nine key market indicators, it produces an overall risk sentiment score, giving me a clearer picture of the market's mood before I apply my Ichimoku strategy.
Rationale
While Ichimoku is powerful for identifying trends and potential entry points, I realised it doesn't always capture the broader market context. Markets don't exist in isolation—they're influenced by a myriad of factors including volatility, economic indicators, and cross-asset relationships. By creating this indicator, I aimed to fill that gap, providing myself with a macro view that complements my Ichimoku analysis.
How It Works
The indicator analyses nine different market factors:
VIX (Volatility Index): Measures market expectations of near-term volatility.
S&P 500 Performance: Represents the overall US stock market performance.
US 10-Year Treasury Yield: Indicates bond market sentiment and economic outlook.
Gold Price Movement: Often seen as a safe-haven asset.
US Dollar Index: Measures the strength of the USD against a basket of currencies.
Emerging Markets Performance: Represents risk appetite for higher-risk markets.
High Yield Bond Spreads: Indicates credit market risk sentiment.
Copper/Gold Ratio: An economic growth indicator.
Put/Call Ratio: Measures overall market sentiment based on options trading.
Each factor is assigned a score based on its z-score relative to its recent history, then weighted according to its perceived importance. The overall risk score is a weighted average of these individual scores.
How I Use It
Before applying my Ichimoku strategy, I first check this indicator to gauge the overall market sentiment:
I look at the blue line plotted on the chart, which represents the overall risk score.
I note the background colour: green for risk-on (positive score) and red for risk-off (negative score).
I check the label in the lower-left corner, which provides specific FX pair recommendations and market expectations.
In a risk-on environment (positive score):
I focus on long positions in AUD/JPY, NZD/JPY, EUR/USD, etc.
I look for short opportunities in USD/CAD, USD/NOK, etc.
I expect commodities and yields to rise
In a risk-off environment (negative score):
I focus on long positions in USD/JPY, USD/CHF, USD/CAD
I look for short opportunities in AUD/USD, NZD/USD, EUR/USD
I expect increased volatility and falling yields
The strength of the sentiment is reflected in how close the score is to either 1 (strong risk-on) or -1 (strong risk-off). This helps me gauge how aggressive or conservative I should be with my Ichimoku trades.
Customisation
I've designed this indicator to be flexible. You can modify it to:
Adjust the lookback period and moving average length (both default to 30)
Change the weighting of different factors in the final score calculation
Include or exclude specific factors based on your analysis needs
By combining this Macro Risk On/Off Sentiment Indicator with my Ichimoku analysis, I've found I can make more informed trading decisions, taking into account both the technical setups I see on the chart and the broader market context.

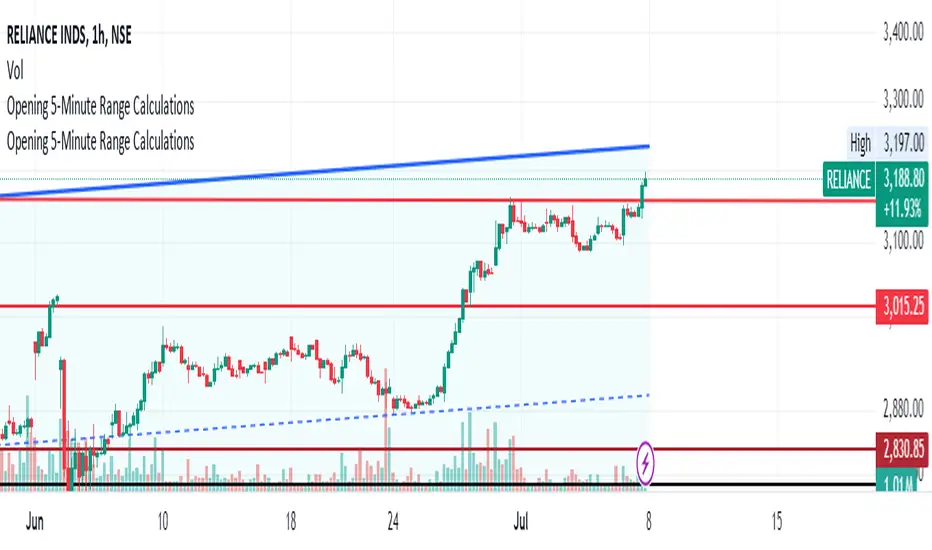
PI indicatorOpening 5-Minute Range Candle (A):
This represents the price range during the first 5 minutes of the trading day.
You can plot this as a vertical line connecting the high and low of the 5-minute candle.
Additionally, you can display the range values (high and low) as labels or in a table.
Multiply Opening Range Candle (A) with π (PI) Value (B):
Calculate the product of the opening range candle (A) and the value of π (approximately 3.14).
Plot this value as a line on the chart.
Optionally, you can label this line with the calculated value.
Divide B by 2 ©:
Divide the value obtained in step 2 (B) by 2.
Plot this value as another line on the chart.
You can also label this line with the calculated value.
Add C to A (D):
Sum the value of C (from step 3) with the opening range candle (A).
Plot this sum as a line on the chart.
Label this line accordingly.
Add C to D (E):
Add the value of C (from step 3) to the value of D (from step 4).
Plot this sum as another line on the chart.
Label it appropriately.
Add D to E (F):
Finally, add the value of D (from step 4) to the value of E (from step 5).
Plot this sum as a line with a distinct style (e.g., dashed or dotted) on the chart.
Label this line as well.
Remember that these steps involve mathematical calculations and plotting lines on the chart. You can customize the appearance (color, style, thickness) of each line and label according to your preferences. Additionally, consider adjusting the time frame to accurately capture the opening 5-minute range at 9:20:50 am.