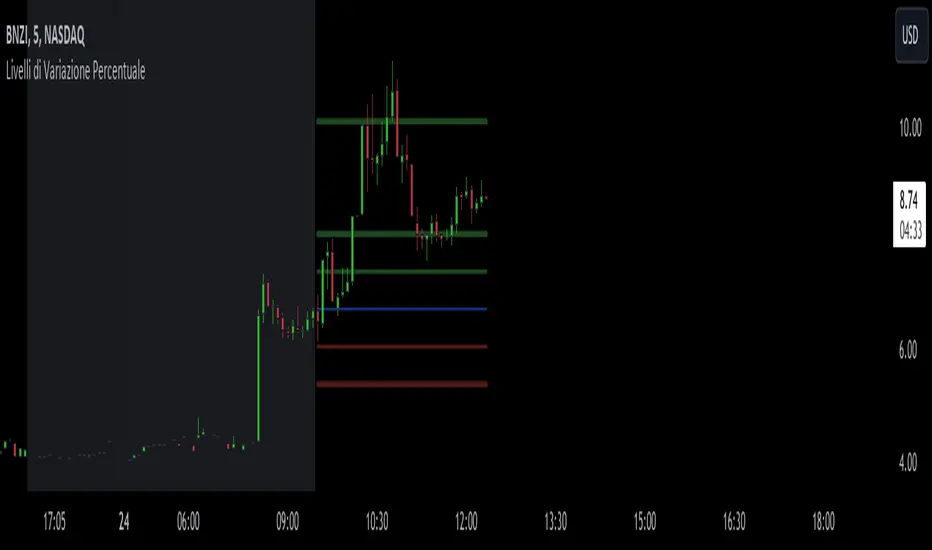
Levels of Percentage Changestatic indicator which is used to display predefined pushes compared to the opening price, only and exclusively in the current session.
at the end of the session, therefore at 4.00pm NYC the lines will be automatically cancelled.
and will be displayed again when the markets open the following day, therefore at 09.30 am NYC.
+10% / +20% / +50% / +100% GREEN
-10% / -20% RED
BLUE line is the open price
Breadth Indicators
TechniTrend: Relative Volume IndexRelative Volume Index (RVI)
Short Description:
Relative Volume Index (RVI) with customizable volume bands, moving averages, and alerts for high and low volume thresholds. Includes options for displaying daily and weekly relative volume for enhanced analysis.
Full Description:
The Relative Volume Index is a powerful and versatile tool designed to help traders easily identify volume trends and anomalies in the market. By comparing the current volume to its moving average, this indicator highlights significant increases or decreases in relative volume, allowing traders to catch potential breakouts, breakdowns, or volume spikes early on.
Key Features:
Relative Volume Comparison : Compares the current volume to the moving average volume over a customizable period, highlighting overbought and oversold conditions.
Volume Alerts : Customizable alert thresholds for high and low relative volume to quickly notify traders when volume exceeds predefined limits.
Custom Moving Averages : Choose from various moving average types (SMA, EMA, WMA) to calculate the average volume over a given length.
Volume Normalization : For better readability, volumes greater than 1000 are divided by 1000 and displayed with a 'K' suffix (thousands).
Volume Bands : Configurable high, average, and low volume bands for visual reference.
Daily Relative Volume : Option to display the daily relative volume in comparison to its daily average.
Weekly Average Volume : Option to display the weekly average volume for broader market trends.
Customization Options:
Length : Customize the period for calculating the moving average.
Volume Moving Average : Toggle to show/hide the volume moving average (normalized in 'K').
Alerts : Set thresholds for high and low volume alerts and configure alerts for immediate notification.
Volume Bands : Toggle to show/hide volume bands for easy visual identification of volume zones.
Daily/Weekly Relative Volume : Optional display of relative volume data on a daily and weekly basis.
This indicator provides traders with a more intuitive view of market volume dynamics, making it easier to spot significant volume changes and take action accordingly.
Recommended Settings:
High Volume Alert Threshold: 2.0
Low Volume Alert Threshold: 0.5
Length for Moving Average Calculation: 14
Show Weekly Average Volume: On for broader trend insights
Use this indicator to stay ahead of market moves by monitoring volume trends with precision.
Alerts:
High Volume Alert : Get notified when relative volume exceeds your high threshold.
Low Volume Alert : Get notified when relative volume drops below your low threshold.

Cumulative Volume Delta Divergence [TradingFinder] Periodic EMA🔵 Introduction
The Cumulative Volume Delta (CVD) is a powerful tool in technical analysis that is derived from market volume or trading activity. The Cumulative Volume Delta Divergence Detector Indicator helps traders identify Cumulative Volume Delta Divergences (CVD Divergence), which can provide reliable trading signals.
These divergences, such as bullish and bearish CVD divergences, act as key indicators of potential trend reversals in financial markets. By analyzing CVD divergences, traders can gain insights into the strength of buying and selling pressure and make more informed predictions about price trends.
The CVD indicator is particularly effective for traders who engage in day trading and scalping, as it helps identify price reversal points by analyzing volume and price behavior.
Using the CVD indicator in combination with other technical tools such as support and resistance levels and candlestick patterns allows for a more accurate market analysis.
🔵 How to Use
Divergences are one of the most important technical analysis signals that indicate the current strength of a price move may not be sustainable.
Cumulative Volume Delta Divergence helps traders identify potential trading opportunities that may not be visible on the price chart alone.
This type of divergence examines the relationship between buying and selling volume and price, enabling traders to better understand price trends.
🟣 Bullish CVD Divergence
A bullish CVD divergence occurs when the price makes a lower low, but the CVD indicator shows a higher low. This indicates increasing buying pressure in the market, even though the price is declining. In other words, despite the price dropping, buyers are gradually gaining strength, which could signal a price reversal and the start of a bullish trend.
How to use this signal : In this scenario, traders looking to go long can use this signal as a favorable opportunity to enter the market. After a bullish divergence, the market typically tends to move upward.
To reduce risk, traders can wait for further confirmation from the price chart. For example, if the price breaks through the previous high after the divergence or breaks a resistance level, this could be a more reliable signal for entering the market.
🟣 Bearish CVD Divergence
A bearish CVD divergence is the opposite of a bullish divergence. In this type of divergence, the price makes a higher high, but the CVD indicator shows a lower high. This indicates decreasing buying pressure and weakening momentum in the current bullish trend. A bearish divergence often serves as a warning of a potential market reversal to the downside.
How to use this signal : Traders can use this divergence as an opportunity to exit long positions or enter short positions. When the CVD indicator makes a lower high compared to the price, it signals weakness in buyer strength.
If traders receive further confirmation from the price chart, such as a break of key support levels or an increase in selling volume, this can serve as a stronger signal for the beginning of a bearish trend.
🟣 How to Build a Trading Strategy with Cumulative Volume Delta Divergence
Using CVD divergence alone may not be sufficient. Traders should combine this tool with other technical analysis techniques and indicators to have more confidence in their decisions. For example, when observing a CVD divergence, traders can also analyze volume, trend lines, or candlestick patterns to get a more accurate market analysis.
Additionally, risk management should always be a priority. Using stop-loss orders and properly sizing trades can help traders minimize their losses if they make a mistake.
🔵 Setting
Divergence Fractal Period : Determines the period of swings. The minimum and default value is 2.
CVD Period : You can set the period of " Periodic " and " EMA " modes.
Cumulative Mode : It has three modes "Periodic" and "EMA". In "Periodic" mode, it accumulates the volume periodically and in "EMA" mode, it calculates the moving average of the volume.
Market Ultra Data : If you turn on this feature, 26 large brokers will be included in the calculation of the trading volume. The advantage of this capability is to have more reliable volume data. You should be careful to specify the market you are in, FOREX brokers and Crypto brokers are different.
🔵 Conclusion
The Cumulative Volume Delta (CVD) indicator is a powerful tool in technical analysis, helping traders better identify price trends and make more accurate market predictions. By identifying CVD divergences, traders can anticipate price reversals and time their market entries and exits accordingly.
Bullish and bearish CVD divergences each provide valuable signals that can help traders identify the best entry and exit points in the market. A bullish CVD divergence signals strength in buying that will likely lead to a price increase, while a bearish CVD divergence indicates weakness in the bullish trend and the potential for the beginning of a bearish trend.
Overall, combining CVD with other technical analysis tools and employing risk management strategies can help traders make better trading decisions and capitalize on available market opportunities.

Sector Performance v0.3Sector Performance Dashboard v0.3 (Work In Progress)
- Provides a comprehensive view of sector and stock performance across multiple timeframes
Features:
- Displays performance data for various Indian market sectors and their constituent stocks
- Allows selection of different sector groups (e.g., NIFTY, BANKNIFTY, CNXAUTO, etc.)
- Shows performance over four customizable time periods (default: Year, Quarter, Month, Week)
- Calculates percentage change for each time period
- Presents current price, 250-day high and low, and percentage distance from these extremes
- Uses color-coding to quickly identify positive (green) and negative (red) performance
- Adjustable text size for better visibility
- Functionality:
- Creates a table in the center of the chart
- Populates the table with up to 15 symbols per sector
- Updates data in real-time on daily timeframe
- Allows for easy comparison of different stocks within a sector
- User Inputs:
- Sector selection
- Four customizable date inputs for different time periods
- Adjustable text size for the table
- Use Cases:
- Quick sector rotation analysis
- Identifying outperforming and underperforming stocks within a sector
- Monitoring multiple timeframes simultaneously for comprehensive market view
- Assisting in stock screening and selection process

NIFTY - Heatmap [DRK]Nifty 50 Heatmap by Percentage Change
This Pine Script generates a dynamic heatmap for the top 40 weighted stocks in the Nifty 50 index, ordered by their percentage change. The heatmap visually represents the performance of these stocks, with green indicating positive changes and red indicating negative changes.
Features :
Real-time Updates : The heatmap updates in real-time, providing an up-to-date snapshot of market performance.
Color Coding : Stocks are color-coded based on their percentage change, making it easy to identify gainers and losers at a glance.
Future Enhancements:
Indicator : Planned updates include popups or descriptions that provide additional insights, such as key indicators and their positive or negative signals.
Detailed Analysis : Future versions will offer more detailed analysis and insights to help traders make informed decisions.
Stay tuned for these exciting updates!

MAG8 Market breadth RSI [INVESTIC]The MAG8 Market Breadth RSI Indicator is a powerful tool that tracks the RSI (Relative Strength Index) levels of eight market-influencing stocks: Meta, Amazon, Netflix, Google, Tesla, Microsoft, Apple, and Nvidia.
The indicator consists of two key components:
- Green Line (Stocks Trading Above RSI 80): This shows the number of stocks that are overbought, suggesting they are trading at high momentum levels. When the green line rises, it signals potential exhaustion in these stocks, which could be an opportunity to take profits or prepare for a reversal.
- Red Line (Stocks Trading Below RSI 20): This line indicates the number of stocks that are oversold and potentially undervalued. A rising red line suggests a buying opportunity, as these stocks could be poised for a rebound.
image :
Why MAG8 RSI breadth Indicator?
This indicator is invaluable for identifying extreme market conditions across the most influential stocks. When the green line rises, it could signal the market is nearing a peak, helping you time your exits. On the other hand, when the red line increases, it may highlight oversold conditions, offering prime buying opportunities. By using this tool, you can make more informed decisions and align your trades with market momentum.

best indicator at 15 minut This Pine Script code builds an indicator called EMA Crossover with Historical Price Projection that combines two components:
EMA Crossover Strategy:
EMA 9 and EMA 21: The script calculates two exponential moving averages (EMAs) using the ta.ema() function. The crossover between these EMAs generates buy/sell signals.
A bullish crossover (when EMA 9 crosses above EMA 21) signals a buy.
A bearish crossover (when EMA 9 crosses below EMA 21) signals a sell.
These buy/sell signals are visualized on the chart using the plotshape() function with green and red symbols.
Historical Price Projection:
The code projects future prices based on historical price trends. It takes into account growth factors (user-defined drift percentages) to estimate future prices.
Projection Line: It draws a projection line from the anchor point (set by the user) using historical data. The drift factor allows you to control the projection's slope.
Forecasting Area: It shows an optional area around the projected price, adjusting the width with a user-defined growth factor for the forecast's uncertainty.
Key Sections:
Inputs:
User-defined inputs for controlling the growth factor, line styles, and forecasting area settings.
An anchoring point is provided to determine from which bar the price projection should start.
EMA Crossover:
The crossover conditions for EMA 9 and EMA 21 are defined, and the script generates buy and sell signals at those crossovers.
Historical Price Projection:
It stores the percentage changes between bars in barDeltaPercents.
It projects the future price based on these percentages and the user-defined drift factor.
The projected price is visualized using polyline.new(), and a shaded area can be added to show the range of price possibilities.
Execution Logic:
The script runs when the current time is greater than the anchor point.
If the anchor point is too far back in history, it gives a warning via the showInfoPanel function.
As new bars are confirmed, the drift is calculated, and the projection line and area are updated based on historical price changes.
Overall Flow:
It gathers price data up to 500 bars from the anchor point.
Based on the historical price trend, it forecasts the future price with a projection line and an optional shaded area.
The crossover logic for EMA 9 and 21 provides actionable signals on when to buy or sell.

PATTERNPULSE / Stttrading F.VelazquezPATTERNPULSE
Discover a powerful tool for market analysis with the Velas Engulfing + RSI Indicator. Crafted by Stttrading Franco Velazquez, this indicator seamlessly blends engulfing candle patterns with the precision of the RSI filter. What sets it apart is its unique approach – signals are exclusively generated when the RSI reaches overbought or oversold conditions, providing a distinctive edge over conventional engulfing candle indicators.
Key Features :
Engulfing Candle Patterns: Identify both bullish and bearish engulfing candle formations.
RSI Integration: Harness the strength of the RSI indicator to evaluate market momentum and potential reversals.
Visual Signals: Enjoy clear and intuitive signals directly on your chart for seamless decision-making.
Configurable Alerts: Tailor the indicator to your preferences with customizable alerts for timely notifications.
Usage Instructions:
Engulfing Candles:
Visualize bullish and bearish candles through green and red triangles, respectively.
Capitalize on buying opportunities when bullish candles emerge and consider selling when bearish candles unfold.
RSI Indicator:
Leverage the RSI indicator to gauge overbought and oversold market conditions.
Fine-tune RSI levels based on your trading strategy and risk tolerance.
Alert System:
Set up alerts to stay informed about crucial market movements, ensuring you never miss a trading opportunity.
Custom Configuration:
RSI Source: Customize the data source for RSI calculations to suit your analysis.
RSI Length: Define the length of the RSI period for precise adjustments.
RSI Overbought and Oversold Levels: Tailor the overbought and oversold RSI thresholds to align with your trading preferences.
Important Note: Always conduct thorough analysis and implement proper risk management before executing trades.
Volume Profile in PatternPulse:
In the paid version of the PatternPulse indicator, an advanced Volume Profile tool is included, offering a detailed view of how volume is distributed across different price levels over a specific period. Here's how it works:
Show Volume Profile: You can toggle the display of the volume profile on the chart using the Show VP option.
Depth and Number of Bars Configuration: The tool allows you to adjust the Volume Profile Lookback Depth, which defines how many periods back will be analyzed to calculate the volume profile. You can also set the number of bars (VP Number of Bars) to be displayed on the chart, as well as the bar length and width to customize its appearance.
Delta Type: You can choose from different delta types for the volume profile: Bullish, Bearish, or Both. This enables you to focus on volumes associated with bullish price movements, bearish movements, or both.
Point of Control (POC): The tool also offers an option to extend the Point of Control (POC) line on the volume profile. The POC represents the price level with the highest traded volume during the analyzed period.
Customizable Colors: You can customize the colors of the volume profile bars and the Point of Control (POC) to match your visual preferences.
How to Use It:
The volume profile helps identify price levels where significant volume has been traded, which can be crucial for determining key support and resistance levels in the market. Adjust the parameters to fit your needs for a clear and precise visualization that supports your technical analysis.
Info Box in PatternPulse
In the paid version of PatternPulse, you'll find an info box that provides a comprehensive view of various market aspects. Here's how it works:
General Information: At the top of the info box, you'll see the title "PATTERNPULSEVIP® Info. BOX" in grey with orange text. This title helps you identify that you are viewing the information section.
CCL Dollar: The info box displays the value of the CCL (Contado con Liquidación) dollar for Argentina, which is an important reference for investors in that market.
Indices and Metals: This section includes information on the US Dollar Index (DXY), the Euro Index (EXY), as well as the prices of gold and silver.
Crypto Dominance: Here, you'll see the dominance of Bitcoin (BTC) and Ethereum (ETH) in the cryptocurrency market, helping you understand the influence of these cryptocurrencies on the global market.
MACD: The info box shows the current MACD (Moving Average Convergence Divergence) trend. The trend can be bullish or bearish, providing additional insight into market direction.
RSI: The current RSI (Relative Strength Index) value is also displayed. If the RSI indicates overbought conditions (above 75), the info box will turn teal with white text. If it indicates oversold conditions (below 25), the info box will turn maroon with white text.
Customization: You can adjust the horizontal offset of the info box from the chart and change the style and color of the text to suit your visual preferences.
This info box provides key data at a glance, making it easier to make informed decisions in your technical analysis. Adjust the settings according to your needs to get the most relevant information for your trading strategy.
Bollinger Bands in PatternPulse
In the paid version of PatternPulse, we’ve added the Bollinger Bands (BB) indicator to help you analyze market volatility and trends. Here’s a breakdown of how to use it:
1. Display Options:
Show BB: You can toggle the visibility of the Bollinger Bands on your chart using the "Show BB" option.
2. Configuration:
Length: Adjust the length of the moving average used to calculate the Bollinger Bands. The default is set to 20 periods, but you can modify it to fit your trading strategy.
Source: Choose the data source for the Bollinger Bands calculation, with the default being the closing price.
Standard Deviation: Set the number of standard deviations away from the moving average for the upper and lower bands. The default is 2.0, which is commonly used.
3. Plotting:
Basis: The middle line (basis) of the Bollinger Bands is plotted, which is a simple moving average (SMA) of the specified length.
Upper and Lower Bands: The upper and lower bands are plotted based on the standard deviation from the basis line.
Offset: Adjust the horizontal position of the bands on your chart to better align with your analysis needs.
4. Visualization:
Color: The Bollinger Bands and their background fill are color-coded for easy interpretation. The default colors are shades of blue, but you can customize them if needed.
These Bollinger Bands will help you to visualize price volatility and identify potential market opportunities based on how the price interacts with these bands. Adjust the settings according to your trading preferences to get the most out of this feature.
Parabolic SAR in PatternPulse
In the advanced version of PatternPulse, we've added the Parabolic SAR (PSAR) to help you identify potential trend changes in the market. Here's how this tool works:
1. Activating the Indicator:
Show PSAR: You can toggle the visibility of the Parabolic SAR using the "Show PSAR" option. This controls whether the indicator is displayed on your chart.
2. PSAR Settings:
Start: Adjust the initial value for the PSAR calculation. This value sets the starting point for the acceleration of the indicator.
Increment: Defines the rate at which the PSAR increases. This value increases the acceleration parameter with each new high or low.
Maximum Value: Sets the upper limit for the acceleration parameter. This prevents the indicator from moving too quickly in high-volatility conditions.
3. Visualization:
Color of the Dots: The PSAR dots are displayed in teal if the indicator is below the closing price, indicating a bullish trend. They are shown in maroon if the indicator is above the closing price, indicating a bearish trend.
How to Use It: The Parabolic SAR is useful for identifying potential reversal points in the market. When the indicator switches position relative to the price, it can signal a potential trend change. Use this indicator in conjunction with other analysis tools to make more informed trading decisions.
User Explanation EMAs
This part of the indicator utilizes Exponential Moving Averages (EMAs) to help you identify trends and potential entry or exit points in the market. Here’s how they work and how you can customize them:
What are EMAs?
Exponential Moving Averages (EMAs) are indicators that smooth out historical prices to identify the direction of the trend. Unlike Simple Moving Averages, EMAs give more weight to recent prices, making them more responsive to current price changes.
How Each EMA Works:
1° EMA (Adjustable Length):
Purpose: The first EMA provides a short-term view and can help identify recent movements and potential quick trend changes.
Customization: You can adjust the length of this EMA (number of periods) using the "1° EMA length" option.
2° EMA (Adjustable Length):
Purpose: The second EMA acts as a smoother filter, helping to confirm or discredit signals from the first EMA.
Customization: Adjust its length with "2° EMA length".
3° EMA (Adjustable Length):
Purpose: The third EMA provides a longer-term view, helping to identify mid-term trends and significant turning points.
Customization: Modify its length via "3° EMA length".
4° EMA (Adjustable Length):
Purpose: The fourth EMA represents the long-term trend, offering a perspective on the market’s overall direction.
Customization: Change its length using "4° EMA length".
Customizable Colors:
You can choose the colors for each EMA through the provided color options. This allows you to distinguish each EMA on your chart easily and customize its appearance according to your preferences.
EMA Crosses:
Small Crosses (1° and 2° EMAs):
Functionality: When the 1° EMA crosses above the 2° EMA, it may signal a buy (bullish cross). When it crosses below, it may signal a sell (bearish cross).
Visualization: You can enable or disable the display of these small crosses.
Large Crosses (3° and 4° EMAs):
Functionality: Crosses between the 3° and 4° EMAs help identify more significant trend changes. A bullish cross may indicate an uptrend, while a bearish cross may signal a downtrend.
Visualization: You can also enable or disable these large crosses on your chart.
How to Use This Information:
Trend Identification: EMAs help you see whether the market is in an uptrend or downtrend, and crosses between them can indicate potential trading opportunities.
Entry/Exit Signals: Crosses between EMAs can signal optimal times to enter or exit a position.
This set of EMAs provides you with a clear view of different time frames in the market, allowing you to make more informed trading decisions based on the current trend and price changes.
Support and Resistance
Support and Resistance levels are essential tools in technical analysis, helping traders identify key price levels where the market might reverse or pause. This feature of the indicator provides visual markers for these levels and tracks how the price interacts with them.
Parameters:
Lookback Range: Defines the number of bars to look back when identifying pivot points. A larger value considers more historical data.
Bars Since Breakout: Determines how many bars should have passed since a breakout to detect a potential retest.
Retest Detection Limiter: Limits the number of bars actively checked for confirming a retest after a breakout.
Breakouts and Retests: Options to enable or disable detection for breakouts and retests.
Repainting: Controls how the indicator updates based on different criteria such as candle confirmation or high/low values. This affects how often and in what way the indicator adjusts its markings.
Pivot Points:
Pivot Low and High: The indicator identifies key support (pivot lows) and resistance (pivot highs) points based on the historical price action within the defined lookback range.
Boxes and Labels:
Drawing Boxes: Visual boxes are drawn to represent support and resistance levels. These boxes adjust dynamically with price changes and can extend based on user settings.
Breakout Labels: Labels are created when a breakout occurs, marking the point where the price crosses these support or resistance levels.
Retest Labels: When a potential retest is detected, the indicator can label it to signal areas where the price might test the broken support or resistance.
Customization Options:
Box and Label Styling: Users can customize the style, color, and size of the boxes and labels representing support and resistance.
Text Color Override: Option to change the color of text labels independently from the default color settings.
Key Benefits:
Visual Clarity: Easily identify important levels on the chart.
Dynamic Updates: Levels adjust as new price data comes in, providing relevant and up-to-date information.
Customization: Tailor the appearance and behavior of the support and resistance markings to fit your trading style.
This feature enhances your chart analysis by clearly marking critical levels and events, making it easier to spot potential trading opportunities.
Explanation of the Simple Moving Averages (SMA) Functionality
Simple Moving Averages (SMAs) are technical analysis tools used to smooth out price data and identify market trends. This part of the code allows you to add two SMAs to the chart with customizable settings.
Configuration Parameters:
Show SMA 1 and SMA 2: Enables or disables the display of each moving average. You can choose to show SMA 1, SMA 2, or both on your chart.
SMA Length: Defines the number of periods used to calculate each SMA. For example, a length of 14 for SMA 1 and 50 for SMA 2. A longer length smooths the line more, while a shorter length follows price movements more closely.
SMA Source: Sets which price data (e.g., closing price) is used to calculate the SMA.
Color and Width of SMA: Allows you to customize the color and width of each SMA line to fit your visual preference or to clearly distinguish between different SMAs on the chart.
SMA Style: Provides options to change the line style of the SMA to solid, dashed, or dotted, so you can personalize the appearance according to your analysis style.
SMA Calculation:
Calculation: The SMA is calculated by averaging the closing prices (or selected source) over the specified number of periods. This helps to smooth out daily price fluctuations and reveals the overall trend.
Visualization:
Plot for SMA 1 and SMA 2: Draws the SMA lines on the chart according to the specified settings. If you choose to hide an SMA, it will not appear on the chart.
Line Style: The line is drawn according to the selected style (solid, dashed, or dotted), and you can adjust the thickness and color to suit your visual needs.
Key Benefits:
Trend Clarity: SMAs help smooth out price movement and allow you to see the general trend in the market.
Customization: You can adjust the length, color, thickness, and style of the lines to fit your analysis and visual preferences.
Facilitates Analysis: SMAs can be used to identify crossings and important trading signals, such as when a short-term SMA crosses above or below a longer-term SMA.
This functionality provides you with powerful tools to adjust and customize how moving averages are presented on your charts, making it easier to identify trends and signals in the market.
Thank you for exploring the features of our indicator! We hope you find the customization options and tools provided, including the Simple Moving Averages, valuable for your trading analysis. If you have any questions or need further assistance, please feel free to reach out.
We invite you to try out the complete PatternPulse indicator to experience its full range of functionalities and see how it can enhance your trading strategies. Your feedback is always appreciated!
Happy trading!

Simplified Market ProfileVolume Bins: This script divides the price range into num_bins equal price levels. Each bin holds the cumulative volume for that price range.
Profile Length: The number of past bars that the profile considers for building the volume histogram.
Bin Size: The price range between bins is determined by dividing the difference between the highest and lowest prices over the specified range.
Volume Calculation: The script iterates over each bar within the specified range, determining which price bin the bar’s volume should be added to.
Plotting: The script visualizes the volume profile as lines plotted horizontally at different price levels, with thickness proportional to the volume traded at that level.

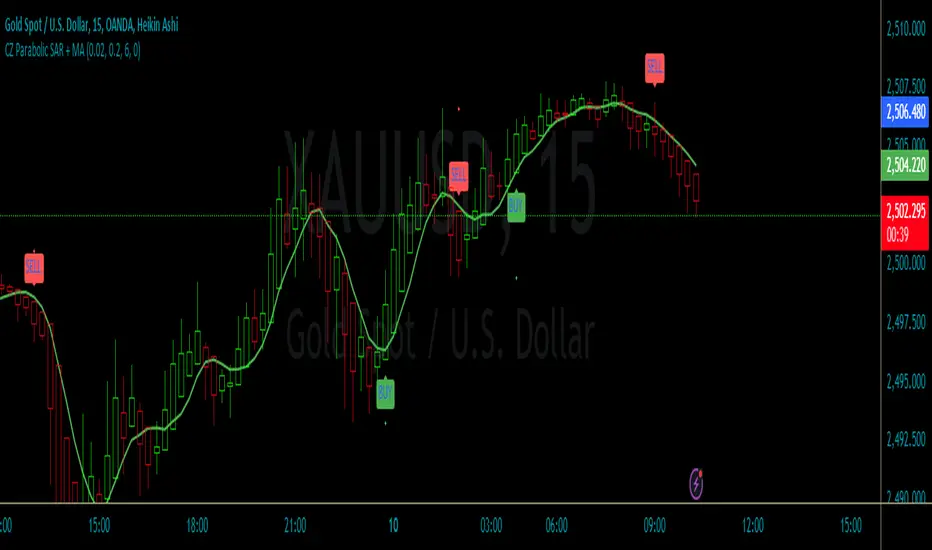
CZ Parabolic SAR + MAThe "CZ Parabolic SAR + MA" indicator combines a Parabolic SAR (PSAR) and a Moving Average (MA) to generate buy and sell signals, with an optional noise filter based on the MA. Here's a breakdown of how to use the indicator and its key parameters:
Key Features:
Parabolic SAR helps identify potential reversals by plotting dots above or below the price.
Moving Average smooths out price action and can be shifted forward or backward.
Noise Filter can be toggled on/off to reduce signals when the price doesn't align with the moving average.
How to Use the Indicator:
Parabolic SAR:
Green dots: Indicate a potential buy signal when the PSAR crosses below the price.
Red dots: Indicate a potential sell signal when the PSAR crosses above the price.
Buy/Sell Signals:
BUY: Occurs when the PSAR crosses below the price, and the price is above the moving average (if the filter is enabled).
SELL: Occurs when the PSAR crosses above the price, and the price is below the moving average (if the filter is enabled).
Noise Filter:
If enabled, the indicator will only trigger buy/sell signals if the price is also aligned with the moving average (above for buy, below for sell).
Moving Average:
A simple moving average (SMA) is plotted as a green line on the chart.
The moving average can be shifted forward or backward using the "MA Shift" parameter.
Parameters Explained:
Parabolic SAR Step (Default: 0.02): Controls the sensitivity of the PSAR dots. A smaller step results in dots closer to price, while a larger step results in dots further away.
Parabolic SAR Max (Default: 0.2): The maximum step size the PSAR can reach. This affects how quickly the dots move in strong trends.
Moving Average Period (Default: 6): The number of periods used to calculate the simple moving average. Adjust this to smooth out price action more or less.
MA Shift (Default: 0): Shifts the moving average line. Positive values shift it forward, and negative values shift it backward.
Enable Moving Average Filter (Default: True): Enables or disables the noise filter. If enabled, buy/sell signals require alignment with the moving average.
Trend/with EMA382Introduction to the "Trend/with EMA382" Indicator
The "Trend/with EMA382" indicator is a powerful technical analysis tool that combines trend signals with Exponential Moving Averages (EMA), offering traders a comprehensive view of market dynamics and helping identify potential trading opportunities.
1. Trend Analysis with Trend
The first part of this indicator uses a trend calculation algorithm based on the recent market highs and lows. These levels are used to determine the primary trend:
Bullish (Uptrend): When the market is in an uptrend, the chart will display buy signals in green.
Bearish (Downtrend): When the market is trending down, sell signals are shown in red.
The crossover points between price and trend levels will indicate buy or sell signals on the chart, enabling traders to easily spot entry and exit points.
2. Combination with EMA382
EMA (Exponential Moving Average) is a crucial tool in technical analysis, helping smooth price data and eliminate insignificant short-term fluctuations. This indicator uses three key EMAs:
EMA 34: Reflects short-term trends.
EMA 89: Helps identify medium-term trends.
EMA 200: Determines long-term trends.
These three EMAs assist traders in identifying the overall direction of the market, allowing them to forecast potential trend developments.
3. Application in Trading
The "Trend/with EMA382" indicator is designed to suit various time frames, from short-term to long-term trading. The combination of trend signals and EMAs helps:
Identify the primary market trend.
Provide accurate entry and exit signals.
Deliver clear signals for risk management and profit optimization.
Conclusion
"Trend/with EMA382" is an effective indicator that offers clear signals for both trend and market momentum. By combining EMAs with trend analysis, this indicator empowers traders to make more informed and precise trading decisions.
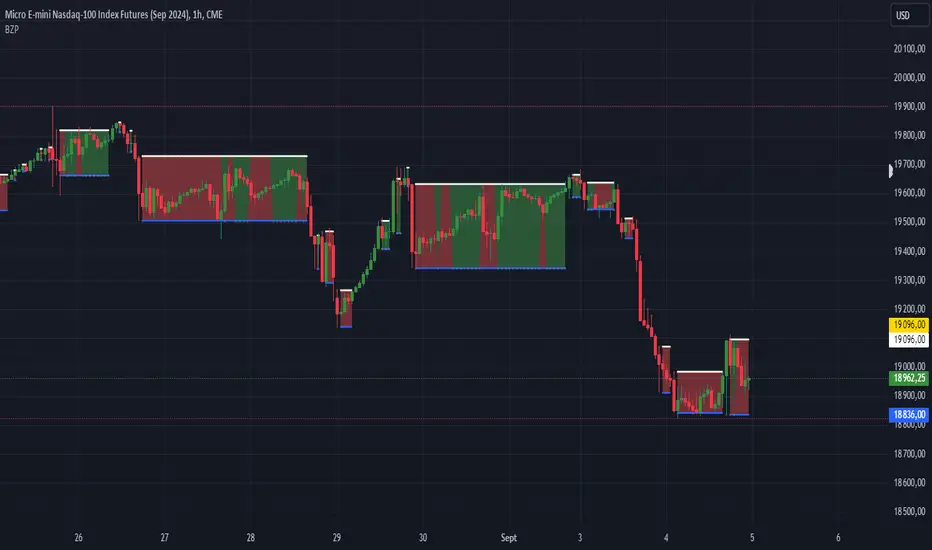
Bunker Zone ProtectionBunker Zone Protection (BZP) Indicator Description:
The Bunker Zone Protection (BZP) is a dynamic protection zone indicator designed for traders who want to identify key areas of support and resistance based on price action and the exponential moving average (EMA). This indicator highlights zones where prices are likely to reverse, find support, or meet resistance, depending on the relationship between the current price and the EMA.
Key Features:
Dynamic Protection Zones:
The BZP identifies protection zones based on market trend dynamics. It calculates upper and lower bands of protection using market highs and lows, adjusting these levels according to the prevailing trend.
Exponential Moving Average (EMA):
A customizable EMA is used to filter the market's current trend. If the price is above the EMA, it highlights support zones (demand), while if the price is below the EMA, resistance zones (supply) are displayed.
Visual Zone Highlighting:
The protection zones are visually represented on the chart, with customizable colors for upper (resistance) and lower (support) zones, making it easy to quickly assess market behavior.
Customization Options:
Configurable EMA length to fit different trading styles (short-term, medium-term).
A toggle option to easily enable or disable zone highlighting.
Adjustable colors and styles to match your preferred chart aesthetics.
How to Use:
Trade Reversals: Use the BZP to identify areas where price may potentially reverse. When the price approaches the upper or lower bounds of the protection zone, it could signal an imminent reversal.
Filter Out False Signals: The Bunker Zone Protection uses an EMA to filter the trend, helping to eliminate false signals and focus on significant market zones.
Parameters:
Range Input: Determines the price source for calculations (default: close price).
EMA Length: Defines the length of the EMA used to filter trends (default: 30).
Zone Toggle: Allows you to enable or disable the visual display of protection zones.
The BZP is a powerful tool for any trader looking to enhance decision-making based on strategic price zones, making it easier to read market trends and identify potential reversal points
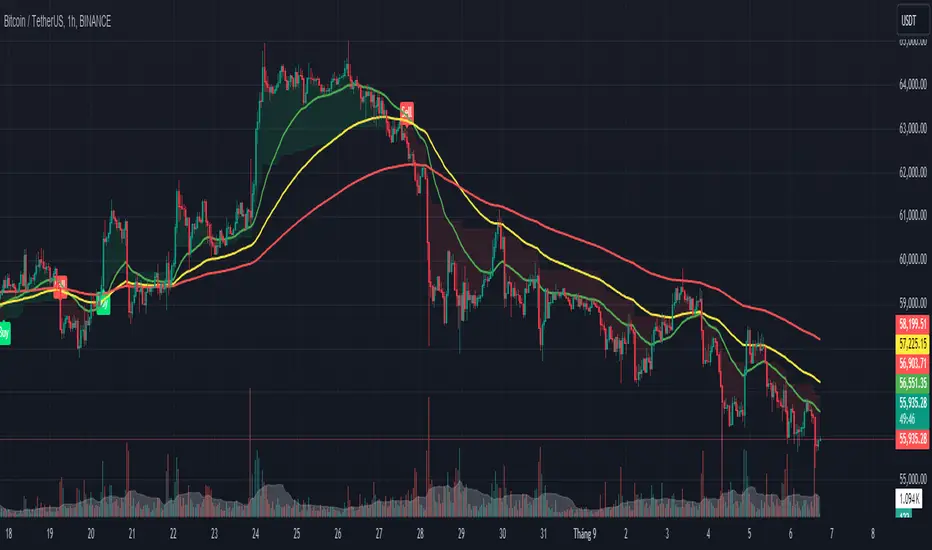
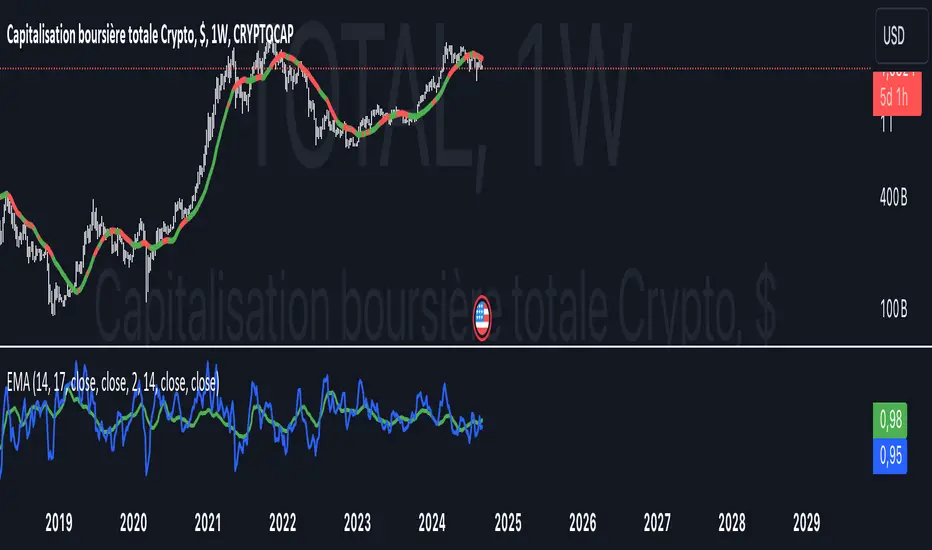
COMBINED EMA & SMA + DOUBLE DEMA, $TOTAL 1W / 5D -- Ruslan CRYPTOCAP:TOTAL
This Pine Script indicator, **"EMAS"**, provides an enhanced visualization of multiple types of moving averages, including both **Exponential Moving Averages (EMA)**, **Simple Moving Averages (SMA)**, and **Double Exponential Moving Averages (DEMA)**. It allows the user to observe the relationship between these different types of moving averages and apply regime-based coloring to price bars based on the comparison between the EMAs and DEMAs.
#### Key Features:
1. **EMA & SMA:**
- **EMA (Exponential Moving Average):** Calculated using a customizable lookback period (default 17), the EMA places greater weight on more recent prices, making it react faster to price changes.
- **SMA (Simple Moving Average):** Uses an equal-weighted average over a customizable lookback period (default 14), providing a slower-moving average compared to the EMA.
2. **DEMA (Double Exponential Moving Average):**
- Two separate DEMA lines are plotted using different lookback periods (default 2 and 14). The DEMA is a smoother and faster-responding version of the EMA, intended to reduce lag while retaining trend-following characteristics.
3. **Combined Signals:**
- The script calculates ratios between EMA/SMA (`comb`) and DEMA1/DEMA2 (`combd`) to generate a **regime-based bar coloring system**:
- If `combd > comb`: The bars are colored **green**, indicating that DEMAs are outperforming the EMAs, potentially signaling a stronger trend or momentum.
- If `comb > combd`: The bars are colored **red**, suggesting that the EMAs are dominant, which may indicate a different phase of the market.
4. **Signal SMA:**
- A 21-period **SMA** is plotted as a general trend-following signal. It provides a broader perspective on the current price trend, helping to smooth out short-term fluctuations.
5. **Customizable Options:**
- **"Show MAs?"**: The user has the option to toggle the display of the EMA, SMA, and DEMA lines on or off.
- **Custom Period Inputs**: Each type of moving average can have its period length customized via the input settings for better adaptability to different market conditions.
#### How to Use the Indicator:
- **Trend Following**:
The **EMA, SMA, and DEMA** values can help you determine the direction of the trend. When the EMA is above the SMA, it could indicate a stronger, more recent upward momentum. Similarly, DEMA comparisons provide smoother and faster trend signals.
- **Bar Coloring Regime**:
The **bar color** gives a quick visual cue of the regime:
- **Green bars** suggest that DEMAs are indicating stronger bullish or bearish signals compared to the EMAs.
- **Red bars** imply the opposite, where EMAs may be showing stronger signals, but possibly with more noise or lag.
- **Signal SMA**:
The **21-period SMA** line can be used as a simple trend indicator. When the price is above this line, it could signify an uptrend, while price movement below the line might indicate a downtrend.
#### Custom Inputs:
- **EMA Length**: Default is 17, but can be adjusted to fit your trading style.
- **SMA Length**: Default is 14.
- **DEMA Lengths**: Two customizable inputs for DEMA (default 2 and 14).
- **Source Selection**: You can choose which price source (close, open, high, low, etc.) to use for each calculation (default is the closing price).
#### Conclusion:
This indicator is useful for traders who wish to blend **trend-following strategies** (using EMA, SMA, and DEMA) with **visual regime indicators** (bar coloring). It is highly customizable, allowing traders to adjust settings based on their market approach. The combination of EMAs and DEMAs provides a nuanced view of price dynamics, potentially leading to better-informed trading decisions.
Horizontal Lines 0.5, BY ROSHAN SINGHThis indicator identify support and resistance to trade in 1min time frame, based of fib 0.5 level, on 15 min time frame find major high and low means major swing, low will be our start level and high will be our end level input in setting, substract high and end level and now divide answer with 2 till the daily volatility of a index or stock, if saying about nifty suppose nifty daily travel minimum for 65 pts then interval will be 65 input in settings, now all horizontals lines means support and level will be plotted on chart, buy on support, sell on resistance

US30 Market Breadth EMA20 [INVESTIC]Market Breadth Indicator is a tool designed to give you a snapshot of the overall strength of the Dow Jones Industrial Average (DJIA). It shows how many of the 30 Dow Jones stocks are trading above their 20-day Exponential Moving Average (EMA) and displays this data in a histogram, with values ranging from 0 (no stocks above the 20-day EMA) to 30 (all stocks above the 20-day EMA). It’s a quick and easy way to see how many stocks are trending positively within the Dow.
Why US30 breadth Indicator?
Market breadth helps investors assess whether the market is broadly strong or weak. When more stocks are trading above their 20-day EMA, it suggests a healthy, bullish environment. Conversely, fewer stocks above this threshold could indicate a weakening market or a potential downturn.
The US30 Market Breadth indicator is essential as it shows overall market sentiment, helping users identify emerging trends, confirm the direction of the market, and make more timely trading decisions.
Usage
Trend Following: Market Breadth can be use to find short-term lows or peaks. As the histogram rises above the green zone in the session it may indicate increasing buying pressure, suggesting opportunities for quick long positions from the low.
Reversals: Market Breadth can be use to spot potential rebound in the near term, for example, a rising number of stocks while the index declines could signal a quick short-term trades.
Features
Green: 0-6 stocks above the 20-day EMA
Yellow: 7-24 stocks above the 20-day EMA
Red: 25-30 stocks above the 20-day EMA

Market Internals: VolumeThe indicator plots the total volume of the NYSE and NASDAQ exchanges and identifies periods with significant asymmetry between Up Volume and Down Volume. It can be used as an additional tool to confirm broad market sentiment.
Chart shows Total Volume (TVOL) bars for SPY daily chart. Green bars for UVOL>>DVOL, Red for DVOL>>UVOL. Neutral bars are gray. Blue line shows median TVOL.
Rationale:
Up Volume (UVOL) and Down Volume (DVOL) represent the total volume of stocks that have increased or decreased in price, respectively, compared to the previous session's closing price. The magnitude of the price change is irrelevant.
When UVOL is significantly higher than DVOL, it indicates a prevailing buying sentiment in the broad market. Conversely, when DVOL is higher, it signals prevailing selling sentiment.
Occasionally, the UVOL/DVOL (VOLD) ratio may be misaligned with the movement of the S&P index. The picture below illustrates an example of a day when the S&P declined, yet the UVOL was twice larger than DVOL. Such a divergence can suggest that the S&P was pulled down by a decline in a few large-cap stocks, while the broader market remained positive. In this case, the divergence led to a continuation of the rally.
Thus, VOLD, when combined with volume analysis, can be an effective tool for confirming market trends.
Parameters:
VOLD Ratio – minimum ratio of UVOL/DVOL or DVOL/UVOL. Indicator will color code volume columns when condition is true (“green” means buying; “red” selling).
Median Length – number of periods to calculate median TVOL.
Show Divergencies – indicator marks divergencies between price and volume sentiments on the main chart. Only works for SPY chart.
Users can also choose which exchanges (NASDAQ/NYSE) to use for volume calculation.
Notes:
Volume is shown in millions of contracts
Indicator should be used on the daily or higher timeframes. It won't work properly on the intraday charts
Disclaimer
This indicator should not be used as a standalone tool to make trading decisions but only in conjunction with other technical analysis methods.

Market Risk IndicatorIntroducing the easy to use Market Risk Indicator (MRI) which works well on all major Equity Indices and Large-Cap stocks.
It uses a proprietary backtested logic, and a vast improvement over the commonly used VIX indicator which is prone to manipulation via Options at illiquid strikes.
MRI works on all timeframes. My favorite timeframe is Daily.
Usage:
Look for deviation between risk (blue plot) and price action. Expected behavior is they move in opposite direction. If a certain instrument is not following this rule, stop.
If risk increases but price stays rangebound or also spikes; it indicates a fake move. Exit LONG and prepare SHORT once price action confirms the reversal.
If risk decreases but price stays rangebound or dips; it also indicates a fake move. Exit SHORT and prepare LONG once price action confirms the reversal.
If magnitude of risk decrease is larger than magnitude of price move up, then enter LONG once price action confirms the upside breakout.
If magnitude of risk increase is higher than magnitude of price move down, then enter SHORT once price action confirms the downside breakout.
Some further examples published:
NSE:NIFTY :
NSE:BANKNIFTY :
OANDA:SPX500USD :
BLACKBULL:US30 :
OANDA:DE30EUR :
OANDA:JP225USD :
NSE:TATASTEEL :
NYSE:JPM :

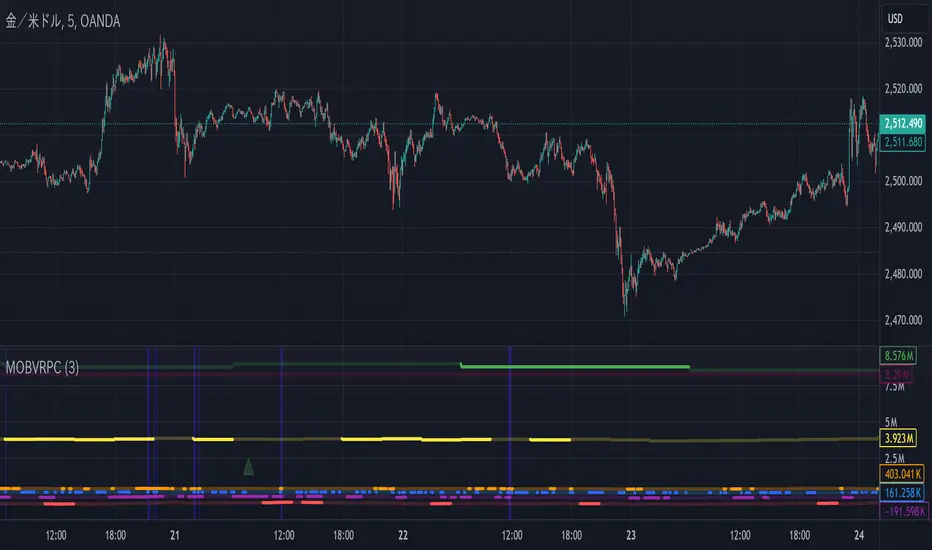
MTOBVR_CheckOverview.
This indicator checks to see if the OBV follows a specific pattern and visually displays the trend of the OBV on different time legs. It also has the ability to set alerts when certain conditions are met.
How to use
Setting up the indicator
Add a new indicator on a chart in TradingView.
Copy the code into the “Pine Script™ Editor” and save it as a new script.
Apply the script to your chart.
Indicator Functions
OBV Calculation
Calculates OBV for each time frame (5-minute, 15-minute, 30-minute, 1-hour, 4-hour, daily, and weekly) and displays it on the chart OBV is an indicator that combines price changes and trading volume.
Pattern Detection
Detects whether a particular pattern, such as a double or triple bottom, appears in the OBV. This allows us to identify buy or sell signals.
When these patterns are detected, the background color changes.
Background Color Change
When an OBV forms a particular pattern, the background color of the chart changes. This provides visual confirmation that a pattern has appeared.
Minimum pattern (min_bool): when the 5-, 15-, and 30-minute conditions for OBV are met.
High hourly pattern (h_bool): when the condition is met for the 1-hour, 4-hour, and daily legs of the OBV.
One-week pattern (range_obv_1w_bool): when the condition is met for the 1-week OBV pattern.
When all conditions are met: when the minimum pattern, high hourly pattern, and one-week pattern are all met.
Alert Settings
You can set alerts when certain conditions are met. This allows you to receive signals in real time.
Minimum conditions (min_bool): conditions at 5, 15, and 30 minutes of OBV.
High timeframe condition (h_bool): condition on the 1-hour, 4-hour, and daily legs of the OBV.
When all conditions are met: When all of the above conditions are met.
One-week condition (range_obv_1w_bool): Condition for the one-week leg of the OBV.
When all conditions are met: when the minimum, high time leg, and one week conditions are all met.
Arrows
OBV_ALL_UP: A green triangle arrow is displayed when the OBV is rising on all time legs.
OBV_ALL_DOWN: A red triangle arrow appears when the OBV is falling on all time legs.
Usage Notes
Time Leg Settings: This script uses OBVs of different time legs to detect patterns. Depending on the time leg used, appropriate settings and interpretation are required.
Alert settings: In order to activate the alert function, the alert conditions and notification method must be configured using TradingView's alert system.
This indicator allows you to visually see trends and patterns in the OBV across multiple time frames, allowing you to make more informed trading decisions.
RSI with Bollinger Bands Scalp Startegy (1min)
------------------------------------------------------------------------------
The "RSI with Bollinger Bands Scalp Strategy (1min)" is a highly effective tool designed for traders who engage in short-term scalping on the 1-minute chart. This indicator combines the strengths of the RSI (Relative Strength Index) and Bollinger Bands to generate precise buy signals, helping traders make quick and informed decisions in fast-moving markets.
How It Works:
RSI (Relative Strength Index):
The RSI is a widely-used momentum oscillator that measures the speed and change of price movements. It operates on a scale of 0 to 100 and helps identify overbought and oversold conditions in the market.
This strategy allows customization of the RSI's lower and upper bands (default settings: 30 for the lower band and 70 for the upper band) and the RSI length (default: 14).
Bollinger Bands:
Bollinger Bands consist of a central moving average (the basis) and two bands that represent standard deviations above and below the basis. These bands expand and contract based on market volatility.
In this strategy, the Bollinger Bands are used to identify potential buy and sell signals based on the price's relationship to the upper and lower bands.
Signal Generation:
Buy Signal: A buy signal is triggered when two conditions are met:
The RSI value falls below the specified lower band, indicating an oversold condition.
The price crosses below the lower Bollinger Band.
The buy signal is then issued on the first positive candle (where the closing price is greater than or equal to the opening price) after these conditions are met.
Sell Signal: In this version of the strategy, the sell signal is currently disabled to focus solely on generating and optimizing the buy signals for scalping.
Strategy Highlights:
This indicator is particularly effective for traders who focus on 1-minute charts and want to capitalize on rapid price movements.
The combination of RSI and Bollinger Bands ensures that buy signals are only generated during significant oversold conditions, helping to filter out false signals.
Customization:
Users can adjust the RSI length, Bollinger Bands length, and the standard deviation multiplier to better fit their specific trading style and the asset they are trading.
The moving average type for Bollinger Bands can be selected from various options, including SMA, EMA, SMMA, WMA, and VWMA, allowing further customization based on individual preferences.
Usage:
Use this indicator on a 1-minute chart to identify potential buy opportunities during short-term price dips.
Since the sell signals are disabled, this strategy is best used in conjunction with other indicators or strategies to manage exit points effectively.
This "RSI with Bollinger Bands Scalp Strategy (1min)" indicator is a valuable tool for traders looking to enhance their short-term trading performance by focusing on high-probability entry points in volatile market conditions.

Market Tick Trend by SyntaxGeekHello traders, today I'm pleased to provide another potential tool in reading one of the most powerful intraday indicators for scalpers et al, TICK .
This indicator, "Market Tick Trend", provides a simplified version of reading the movements of TICK compared to my other indicator Market Internal Trend aka "MIT" . It also makes use of cumulative measurements vs raw values (see more below).
TICK
If this is your first time hearing of TICK, simply know that it's a measurement of a massive collection of stocks in the market - a "breadth measurement". When speculating on index/etf or even stock movement it can be beneficial to know what the entire market is doing in price movement.
TICK, (and variants), are a measurement of the number of stocks that moved up a "tick" vs the number of stocks that moved down a tick. The result is a simple numerical value. For example, if there are 1000 stocks and 800 moved up a tick or more - that's typically a bullish indicator.
Market breadth measurements are broken up into various "markets", such as "NYSE" and "NASDAQ". Most of my indicators for market internals focus primarily on NYSE and occasionally NASDAQ, this indicator provides data for both via a selection in settings.
Usage
Select proper market based on trading product, my recommendation is to use NYSE for SPY and it's top holdings, and NASDAQ when trading QQQ and it's top holdings, tech companies, etc.
Check out bar coloring for a spin on the boring two color candle scheme and "see" the TICK bias directly on the chart.
Modes
If scalp trading where timing is paramount, I recommend keeping to mode one for the entry and exit bias guidance, use one or more additional modes to provide a broader bias to filter out potential lower probability signals. For longer intra-day trades perhaps watch mode three through five to filter out noise and fake outs.
Design
There are a couple schools of thought when using TICK, some are interested in the cumulative value and some are more interested in "at the moment" values and movement (where I spend much of my time).
MTT aims to facilitate a useful data display for all audiences and trade styles, it also simplifies TICKs usage and strips away much of the noise and brain power required to analyze minutiae when decisions may need to take place.
Cumulative measurements are taken and then trending routines are enacted to present the data displayed, the lower the mode the more sensitive to recent data.
Uniqueness
I believe this indicator to be a unique offering to TradingView, while there are a handful of TICK related indicators (some are mine) - none of them implement the features I've provided in MTT.
Warnings
This indicator is designed for intraday use only and meant to be a guide in market breadth bias - not a signal generator for trades, what you do with this you do at your own risk and you'll most likely lose all your money :)
With the above being said, I've only tested this indicator on a handful of lower timeframes, nothing higher than 30 minute and can't guarantee anything beyond that will be useful.
For those trading non-US markets, or trading futures products during extended hours, I'm sorry to inform that market breadth data (such as TICK) is simply not available to the markets at that time and this indicator will provide zero usage.
To the best of my knowledge there is no repainting here, but you may see warnings if setting alerts due to the nature of using certain PineScript features. Also the data providers of course could change historical data and that's simply out of my control.
Happy trading!

Cumulative Delta [TradingFinder] Volume + Periodic + EMA🔵 Introduction
To fully grasp the concept of Cumulative Volume Delta (CVD), it's essential first to understand Volume Delta. In trading and technical analysis, the term "Delta" typically refers to the difference between two values or the rate of change between two data points.
Volume Delta represents the difference between buying and selling pressure, calculated for each candlestick on a chart. This difference can vary across different timeframes.
A positive delta indicates that buying volume exceeds selling volume, while a negative delta shows that selling volume is greater. When buying and selling volumes are equal, the volume delta equals zero.
🟣 What is Cumulative Volume Delta (CVD)?
Cumulative Volume Delta (CVD) is a powerful tool in technical analysis that aggregates delta values for each candlestick, creating a comprehensive indicator that helps traders assess market trends.
Unlike the standard Volume Delta, which compares delta on a candle-by-candle basis, CVD provides insight into the overall buying and selling pressure during key market swings. A downward-trending CVD suggests that selling pressure is dominating, which is typically a bearish signal.
Conversely, an upward-trending CVD indicates bullish sentiment. This analysis becomes even more significant when comparing CVD with price action and market structure, helping traders to predict asset price directions.
By evaluating market highs and lows, one can determine the market trend. A consistent rise in these points indicates an uptrend, while a consistent fall suggests a downtrend.
🔵 How to Use
Understanding how to detect trend changes using Cumulative Volume Delta is crucial for traders. Typically, CVD aligns with market structure, moving in the same direction as price trends.
However, divergences between CVD and price trends or signs of exhaustion in volume can be powerful indicators of potential market reversals. Recognizing these patterns can help traders make informed decisions and improve their trading strategies.
🟣 Identifying Trend Exhaustion with Cumulative Volume Delta (CVD)
The Cumulative Volume Delta (CVD) indicator is especially effective in identifying weakening trends in the market. For instance, if gold's price hits a new low, but CVD does not follow suit, this may indicate a lack of seller interest despite the new low, signaling potential seller exhaustion.
Most traders interpret this as a possible reversal from a bearish to a bullish trend. Similarly, if gold reaches a new high but CVD fails to do the same, it can suggest that buyers lack the strength to push the market higher, indicating a possible trend reversal.
🟣 Utilizing Cumulative Volume Delta (CVD) Divergence in Price Trend Analysis
Another effective use of CVD is identifying divergences in price trends. For example, if CVD breaks a previous high or low while the price remains stable, this divergence often indicates that buying or selling pressure is being absorbed.
For instance, if CVD rises sharply without a corresponding increase in gold prices, it may suggest that sellers are absorbing the buying pressure, potentially leading to a strong sell-off. Conversely, if gold prices remain stable while CVD declines, it could indicate that buyers are absorbing selling pressure, likely leading to a price increase once selling subsides.
🔵 Setting
Cumulative Mode : It has three modes "Total", "Periodic" and "EMA". In "Total" mode, it collects the volume from the beginning to the end. In "Periodic" mode, it accumulates the volume periodically and in "EMA" mode, it calculates the moving average of the volume.
Period : You can set the period of " Periodic " and " EMA " modes.
Market Ultra Data : If you turn on this feature, 26 large brokers will be included in the calculation of the trading volume.
The advantage of this capability is to have more reliable volume data. You should be careful to specify the market you are in, FOREX brokers and Crypto brokers are different.
🔵 Conclusion
Cumulative Volume Delta (CVD) is a powerful analytical tool in financial markets that helps analysts and traders assess buying and selling pressure by aggregating and combining the volume delta for each candlestick.
CVD can indicate the strength or weakness of a market trend. When CVD moves upward, it signals that buying pressure is dominant and is considered a bullish signal; conversely, a downward movement in CVD indicates that selling pressure is stronger and is viewed as a bearish signal.
This indicator is particularly effective in identifying divergences and exhaustion in market trends. For example, if CVD does not align with price movements, it may suggest a potential trend reversal.
Traders use this information to make more informed trading decisions, especially when identifying entry and exit points in the market.
Overall, CVD is a tool that enables analysts to better understand market fluctuations and more accurately predict future market trends.

Volume-Weighted RSI with HMA SmoothingThis script combines a Volume-Weighted RSI, smoothed with a custom Hull Moving Average (HMA), with a modified MACD based on normalized net volume.
Volume-Weighted RSI: It is calculated by adjusting the closing price with a normalized On-Balance Volume (OBV) and then applying an RSI. This approach weights the RSI according to volume, providing a more accurate measure of the strength of the price movement.
Modified HMA: A Hull Moving Average (HMA) is used to smooth the Volume-Weighted RSI, enhancing the ability to identify market trend changes.
Possible Reversal from Oversold:
The Volume-Weighted RSI crosses above the oversold level.
It is displayed as an upward green triangle at the bottom of the chart, indicating that the market might be exhausting its oversold conditions and potentially starting an upward reversal.
Possible Reversal from Overbought:
The Volume-Weighted RSI crosses below the overbought level.
It is displayed as a downward red triangle at the top of the chart, indicating that the market might be exhausting its overbought conditions and potentially starting a downward reversal.
Confirmation with the Modified MACD: For a more robust interpretation, the behavior of the modified MACD can be observed alongside the RSI cross.
The MACD is also modified, using normalized net volume (calculated as the cumulative change in the closing price multiplied by volume) as the input instead of the standard closing price.
The direction and color change of the MACD bars indicate the market's momentum.
Alerts: Alerts are set to trigger automatically when the modified RSI crosses the oversold or overbought levels.
Español:
Este script combina un RSI ponderado por volumen, suavizado con un Hull Moving Average (HMA) personalizado, con un MACD modificado basado en volumen neto normalizado.
RSI Ponderado por Volumen: Se calcula ajustando el precio de cierre con un OBV (On-Balance Volume) normalizado y luego aplicando un RSI. Este enfoque pondera el RSI según el volumen, proporcionando una medida más precisa de la fuerza del movimiento del precio.
HMA Modificado: Se utiliza un Hull Moving Average (HMA) para suavizar el RSI Ponderado por Volumen, mejorando la capacidad de identificar cambios en la tendencia del mercado.
Posible Reversión desde Sobreventa:
El RSI Ponderado por Volumen cruza por encima del nivel de sobreventa.
Se muestra como un triángulo verde hacia arriba en la parte inferior del gráfico, indicando que el mercado podría estar agotando las condiciones de sobreventa y comenzar una posible reversión al alza.
Posible Reversión desde Sobrecompra:
El RSI Ponderado por Volumen cruza por debajo del nivel de sobrecompra.
Se muestra como un triángulo rojo hacia abajo en la parte superior del gráfico, indicando que el mercado podría estar agotando las condiciones de sobrecompra y comenzar una posible reversión a la baja.
Confirmación con el MACD Modificado: Para una interpretación más robusta, se puede observar el comportamiento del MACD modificado junto con el cruce del RSI.
El MACD también está modificado, utilizando el volumen neto normalizado (calculado como el cambio acumulativo en el precio de cierre multiplicado por el volumen) como entrada en lugar del precio de cierre estándar.
La dirección y el cambio de color de las barras del MACD indican el impulso del mercado.
Alertas: Las alertas están configuradas para activarse automáticamente cuando el RSI modificado cruza los niveles de sobreventa o sobrecompra.

The GOD's EYE V1Here's a description for your script that aligns with the guidelines provided:
---
**Title:** The GOD's EYE V1
**Description:**
"The GOD's EYE V1" is a powerful technical analysis tool designed for Forex traders who seek to identify high-probability trading opportunities based on price action and trend-following strategies.
**Key Features:**
1. **Dynamic Channel with Upper and Lower Bands:**
- The script uses a custom EMA-based channel to identify significant price levels. The upper and lower bands are dynamically calculated by adjusting the central EMA line with a fixed pip distance, providing a clear visual of potential support and resistance zones.
2. **Engulfing Candle Detection:**
- The script identifies bullish and bearish engulfing patterns, which are key reversal signals. These patterns are used in conjunction with the EMA channel to confirm potential trade entries.
- **Bullish Engulfing:** Triggered when a bearish candle is followed by a bullish candle that engulfs the previous candle's body, combined with the EMA cross above the upper band.
- **Bearish Engulfing:** Triggered when a bullish candle is followed by a bearish candle that engulfs the previous candle's body, combined with the EMA cross below the lower band.
3. **Customizable Parameters:**
- Traders can adjust the EMA length and the distance of the upper and lower lines from the central EMA to tailor the indicator to their specific trading strategy.
4. **Visual and Alert System:**
- The script provides clear visual signals on the chart, marking potential buy and sell opportunities with triangles above or below the candles. Alerts are also integrated to notify traders in real-time when a bullish or bearish engulfing pattern is detected.
**How It Works:**
- The indicator plots two key levels on the chart (Upper and Lower) based on the central EMA. These levels act as dynamic support and resistance.
- When the fast EMA crosses above the upper band and a bullish engulfing pattern is detected, a potential buying opportunity is signaled.
- Conversely, when the fast EMA crosses below the lower band and a bearish engulfing pattern is detected, a potential selling opportunity is signaled.
**Usage:**
- This indicator is designed for traders who prefer a trend-following approach combined with price action analysis. It is especially useful for those who trade on higher timeframes like the 4H or 1H charts.
- The alerts and visual signals help traders to stay on top of potential trades without constantly monitoring the charts.
---
This description provides a clear overview of the indicator, explaining its features, how it works, and how traders can use it effectively. This should meet the publication guidelines for closed-source scripts.
