Chiaroscuro Scalp Model A [Signal + Visuals]This indicator is based on the Chiaroscuro Scalp Model A — a precision-based scalping system that identifies high-probability trade setups during the London and New York sessions. It combines daily range expansion, order blocks, fair value gaps, and W/M reversal patterns to generate 20-pip scalping opportunities with clearly plotted stop loss and take profit levels. Ideal for intraday traders seeking structured, rule-based entries.
Breadth Indicators

Intraday vs Overnight OBV🔍 Purpose
This indicator provides a volume-weighted cumulative flow model that mimics On-Balance Volume (OBV) logic but splits the volume impact into intraday vs. overnight sessions. It allows traders to track how volume contributes to price movement in each session and identify whether buying/selling pressure is stronger during or outside of regular trading hours.
This indicator attempts to alleviate some of the downfalls of the standard OBV indicator, which only looks at total volume and total direction. The price of stocks generally behaves extremely differently during market hours and outside market hours, and many of the large moves happen outside of regular market hours on low volume.
⚙️ Core Features
1) OBV-style calculation:
If price increases → volume is added to the OBV stream.
If price decreases → volume is subtracted.
If price is flat → OBV remains unchanged.
2) Session splitting:
Intraday session: movement from today's open to close.
Overnight session: movement from yesterday’s close to today’s open.
Volume is split proportionally between these two periods based on user input.
3) Four visualization modes:
"Intraday" — plots only OBV from intraday price movement.
"Overnight" — plots only OBV from overnight price movement.
"Aggregate" — plots the sum of intraday and overnight OBV for a holistic view.
"Both Intraday and Overnight" — plots intraday and overnight OBV separately on the same chart.
📐 Inputs
1) Synthetic OBV Type:
"Intraday" — Show OBV from open to close only.
"Overnight" — Show OBV from prior close to today's open only.
"Aggregate" — Show a single line combining both.
"Both Intraday and Overnight" — Show both lines on the same chart.
2) Estimated Overnight Volume %:
Percentage of total daily volume assumed to occur during extended hours.
The rest is allocated to regular session (intraday).
Default: 20% overnight, 80% intraday.
🧮 How It Works
Volume Splitting:
Total bar volume is split into overnight Volume and intraday Volume:
Intraday change is the difference between today’s close and open.
Overnight change is the difference between today’s open and yesterday’s close.
Session OBV Calculations:
OBV is incremented/decremented by the session's allocated volume, depending on whether the session’s price change was positive or negative.
Aggregate OBV:
Combines both session deltas for a holistic volume flow view.
📊 Interpretation
Rising OBV (any stream) suggests accumulation; falling OBV suggests distribution.
Divergences between price and OBV lines (especially overnight vs. intraday) can reveal where hidden buying/selling is occurring.
Comparing intraday vs overnight OBV can help:
Spot whether institutional demand is building off-hours.
Detect retail vs. institutional behavior (retail trades often dominate intraday; institutional may prefer after-hours).
💡 Use Cases
Identify whether overnight gaps are supported by overnight volume momentum.
Detect accumulation in low-volume overnight sessions.
Compare intraday and overnight strength during earnings season or news events.
Complement traditional OBV by seeing session-based breakdowns.


Turtle Trading System + ATRTurtle Trading System + ATR
This Pine Script v5 indicator implements a Turtle Trading System with ATR integration.
It plots a 20-day high (red), 20-day low (blue), and an ATR-based level (orange) shifted upward by a user-defined percentage (default 5%).
Customizable inputs include lookback period (default 20), ATR period (default 14), and ATR offset.
Dynamic labels show the 20-day high, low, and ATR values at the current bar, updating with price.
Suitable for trend-following strategies, it highlights breakout and volatility levels.

EMA 5 20 DCema 5 to ema 20 Death Cross by APkhant. Ema 5 to Ema 20 Deathcross and price is under deathcross , should sell for aggressive trader mode and should wait , pull back and sell for conservative trader mode. this is for me, my first script.

Crypto Breadth | AlphaNatt\ Crypto Breadth | AlphaNatt\
A dynamic, visually modern market breadth indicator designed to track the strength of the top 40 cryptocurrencies by measuring how many are trading above their respective 50-day moving averages. Built with precision, branding consistency, and UI enhancements for fast interpretation.
\ 📊 What This Script Does\
* Aggregates the performance of \ 40 major cryptocurrencies\ on Binance
* Calculates a \ breadth score (0.00–1.00)\ based on how many tokens are above their moving averages
* Smooths the breadth with optional averaging
* Displays the result as a \ dynamic, color-coded line\ with aesthetic glow and gradient fill
* Provides automatic \ background zones\ for extreme bullish/bearish conditions
* Includes \ alerts\ for key threshold crossovers
* Highlights current values in an \ information panel\
\ 🧠 How It Works\
* Pulls real-time `close` prices for 40 coins (e.g., XRP, BNB, SOL, DOGE, PEPE, RENDER, etc.)
* Compares each coin's price to its 50-day SMA (adjustable)
* Assigns a binary score:
• 1 if the coin is above its MA
• 0 if it’s below
* Aggregates all results and divides by 40 to produce a normalized \ breadth percentage\
\ 🎨 Visual Design Features\
* Smooth blue-to-pink \ color gradient\ matching the AlphaNatt brand
* Soft \ glow effects\ on the main line for enhanced legibility
* Beautiful \ multi-stop fill gradient\ with 16 transition zones
* Optional \ background shading\ when extreme sentiment is detected:
• Bullish zone if breadth > 80%
• Bearish zone if breadth < 20%
\ ⚙️ User Inputs\
* \ Moving Average Length\ – Number of periods to calculate each coin’s SMA
* \ Smoothing Length\ – Smooths the final breadth value
* \ Show Background Zones\ – Toggle extreme sentiment overlays
* \ Show Gradient Fill\ – Toggle the modern multicolor area fill
\ 🛠️ Utility Table (Top Right)\
* Displays live breadth percentage
* Shows how many coins (e.g., 27/40) are currently above their MA
\ 🔔 Alerts Included\
* \ Breadth crosses above 50%\ → Bullish signal
* \ Breadth crosses below 50%\ → Bearish signal
* \ Breadth > 80%\ → Strong bullish trend
* \ Breadth < 20%\ → Strong bearish trend
\ 📈 Best Used For\
* Gauging overall market strength or weakness
* Timing trend transitions in the crypto market
* Confirming trend-based strategies with broad market support
* Visual dashboard in macro dashboards or strategy overlays
\ ✅ Designed For\
* Swing traders
* Quantitative investors
* Market structure analysts
* Anyone seeking a macro view of crypto performance
Note: Not financial advise

Unified Signals + BB Expansion Filtercan be universal use for different futures product but yet to fine tune for individual use

Delta Volume Movement TrackerOverview
This Pine Script, titled "Delta Volume Movement Tracker," is a sophisticated volume analysis tool designed to run in a separate pane below the main price chart. Its primary purpose is to dissect market activity by analyzing volume data from a lower timeframe to provide a clearer picture of the real buying and selling pressure behind price movements.
The core concept is to look at the volume delta (up-tick volume minus down-tick volume) from a faster timeframe (e.g., 1-minute) and correlate it with the price action on the current chart. This allows the indicator to distinguish between different market scenarios, such as strong, confirmed buying versus selling pressure that occurs even as the price rises.
Key Components
1. Lower Timeframe Volume Delta
The script's engine is the ta.requestUpAndDownVolume() function. It pulls detailed volume data from a user-specified lower timeframe. This provides a high-resolution view of the order flow. From this, it calculates the delta, which is the net difference between buying and selling volume.
Positive Delta: More volume occurred on up-ticks than down-ticks, suggesting buying pressure.
Negative Delta: More volume occurred on down-ticks than up-ticks, suggesting selling pressure.
2. Categorizing Price and Volume Interaction
The script intelligently categorizes market action by looking at both the direction of the price change and the sign of the volume delta. This creates four distinct conditions:
Strong Buying (upPositiveDelta): Price is moving up, AND the volume delta is positive. This is a confirmation signal, indicating that the upward price move is supported by aggressive buying.
Selling into Strength (upNegativeDelta): Price is moving up, BUT the volume delta is negative. This is a divergence, suggesting that despite the price rise, larger players may be distributing or selling into the rally.
Buying into Weakness (downPositiveDelta): Price is moving down, BUT the volume delta is positive. This is also a divergence, suggesting that buyers are stepping in to absorb the selling pressure, potentially indicating a bottom.
Strong Selling (downNegativeDelta): Price is moving down, AND the volume delta is negative. This is a confirmation signal, indicating that the downward price move is supported by aggressive selling.
3. Price-Weighted Summation
Instead of just counting the occurrences, the script calculates a rolling sum for each category over a lookbackPeriod. Crucially, it weights these values by the close price, effectively measuring the monetary value of the flow in each category. This gives more significance to volume that occurs at higher price levels.
How It Appears on the Chart
The indicator plots the two most powerful confirmation signals as columns to make them easy to interpret:
Green Columns (upBuySum): Represents the cumulative, price-weighted value of "Strong Buying." Taller green bars indicate significant and sustained buying pressure.
Red Columns (downSellSum): Represents the cumulative, price-weighted value of "Strong Selling." Taller red bars indicate significant and sustained selling pressure.
EMA Lines: Smooth exponential moving averages of both the buying and selling plots are overlaid to help identify the prevailing trend in order flow.
Filled Zones: The areas beneath the zero line and the plotted columns are filled with color, making it easy to visually gauge the magnitude of buying or selling pressure at a glance.
In summary, this indicator provides a nuanced view of market dynamics, helping traders see beyond simple price action to understand the strength and conviction of the buyers and sellers driving the trend.

Market Breadth TableDisplay overall market condition, can select different trading market NYSE or NASDAQ, if declining stock number is more than advancing same day is not good for heavy traded long position
You can adjust the table position in the chart as well

Quantum Scalper Pro – Adaptive EMA/VWAP Hybrid Engine🧠 Quantum Scalper Pro – Adaptive EMA/VWAP Hybrid Engine
Experimental version under development
This strategy combines a hybrid technical analysis system based on:
Multiple EMAs and smoothed VWAP
Higher timeframe trend confirmation
Dynamic ATR-based breakout entries
Engulfing patterns and RSI divergences
Adaptive risk management and smart re-entry logic
📈 The algorithm includes filters for consolidation zones, abnormal volume, outlier candles, and dynamically adjusts key parameters based on the selected timeframe.
🛡️ The risk management system is fully adaptive, scaling take-profit and stop-loss levels based on current volatility (ATR), with exit logic triggered by EMA/MVWAP crossovers or RSI overbought/oversold conditions.
⚠️ IMPORTANT:
This is an experimental strategy. Past performance does not guarantee future results. Please use it strictly for backtesting or demo accounts while evaluating its behavior across different assets and market conditions.

Universal Trade Levels & Signal Classifierscript has been enhanced and generalized for all instruments — not just ES or SPX.
You now get the following classifications:
💎 Perfect Trade – trend confirmed, strong signal, ATR + VWAP + volume aligned
🚀 Sure Shot Trade – very high volume + ATR breakout + directional bias
⚡ Quick Call/Put – fast actionable setups
❌ No Trade – avoid/no confirmation
The logic works across any timeframe and any ticker.
You can now test this live on any instrument in TradingView. Let me know if you’d like to add things like:
Multi-timeframe confirmation
Re-entry logic
Heatmap table of confidence levels
Signal filtering based on RSI, OBV, etc.

[Oscar] OBV with MA & SMA filterBy invitation only.
This script is based on daily on balance volume.
Both MA & SMA can be set as filters for noise.
The bullish trend is indicated with green color; the bearish trend is in red color.
The best buying point should be
1. The SMA has a positive slope;
2. The green line (bullish trend) appears.

OBV with MA & SMA filterBy invitation only.
This script is based on daily on balance volume.
Both MA & SMA can be set as filters for noise.
The bullish trend is indicated with green color; the bearish trend is in red color.
The best buying point should be
1. The SMA has a positive slope;
2. The green line (bullish trend) appears.

AUTO SBSThis is my auto SBS , with alerts!
its so simple and i created it for me and my friends so nothing to sya here

EMA Slope FilterEMA SLOPE FILTER....50EMA....You’ll see a line oscillating around zero; when it’s within ±0.1, treat the market as “flat.”

BullishSpotAI Smart Signals - EnhancedBullishSpotAI Smart Signals - Enhanced is a sophisticated and versatile trading indicator designed to provide precise buy and sell signals for traders across various markets and timeframes. Built with Pine Script v5, this indicator combines multiple technical analysis tools, including Exponential Moving Averages (EMAs), MACD, RSI, volume analysis, and optional Bollinger Bands, to generate high-probability trading signals. It offers advanced features such as automated risk management, customizable take-profit and stop-loss levels, trailing stops, and position sizing based on user-defined risk parameters. With its adaptive parameter adjustments and intuitive visualizations, BullishSpotAI is suitable for scalping, day trading, and swing trading strategies.Key Features Dynamic Signal Generation: Signals are generated based on EMA crossovers and touchbacks, filtered by MACD, RSI, volume, and optional Bollinger Bands to ensure high-quality trade setups.
Supports both long (buy) and short (sell) signals with clear visual cues (triangles on the chart).
Auto-Adjusting Parameters: Automatically adjusts key parameters (EMA periods, MACD settings, RSI, and more) based on the selected timeframe or trading style (Scalping, Day Trading, Swing Trading) for optimal performance.
Alternatively, users can manually configure parameters for full control.
Risk Management: Calculates stop-loss (SL) and three take-profit levels (TP1, TP2, TP3) using ATR-based calculations and support/resistance levels.
Displays risk-to-reward ratios for each TP level on the chart for informed decision-making.
Includes position sizing based on user-defined risk percentage and account balance, ensuring disciplined trading.
Trailing Stop Option: Optional trailing stop feature adjusts the stop-loss dynamically based on ATR, allowing users to lock in profits during trending markets.
Visualizations: Displays entry, stop-loss, and take-profit levels as customizable lines (solid, dashed, or dotted) with optional labels.
Features a dynamic trend cloud between fast and slow EMAs, with gradient coloring to indicate trend strength (strong/weak uptrend or downtrend).
Optional debug table provides real-time insights into parameter settings and timeframe adjustments.
Alerts: Configurable alerts for buy/sell signals, TP1/TP2/TP3 hits, and stop-loss triggers, enabling seamless integration with automated trading systems or manual monitoring.
Customizability: Extensive input options allow users to tailor the indicator to their trading style, including line colors, label positions, and whether to keep lines visible after trades close.
Supports Bollinger Bands as an additional confirmation filter for enhanced signal accuracy.
How to Use Setup: Add the indicator to your TradingView chart and configure inputs based on your trading preferences (e.g., trading style, risk percentage, account balance).
Enable/disable features like trailing stops, Bollinger Bands, or the debug table as needed.
Interpreting Signals: Buy Signal: A green triangle below the bar indicates a potential long entry. Entry, SL, and TP levels will appear on the chart.
Sell Signal: A red triangle above the bar signals a potential short entry.
The trend cloud provides context: green for bullish trends, red for bearish trends, with opacity reflecting trend strength.
Trade Management: Use the displayed SL and TP levels to set your trade parameters. The indicator calculates position size based on your risk settings.
Monitor alerts for real-time updates on trade entries, exits, or stop-loss triggers.
Customization: Adjust the trading style (Scalping, Day Trading, Swing Trading) or enable auto-adjust for timeframe-based optimization.
Customize line styles, colors, and label visibility to suit your chart preferences.
Who Should Use This Indicator? Scalpers: Benefit from fast, precise signals optimized for short timeframes (1-15 minutes).
Day Traders: Leverage adaptive parameters and risk management for intraday strategies.
Swing Traders: Use longer-term settings and trend confirmation for multi-day or multi-week trades.
Risk-Conscious Traders: Utilize built-in position sizing and risk-to-reward calculations for disciplined trading.
Important Notes This is an invite-only script, exclusively available to authorized users. Contact the author for access details.
Test the indicator on a demo account or in TradingView’s bar replay mode to familiarize yourself with its behavior before live trading.
Recommended timeframes: 1-minute to weekly, depending on your trading style. The indicator automatically adjusts parameters for optimal performance.
For best results, combine with your own market analysis and risk management practices.
Why Choose BullishSpotAI Smart Signals?
BullishSpotAI Smart Signals - Enhanced stands out for its adaptability, robust signal filtering, and comprehensive trade management features. Whether you’re a beginner seeking clear entry/exit signals or an experienced trader looking for a customizable tool, this indicator provides the flexibility and precision needed to enhance your trading strategy. The intuitive visuals and automated alerts make it easy to stay on top of market opportunities while maintaining strict risk control.Access Instructions
This is a private, invite-only script. To gain access, please contact the author directly. Once granted access, you can add the indicator to your TradingView charts and configure it to your preferences.Disclaimer
Trading involves significant risk. BullishSpotAI Smart Signals - Enhanced is a tool to assist with trade identification and management, but it does not guarantee profits. Always perform your own analysis and trade responsibly.

Smart Volatility Squeeze + Trend Filter
Smart Volatility Squeeze + Trend Filter
This advanced indicator detects low-volatility squeeze conditions and plots breakout signals, helping you spot strong price moves before they happen.
How it works
This script combines Bollinger Bands (BB) and the Keltner Channel (KC) — two popular volatility tools — to identify squeeze setups:
A squeeze occurs when the Bollinger Bands contract and move completely inside the Keltner Channel. This means the market is quiet and volatility is low — often right before a significant breakout.
When the squeeze condition is active, the background highlights the chart area with a soft color that gradually intensifies the longer the squeeze lasts. This gives a clear visual cue that pressure is building.
A breakout signal triggers when price crosses above the upper Bollinger Band (bullish) or below the lower Bollinger Band (bearish) — confirming that the squeeze has ended and a new impulse is likely starting.
To reduce false breakouts, you can enable the built-in trend filter. By default, it uses a simple EMA: breakouts are confirmed only if the price action aligns with the overall trend direction.
Key features
🔹 Bollinger Bands + Keltner Channel squeeze detection
🔹 Automatic squeeze marker and background shading
🔹 Breakout arrows for up and down signals
🔹 Optional trend filter with adjustable EMA length
🔹 Works on any market: crypto, stocks, forex, indices
🔹 Fully adjustable inputs for BB, KC and trend filter
🔹 Built-in ready-to-use alerts for breakouts
How to use
Watch for areas where the squeeze condition appears — the background will highlight them.
Wait for a breakout arrow to appear outside the bands.
Use the trend filter to focus only on breakouts in the dominant trend direction.
Combine with your existing risk management and confirmation tools.
Inputs
BB Length & StdDev: Control the Bollinger Bands settings.
KC EMA Length & ATR Multiplier: Control the Keltner Channel width.
Trend Filter Length: Adjust how smooth or sensitive the trend filter is.
Use Trend Filter: Enable or disable confirmation by trend direction.
Disclaimer
⚠️ This script is for educational purposes only and does not constitute financial advice. Always test any strategy thoroughly and trade at your own risk.

Win K.O V5This indicator R&D Follow requestment from Community for Enterprise Systems only
Jan 7
Release Notes
Fix Bug and Replace Color Bar
Feb 3
Release Notes
1 ทำการอัพเดท bug เก่า
2 แก้ไขปัญหารีเพนท์ TimeFrame
3 เพิ่มฟังก์ชัน
- End Area
- Reverse Band
- TREND
Jun 15
Release Notes
Update Dashboard

AD Line of S&P SectorsAdvance-Decline Line of S&P 500 Sectors
This indicator tracks the breadth strength of the S&P 500 by combining an unweighted Advance-Decline (A/D) Line and a market-cap weighted A/D Histogram across all 11 major S&P sectors.
Key Features
Sector A/D Histogram: Measures sector breadth based on whether each sector advanced or declined, then weights it by its current estimated market cap share.
Unweighted A/D Line: Smooth average of sectors equally weighted, giving an alternative breadth view that’s less biased by large sectors.
Top Weighted Stocks Tracker: Tracks the daily percentage change of the top 10 highest-weighted S&P 500 stocks, scaled by their index weights, and overlays them as a background area plot.
Zero Crossovers: Histogram and line crossing zero can help highlight broadening strength or weakness.
Customizable Sector Weights: Sector weights can be adjusted in the settings. It is recommended to review and update these periodically to reflect changes in S&P sector allocations.
Repaint Option: Uses a user-selectable repaint mode for flexible bar update logic.
How to Use
Trend Confirmation: When the weighted histogram and unweighted line are above zero together, it indicates broad sector strength; below zero suggests broad weakness.
Neutral Zone: Values between +0.5 and -0.5 (or your custom thresholds) may imply a ranging market or slower movement.
Top Names Context: The top-weighted stocks area shows how much the index’s largest components are pulling the market up or down, relative to the broader sector breadth.
⚠️ Disclaimer
This script is for educational and informational purposes only and does not constitute financial advice. Always do your own research and consult with a qualified financial professional before making trading decisions. Use at your own risk.

3% Price RangeThe simplest way to track a 3% range is to calculate it directly:
Upper Limit: Current Spot Price * 1.03
Lower Limit: Current Spot Price * 0.97

Sectoral Indices Performance Table✅ What this script is:
It generates a performance table overlay on your chart, showing the percentage returns of up to 19 user-defined custom sector indices, calculated over four different lookback periods:
1 day (1D),1 week (1W),1 month (1M),3 months (3M)
Each "sector index" is defined as a basket of stocks, combined to mimic a custom sector benchmark.
🔧 What it is useful for:
📊 Quick performance comparison across sectors:
Enables traders to monitor how various custom sectors (like EMS, Solar, Real Estate, Oil & Gas, etc.) have performed relative to one another and over different timeframes.
🎯 Thematic trading:
This script is ideal for traders focusing on sector rotation or thematic investing, providing a clear and immediate picture of sectoral strength and weakness.
🖥️ Convenient table visualization:
The information is neatly formatted in a table overlay, positioned and styled according to user preference, for easy reference during analysis.
Dynamic table:
The table automatically grows based on how many sectors are toggled as visible (Show checkboxes).
💡 Example usage:
A trader can set this up to track EMS, Solar, Oil & Gas, and Real Estate sectors’ performance in a single view to help guide sector allocation decisions, identify outperforming sectors, and adjust portfolio exposure accordingly.

CGG RSI Divergence ScannerThis is a customized Relative Strength Index (RSI) indicator that enhances standard divergence detection with creative and visually intuitive symbols.
✅ Automatically detects bullish and bearish divergences
✅ Replaces traditional labels with fun icons like crabs, batteries, and geckos
✅ Custom-colored RSI bands: blue for upper, lower, and mid levels
✅ Ideal for day trading, swing trading, and trend confirmation
✅ Works across markets: crypto, forex, stocks, and more
---
🎯 Key Features:
Spot early reversal signals through divergence
Receive unique visual cues to support fast decision-making
Designed to reduce analysis fatigue and increase chart readability
---
⚠️ Disclaimer:
This tool is for educational and analytical purposes only. Trading involves risk — always combine with proper risk management and do your own research before making decisions.

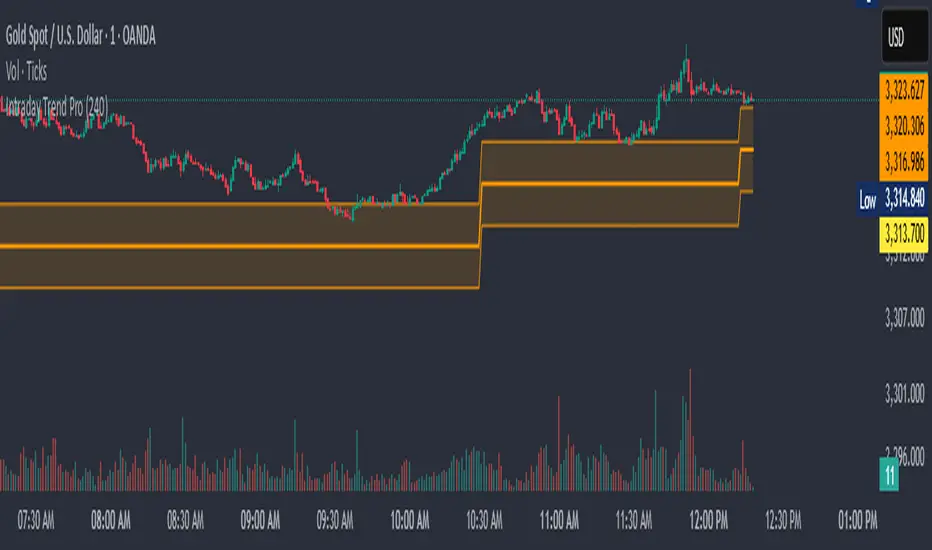
Intraday Trend Pro📈 Intraday Trend Pro — Multi-Timeframe Smart Indicator
Unlock precision in your intraday trading with Intraday Trend Pro, a powerful and versatile indicator built for serious traders. This tool is designed to:
✅ Identify the True Intraday Trend
Quickly and clearly spot bullish or bearish trends using a refined algorithm that filters out noise and false signals.
✅ Smart Entry & Stop Loss Suggestions
The script dynamically suggests optimal entry points and protective stop-loss levels, helping you manage risk and improve trade timing.
✅ Multi-Timeframe Analysis (MTF)
Enable the optional MTF mode to blend higher timeframes with the current chart for a more reliable signal confirmation, enhancing your confidence before entering a trade.
✅ Works Seamlessly Across Assets
Whether you’re trading indices like BankNifty, commodities like XAU/USD, or high-volume stocks, this indicator adjusts to deliver actionable insights.
✅ Customization Made Easy
Input controls allow you to fine-tune the trend settings, select timeframes, and adapt to your unique strategy—whether scalping or holding through the day.
Use Cases:
Confirming trend strength before entering trades
Determining accurate support/resistance for SL placement
Avoiding sideways markets and false breakouts
Aligning trades with higher timeframe momentum
Ideal For:
Intraday traders and scalpers looking for a clean, accurate, and multi-timeframe-aware tool to improve consistency.