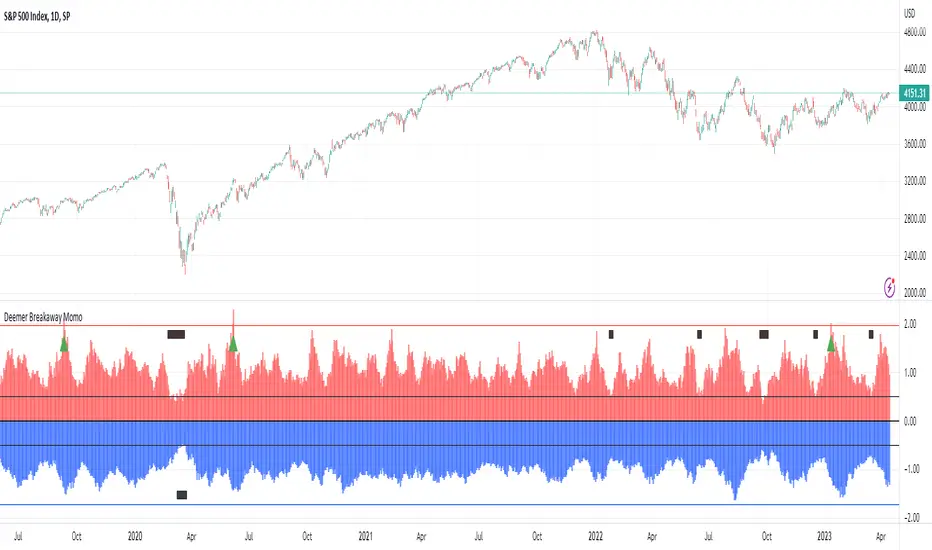
Walter Deemer Market Breadth Breakaway MomentumThis indicator is based on long time market analysts Walter Deemer's research. Below is a summary of what the indicator is used for. In short it can be used to spot market reversals.
In short, when the 10 day NYSE Advance:Decline ratio breaches 1.97, the market has achieved break away momentum. When the 20 day ratio achieves a 1.72 ratio this can be a "good" signal even if when the 10 day has not achieved a 1.97 ratio.
In addition to the NYSE, you can toggle NASDAQ, AMEX, or the average of the three.
You can read more about it here: walterdeemer.com
"Downside momentum usually peaks at the end of a decline, as prices cascade into a primary low. On the upside, though, momentum peaks at the beginning of an advance, then gradually dissipates as the advance goes on, and the more powerful the momentum at the move's beginning, the stronger the overall move; REALLY strong momentum is found only at the beginning of a REALLY strong move: a new bull market or a new intermediate leg up within a bull market. We coined the term "breakaway momentum" in the 1970's to describe this REALLY powerful upside momentum. The following is a review of what it is and how it is typically generated.
Breakaway momentum (some people call it a "breadth thrust") occurs when ten-day total advances on the NYSE are greater than 1.97 times ten-day total NYSE declines. It is a relatively uncommon phenomenon...24 times it has occurred since World War II (an average of once every 3 1/2 years). Cyclical bull markets, though, are traditionally heralded by breakaway momentum, so we are hopeful that it will be generated this time around, too.
....The real trick in generating breakaway momentum? It's not a lot of advances; it's a lack of declines."
Breadth Indicators
CAPTAIN ALTS VVMTCaptain Alts VVMT indicator provides signals and trend based on vlume , volatility , momentum and Trend
For volume it used on balance volume , Chaikin Moneey flow , vwap and candle pattern status
for Momentum it use ATR , S&R , RVI AND bOLLINGER BAND
Use 5min and 15min timeframe for scalping , The cap line change its colour according to the trend if it reds it means market is getting bearish if blue means market is turning bullish

Stochastic Slow and OBV Percent Oscillator
Purpose - Stochastic is the best momentum indicator and On Balance Volume (OBV) is the best volume indicator. Why not combine both to come up with a more sophisticated oscillator?
How It's Done - I had to put OBV as an oscillator (returning values between 0 and 100) in order to put it in the same pane with the slow stochastic oscillator. Otherwise, their synergy won't be that great. So, I have decided to visualize OBV as a percentage relative to selected period's high and low value. That way, I can keep the OBV value to stay within boundary.
Interpretation
1. Dot color indicates the whether the stochastic K/OBV is over or below the stochastic D/Signal line.
2. When Stoch and OBV are moving in the same direction and are close together (on top of each other), this indicates a strong trend
3. When Stoch crosses up or down the OBV oscillator, it may indicate a trend reversal

Indicator Daily-Weekly-Range-In-PriceSpecification: Indicator Daily-Weekly-Range-In-Price helps traders to easily identify the price movement of a range that goes from highs to lows in a specific timeframe. Range price can be chosen between daily or weekly. It can be integrated with strategies giving us more information abot price movement.
Name:Daily-Weekly-Range-In-Price
Category: Mean Reversion. Range Trading
Timeframe: From weekly below, depending on the specific technique.
Technical Analysis: The indicator uses price action from daily to weekly using highs/lows to detect the range movement.
Suggested usage: Every Market especially for Swing Trading Operativity.
Daily-Weekly-Range-In-Price Indicator can identify automatically the range between highs and lows from weekly to minor timeframes with labels on the charts and an histogram helping shown on the chart to easily identify the volatility range juat at one glance.
Highly Dinamic Inputs Settings: Timeframe can be changed from the input options, labes indicating the range in price will change automatically.

God Number Channel v2(GNC v2)GNC got a little update:
1) Logic changed a bit.
I tried to calculate MAs based on the power(high - low of previous bars).You can see it the M-variables, as new statements were added in calculation section of MAs. I don't really know if I did right, because I didn't go too much in Pine Script. I just wanted to make a Bollinger-bands-like bands, which could predict the levels at which might reverse, using legendary fibonacci and Tesla's harmonic number 432. It's might sound as a joke, but as you can see, it works pretty good.
2) Customization :
No need to change Fibonacci ratios in code. Now you can do it in the GNC settings. Also MAs' names were made obvious, just check it out. Time of million similar "MA n1" has passed :)
3) Trade-entry advices :
I didn't tell you exactly the trade-entry advices, as I haven't explored this script fully yet :) But you probably understood something intuitively, when added GNC on the chart. Now I made things way more obvious:
1. Zones between Fib ratios show you how aware you should be of price movements. Basically, here are the rules, but you probably understand them already:
1.1 Red zone(RZ) : high awareness, very likly for price to be reversed, but if there is a clear trend and you know, than it might be a time for price to shoot up/down.
1.2 Orange zone(OZ) : medium awareness, not so obvious, as price might go between boundaries of OZ and continue the trend movement if such followed before entering the OZ. If price go below lower boundary of OZ and the next bar opens below this boundary, it might be a signal for SHORY, BUT(!) please consider confirmation of any sort to be more sure. Think of going beyond the upper boundary by analogy.
1.3 Green Zone(GZ) : if the price hits any boundary of green zone, it is usually a good oppurtunity to open a position against the movement(hit lower boundary -> open LONG, hit upper boundary -> open SHORT).
1.4 Middle Zone(Harmonic Zone)(MZ) : same rules from Green Zone.
IMPORTANT RECCOMENDATION : Use trend indicator to trend all signals from zones to follow the trend, 'cause counter-trending with this thing without stop loss might very quickly wipe you out , might if you will counter-trend strategy with GNC, I will be glad if you share it with the community :)
Reccomendation for better entries :
1) if the price hits the lower(or high) boundaries(LB or HB) zone after zone(hit LB or HB of RZ, then of OZ, then of GZ), it is a very good signal to either LONG, if price was hitting LBs , or SHORT, if hitting HBs .
2) Consider NOT to place trades when in MZ, as price in this zone gets tricky often enough. By the way, if you dont the see the harmonic MAs(which go with plot(ma1+(0.432*avg1)) ), then set the transparency of zone to 20% or a bit more and then it will be ok.
I will continue to develop the GNC and any help or feedback from you, guys, will be very helpful for me, so you welcome for any of those, but please be precise in your critics.
Thank you for using my stuff, hope you found it usefull. Good luck :)

SMA - SSL Hybrid - HalfTrendSMA - Halftrend Signal - SSL Hybrid ichi signal indicator
This indicator is actually a combination of several indicators to get the right signal in the direction of the market and gain profit
At first, there are some simple moving averages called MA, which are used only to display the simple moving average in different time frames.
Then we have the combination of a Halftrend indicator which is set in such a way that if the three Halftrend lines are green, it will issue an ascending signal, and if all three lines are red, it will issue a descending signal.
In the following, we have Tenkasen from Ichi Moko with SSL Hybrid, if the candlesticks are above Tenkasen and SSL Hybrid issues an upward signal, it is a suggestion to enter into a buy transaction, and if the candles fall below Tekasen and SSL Hybrid A bearish sign above the candle means a sell offer
It is more optimal to place the candlestick display in Heiken Ashi mode

TICK/BreadthThis indicator will show you both the $TICK values for the day showing you the advance and decline of stocks in the NYSE throughout the day, as well as showing you the Breadth ratio for the NYSE and the NASDAQ.
There is a maximum and minimum line showing the maximum and minimum throughout the day.
There is also a marker placed on this max/min line for when the TICK candle closes above or below zero.

God Number Channel V1 (GNC V1)Channel, made of 5 MAs, which a made this way: High of N-period SMA - Low of N-period SMA + X-period SMA (check the code), where N and X are defined by your input.
Main purpose: helps you understand in what range price can move.
WARNING!
HAS TO BE USED WITH OTHER INDICATORS TO HAVE MORE ACCURATE ENTRIES!!!
If the price is above or below the channel, it means that the movement is very strong and you count it as a trend, but be careful then the price returns to the channel, as correction will follow very soon. Use fib correction tool to understand the approximate depth of correction, works pretty good.
Recommendation: consider using the Vortex Indicator( len 21 and 14 are fine; for trend) and "Vumanchu Divergencies + B"(for anything, but calibrate for accuracy, otherwise there will be too much false signals). If you want to see more options where the price might go, just add new MA and add/substract to/from its value avg1*(any of fibonacci correction levels, I personally use 1.618 and 2.618 and for me it is ok): plot(show_ma1 ? ma1+( [ [ ]]]*avg1) : na, color = ma1_color, title="MA №1")
Recommendations and feedback are welcome(!)
Take your wins

Volume Trend Meter LTFA new take to an already popular indicator of mine, now with lower time frame support for a volume called Volume Trend Meter LTF (VTML).
The VTM LTF indicator measures the volume pressure at a specific part of the candle (Start, Middle, or the end of the candle) and displays it as a histogram.
This indicator sums up all green candle volumes and red candle volumes over the selected part of the candle (Select in settings - start end or middle) and plots their values by subtracting increasing volume and decreasing volume.
Use this indicator to identify increasing volume with the green candles (close bigger than open) and increasing volume of the red candles (close is smaller than open).
Can also work on daily charts and higher.
======= Calculation ==========
For Green Column: The total Volume of green candles is higher than the total red candle volume.
For Red Column: The total Volume of red candles is higher than the total green candle volume.
======= Volume Trend Meter LTF Colors =======
Green: Increasing buying pressure.
Red: Increasing selling pressure.
My original VTM (not the lower time frame version):
Like if you like and Follow me for upcoming indicators/strategies: www.tradingview.com

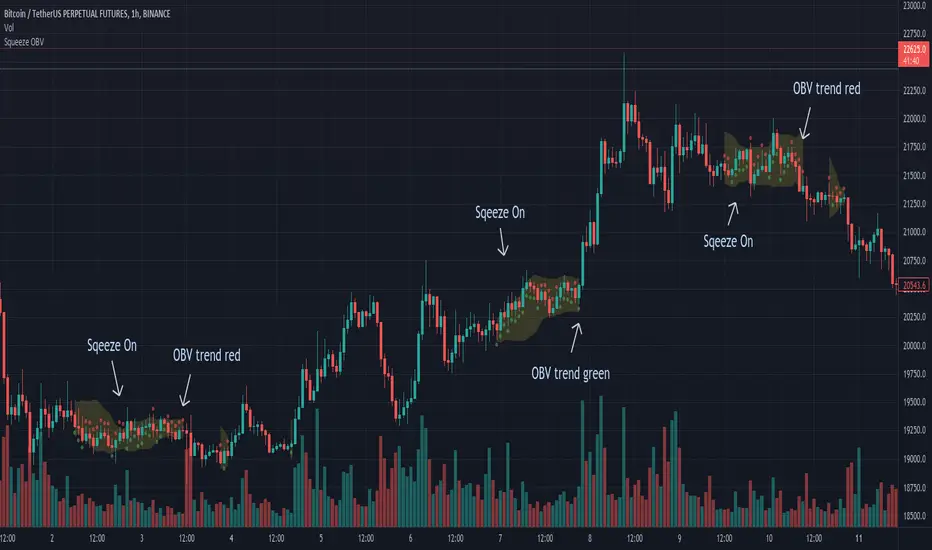
Squeeze OBVThe concept comes from "TTM Squeeze", this indicator visualizes the squeeze on the price movement.
Yellow band overlay on the candles shows that entered a squeeze on with low volatility, market preparing itself for an large move (up or down).
Dots of OBV change every bar, green means potential up, red is the opposite.
Prepare a breakout order with the direction of OBV.
If potential up, the strategy is a breakout order above the squeezed Bollinger Band and the stop loss is below the Bollinger Band.
It's a pity that it cannot write breakout order strategy in Tradingview.
My experience that use CVD instead of OBV will have better performance, but it needs the historical evolution of the order book.
----
概念來自於 "TTM Squeeze",將擠壓的過程視覺化在價格走勢上。
k線上的黃色帶覆蓋表明進入了低波動性的擠壓,市場為大幅波動(向上或向下)做準備。
OBV 的點每根bar都會變化,綠色表示可能向上,紅色則相反。
搭配 OBV 可以判斷走勢,使用突破單策略能夠有效獲利,
假設可能向上,突破單在擠壓布林帶上方,止損在布林帶下方。
可惜 Tradingview 無法寫突破單策略回測。
經驗上搭配 CVD 更有效,需要交易所訂單簿的歷史紀錄,故 Tradingview 也無法製作 CVD。
EMA MAGIC BANDThis is the 21 EMA Band Which follows the chart for the last 21 Average High and Low Prices of the Candle with Integrated RSI. This is a Colourful Band When Market is in Uptrend it shows Green, Market is Downtrend it shows Red and When Sideways Black.

OBV with Volume/Momentum DivergenceCredits go to vyperphi696 and LazyBear for the original OBV with Divergence script.
This indicator has the new option to check for momentum divergence, which I have done by adding RSI and MACD data.
Hence the indicator allows combined testing of volume and momentum divergence. This feature aims to improve trend reversal detection by reducing false positives.
In summary, 3 divergence categories are shown by default as lines:
Volume + RSI + MACD (dark green/red)
Volume + RSI / Volume + MACD (light green/red)
Volume (gray)
Line colors can be adjusted via plot settings. Therefore it is also possible to distinguish Volume + RSI and Volume + MACD divergence if necessary.
Lastly, I edited the indicator scaling mechanism when changing from one timeframe to another; the transitions are smoother now. This only applies when auto-scaling is off.

Intrabar On Balance VolumeAn experimental modification of TradingView's built-in OBV indicator that calculates its value with intrabar data.
This leads to a more accurate OBV trace because it considers the price swings that happen within the time period of each candle, instead of only considering the candle close price.
For example: on a 4H timeframe a single candle spans 4 hours. In this indicator the OBV is calculated with 1-minute intrabar data, leading to a resolution of 240 intrabars per 4H candle (that is, it considers the volume and price swings that happened at each minute of those 4 hours).

Rets High/Low (2.0 Special Uncensored Edition)This script can be used as a visual aid in seeing the last highs and lows of price in a specific time period. It automatically updates the plots if new highs or lows are made within the given lookback period.
This is a fairly basic version currently, with new added features coming in future updates such as range between high/low and half and whole number detection.

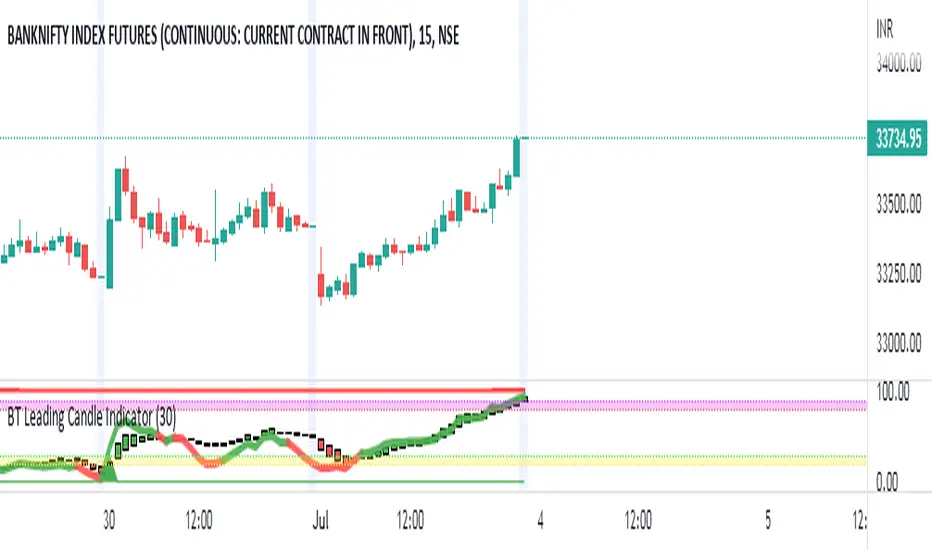
BT Leading Candle IndicatorThe oscillator display consists of 3 lines (K, D and J - hence the name of the display) and 2 levels. K and D are the same lines you see when using the stochastic oscillator. The J line in turn represents the deviation of the D value from the K value. The convergence of these lines indicates new trading opportunities. Just like the Stochastic Oscillator, oversold and overbought levels correspond to the times when the trend is likely to reverse.
Function
BT Leading KDJ Candle Indicator use candles to indicate KD relationship. E.g. yellow candles for bull (K>=D) and fuchsia candles for bear (K=D and fuchsia for K KDJ K value
d --> KDJ D value
buysig --> KD buy signal in green triangle
selsig --> KD sell signal in red triangle
leadingline --> colorful leading line for KDJ
Pros and Cons
Pros:
1. Candle height can indicates the strength of trend and different colors are used for indicating KD relationship
2. a leading line is added as aux method to confirm KDJ signal
Cons:
1. It may satruate for extreme conditions of long and short as described in the chart, which is inherent KDJ shortcoming.
2. Not accurate for long and short entries and need filtering out noise and fake signal.
Remarks
More direct to observe and confirm trend with the leading line.
Read me
In real life, I am a prolific inventor. I have successfully applied for more than 60 international and regional patents in the past 12 years. But in the past two years or so, I have tried to transfer my creativity to the development of trading strategies. Trading view is the ideal platform for me. I am selecting and contributing some of the hundreds of scripts to publish in Trading view community. Welcome everyone to interact with me to discuss these interesting pine scripts.
The scripts posted are categorized into 5 levels according to my efforts or man hours put into these works.
Level 1 : interesting script snippets or distinctive improvement from classic indicators or strategy. Level 1 scripts can usually appear in more complex indicators as a function module or element.
Level 2 : composite indicator/strategy. By selecting or combining several independent or dependent functions or sub indicators in proper way, the composite script exhibits a resonance phenomenon which can filter out noise or fake trading signal to enhance trading confidence level.
Level 3 : comprehensive indicator/strategy. They are simple trading systems based on my strategies. They are commonly containing several or all of entry signal, close signal, stop loss, take profit, re-entry, risk management, and position sizing techniques. Even some interesting fundamental and mass psychological aspects are incorporated.
Level 4 : script snippets or functions that do not disclose source code. Interesting element that can reveal market laws and work as raw material for indicators and strategies. If you find Level 1~2 scripts are helpful, Level 4 is a private version that took me far more efforts to develop.
Level 5 : indicator/strategy that do not disclose source code. private version of Level 3 script with my accumulated script processing skills or a large number of custom functions. I had a private function library built in past two years. Level 5 scripts use many
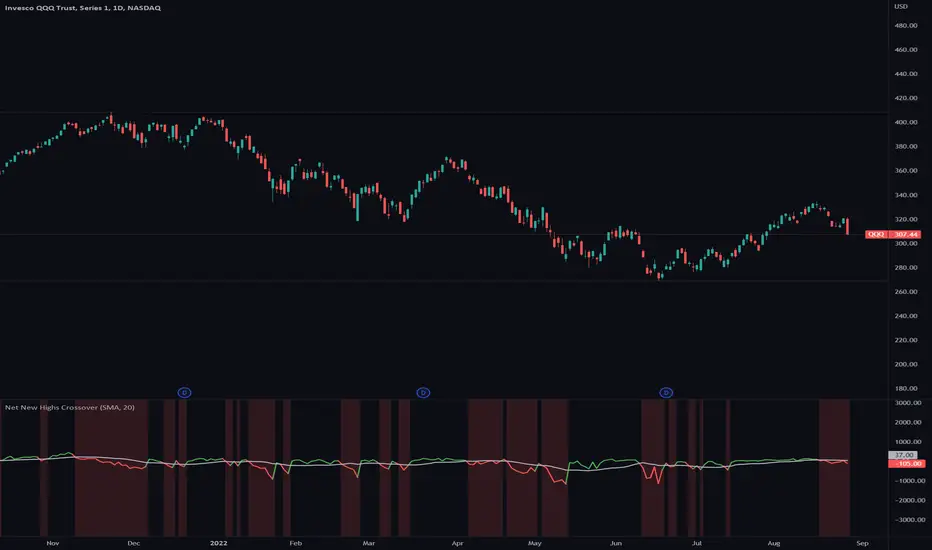
Net New Highs CrossoverA lot of traders have a hard time to get in and out of the market at the right time.
Net New Highs of stocks can guide you to increase or decrease your exposure based on the current market health.
They are calculated by subtracting the new highs of the new lows, based on all stocks of the NYSE, NASDAQ and AMEX.
+ A positive value shows that the market is doing good, since more stocks are making new highs compared to new lows.
- A negative value shows that the market is doing bad, since more stocks are making new lows compared to new highs.
Combined with a moving average you can see crossovers that can warn you early when there is a change in the current market health.
Features
■ You can select different Net New High indices or combine them (NYSE, NASDAQ and AMEX)
■ You can specify a moving average line ( SMA / EMA and length)
■ Use single color or two colors for the moving average line to better spot the crossovers
Hints
*New highs and new lows index values currently only get updated at the end of the day
*Only works on daily timeframe
Strategy Crypto -- double your capitalBTCUSD -- 5 min
BUY POSITION
1 : The price is above the hull suite indicator
2 : The hull suite indicator is green
3 : The volume oscillator indicator is above 0
4 : A new blue candle should appear on the QQE MOD indicator
SELL POSITION
1 : The price is bellow the hull suite indicator
2 : The hull suite indicator is red
3 : The volume oscillator indicator is above 0
4 : A new red candle should appear on the QQE MOD indicator

Chande Kroll Stop今天和大家分享Chande Kroll Stop 回测, 信号采用了上限线和下限线共通反向趋势而决定买卖信号,如果有新的构思能提高买卖信号欢迎在留言区发表你的建议,祝你交易开心!

Adaptive Price ZoneThe Adaptive Price Zone was developed by Lee Leibfarth in 2006, and it attempts to create a band for mean-reversal strategies. It works by taking the double-smoothed average of the volatility from 5 days and adding/subtracting it from the average price of the day (hl2).
If you are planning to use it, remember that it changes throughout the day , so you might want to use an offset. You can also choose to use the true range for the volatility instead of the high and low difference.

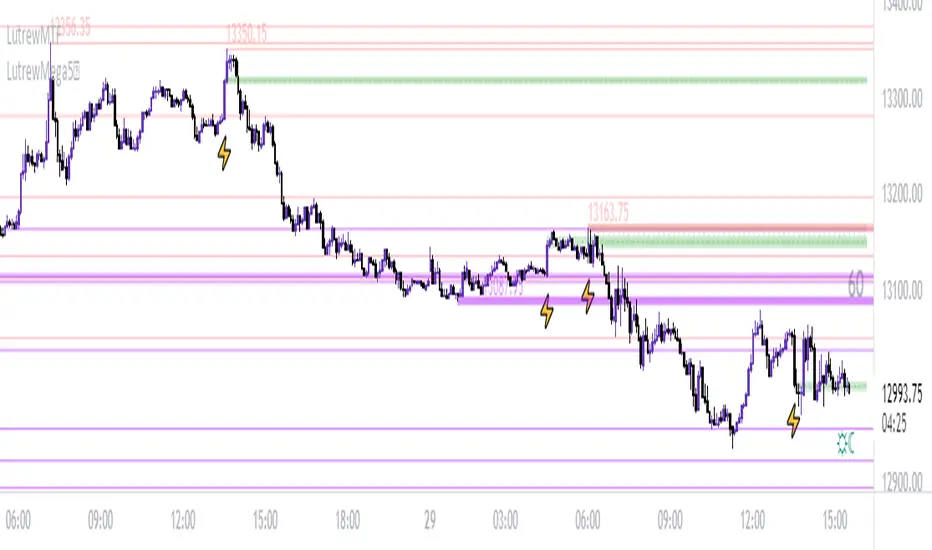
LutrewMTF// ————— Plots
var cMarkerUp = color.new(color.lime, 0)
var cMarkerDn = color.new(color.red, 0)
plotshape(A1U, "Marker 1 Up", shape.triangleup, location.belowbar, cMarkerUp, size = size.tiny, text = "1")
plotshape(A2D, "Marker 2 Dn", shape.triangledown, location.abovebar, cMarkerDn, size = size.tiny, text = "2")
plotshape(A3U, "Marker 3 Up", shape.triangleup, location.belowbar, cMarkerUp, size = size.tiny, text = " 3")
plotshape(A4D, "Marker 4 Dn", shape.triangledown, location.abovebar, cMarkerDn, size = size.tiny, text = "4 ")
plotshape(A5U, "Marker 5 Up", shape.triangleup, location.belowbar, cMarkerUp, size = size.tiny, text = " 5")
plotshape(A6D, "Marker 6 Dn", shape.triangledown, location.abovebar, cMarkerDn, size = size.tiny, text = "6 ")
plotshape(A7U, "Marker 7 Up", shape.triangleup, location.belowbar, cMarkerUp, size = size.tiny, text = " 7")
plotshape(A8D, "Marker 8 Dn", shape.triangledown, location.abovebar, cMarkerDn, size = size.tiny, text = "8 ")
// ————— Alert
alertcondition( A1U or A2D or A3U or A4D or A5U or A6D or A7U or A8D, "Pivots MTF: Configured Markers", "Pivots MTF Alert")
// }