Index Strength Strategy with Signal Using the Index Strength Strategy Indicator for Trading
Introduction:
In this article, we'll explore the Index Strength Strategy Indicator and how it can be used for trading. The Index Strength Strategy Indicator is a technical analysis tool designed to help traders identify trends, determine trend strength, and generate buy and sell signals.
Overview of the Index Strength Strategy Indicator:
The Index Strength Strategy Indicator is based on two moving averages - a fast moving average and a slow moving average - and the Relative Strength Index (RSI). The fast and slow moving averages are used to determine the trend direction, while the RSI is used to calculate the trend strength. The indicator assigns a strength score to the current trend, which is then classified into one of four categories - Very Weak, Weak, Strong, or Very Strong. Traders can use this information to identify the strength of the trend and adjust their trading strategy accordingly.
The indicator also generates buy and sell signals based on a user-defined threshold level. When the strength score crosses above the threshold level, a buy signal is generated, and when the strength score crosses below the threshold level, a sell signal is generated.
Using the Index Strength Strategy Indicator for Trading:
Traders can use the Index Strength Strategy Indicator to identify trends, determine trend strength, and generate buy and sell signals. To use the indicator, traders should first determine the appropriate fast and slow moving average periods and the strength threshold level for their trading style. These input parameters can be adjusted in the indicator's settings.
Once the indicator is added to the chart, traders can use the strength score and trend direction to identify potential trading opportunities. If the trend is classified as Strong or Very Strong, traders may look for opportunities to enter long or short positions in the direction of the trend. If the trend is classified as Very Weak or Weak, traders may look for opportunities to exit or avoid positions.
Traders can also use the buy and sell signals generated by the indicator to enter or exit positions. When a buy signal is generated, traders can enter a long position, and when a sell signal is generated, traders can enter a short position. Traders should set stop-loss and take-profit levels based on their risk management strategy.
Avoiding Mistakes:
To avoid mistakes when using the Index Strength Strategy Indicator, traders should keep the following tips in mind:
Don't rely solely on the indicator - it should be used in conjunction with other technical analysis tools and fundamental analysis.
Use appropriate risk management strategies, including setting stop-loss and take-profit levels.
Adjust the input parameters of the indicator to match your trading style and preferences.
Avoid overtrading and chasing trades - wait for the right opportunities to enter or exit positions.
Trading Strategy Test Results: Time Frame Tested for 15 Mins
To provide an idea of the potential performance of the Index Strength Strategy Indicator, let's look at some recent test results for two popular indices - Bank Nifty and Nifty 50.
From 1-May-2023 to 12-May-2023, using 2 lots of Bank Nifty with the Index Strength Strategy Indicator, a profit of 15,175 was achieved, with a percentage profitable trade rate of 80% and a profit factor of 3.395. The maximum drawdown was 7,000, and the average trade was 3,035.
During the same time period, using 1 lot of Nifty 50 with the Index Strength Strategy Indicator, a profit of 8,187 was achieved
Conclusion:
The Index Strength Strategy Indicator is a useful tool for traders to identify trends, determine trend strength, and generate buy and sell signals. Traders can use the indicator in conjunction with other technical analysis tools and fundamental analysis to make informed trading decisions. By following proper risk management strategies and avoiding common mistakes, traders can use the indicator to improve their trading performance.
Breadth Indicators

Auction Theory Price LevelsKnowing the levels where price might find support or resistance is critical in trading. These are the levels where buyer or sellers previously showed up.
A bull trend is recognized by higher highs and higher lows on a daily or weekly chart whereas a bear trend is recognized by lower highs and lower lows. Knowing where these daily and weekly levels are will help to expect when and where a bounce or rejection might occur. Alternatively a break of these levels might hint at a change in trend. As they say, never get bullish at the top or bearish at the bottom until the level is broken and held.
This indicator adds these critical levels to the chart and let you hide the ones that are not important to your style of trading (all times are in US Eastern)
- pre-market (4am to 9:30am): low, high, mid
- previous day; low, high, close
- previous week: low, high
- current week: high, low
- initial balance (9:30am to 10:30am): low, high
- current session: open, low, high, mid
If you like the indicator, please like and share!
Thank you!

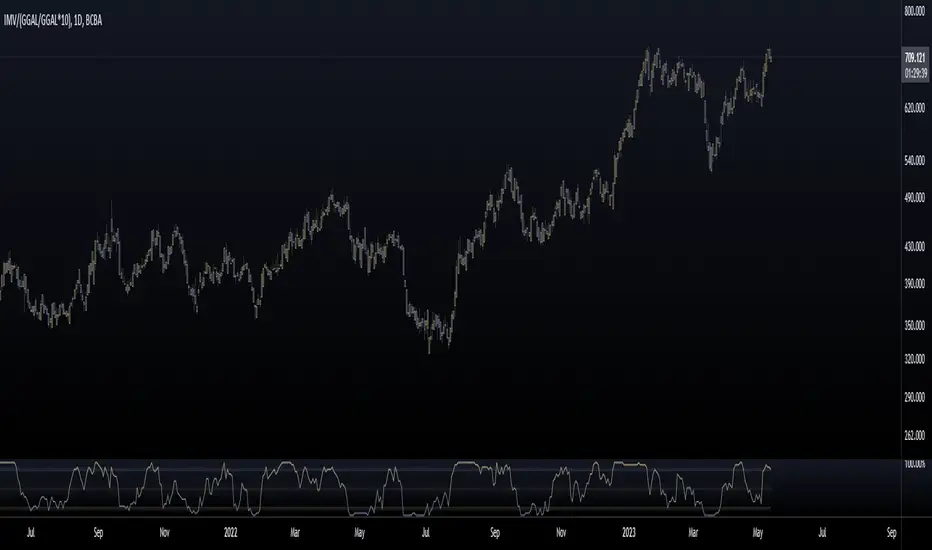
Mervaleta BreadthFellow Merval investors/traders , I'm sharing this script with you that allows you to calculate a breadth indicator using the components of the Merval Index (IMV) from Argentina.
This breadth indicator shows the percentage of stocks that are above a moving average. In this case, you can choose between an EMA or SMA, and you can select the period of the moving average.
The components that make up the index and were used for this script are as follows:
AGRO
ALUA
BBAR
BMA
BYMA
CEPU
COME
CRES
CVH
EDN
GGAL
HARG
LOMA
MIRG
PAMP
SUPV
TECO2
TGNO4
TGSU2
TRAN
TXAR
VALO
YPFD
For all of them, their dollar value in CCL was used, calculated with GGAL.
Enjoy :)
NSDT Custom High and Low LinesFirst, the credit for the original script to plot a High and Low between a certain time goes to developer paaax.
I took that idea, converted it to Pinescript V5, cleaned up the code, and added a few more lines so you can plot different levels based on time of day.
Published open source like the original.
The example shown has:
Blue - plotting from the start of the Futures Asian session to the start of the Futures USA Session. (6:00PM - 9:30AM Eastern)
Yellow - plotting from the start of the Futures Europe session to the start of the Futures USA Session. (3:00AM - 9:30AM Eastern)
Green - plotting from the start of the Futures US Premarket session to the start of the Futures USA Session. (8:00AM - 9:30AM Eastern)
These are great levels to use for breakouts and/or support and resistance.
Combine these levels with the 5 min Open Range levels, as you have some good trades.
Each of the three sessions have individual start and end times that can be modified by the trader, so you can easily mark off important areas for your style of trading.

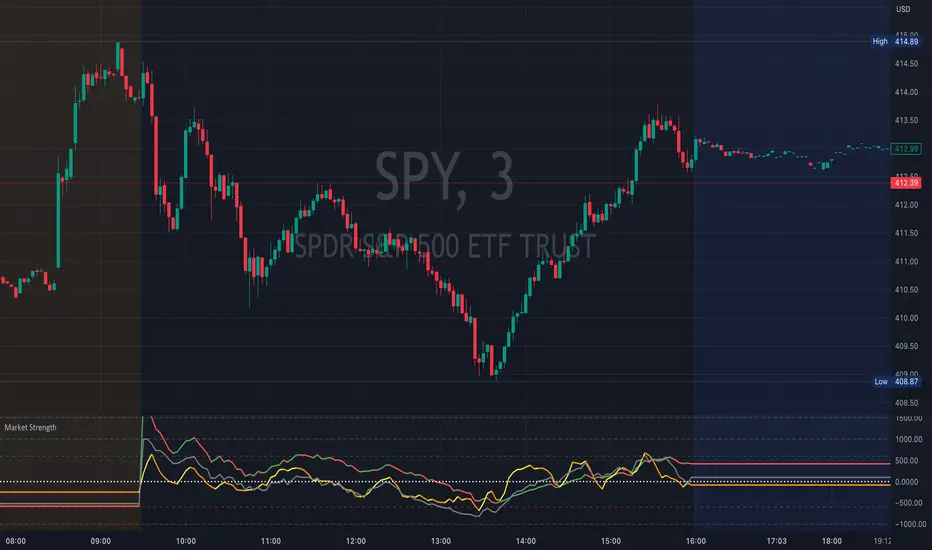
Market StrengthThis indicator tracks USI:ADD , USI:TICK , USI:VOLD on the chart while sharing the same space. This allows you to watch these important indicators without the need to give up separate dedicated space for each of them.
USI:ADD is the number of NYSE stocks advancing vs declining
USI:TICK is the number NYSE stocks trading on an uptick vs downtick
USI:VOLD is the NYSE Volume Difference and is the difference between the up volume and down volume
Zero is considered to be the pivot. The more positive the values, the more bullish in nature, while the more negative the values, the more bearish in nature.
When these are at an extreme, they indicate a possible market trend while smaller directional changes may foreshadow a market move in that direction.
If you like the indicator, please like and share!
Thank you!
TVM Market BreadthReadings for VOLD Market Breadth. Gives readings based upon the ratio of VOLD. Will give a No Trend, Potential Trend, and Trend reading for either direction depending on the data.

Market Internal TrendMIT - Market Internal Trend
I've developed what I consider to be the best market internals, market breadth indicator on Trading View to date :)
Market internals (sometimes referred to as Market Breadth) are built-in indicators of the market, there are the following main indicators:
TICK - Uptick or downtick transaction of market (NYSE/NASDAQ)
ADD - Advancing or declining issues/stocks of the market
VOLD - Up volume or down volume of the issues/stocks of the market
TRIN - Trend of market based on ADD and VOLD
VIX - Volatility of the market
PCN - Options market puts vs calls
What makes this different?
This single compact indicator delivers an "eyes on glass" style presentation to detail extreme movements of TICK, sentiment analysis of ADD and VOLD as well as their trends and report when the market is most likely balanced or an in imbalance. No need to study multiple clouds and amassing a ton of different charts all with similar indicator setups and candle analysis in the heat of the moment.
Use this to determine the overall initial trend at open, watching for imbalance and extreme movement on TICK as a signal to prepare for potential trades. The metrics table is useful to see where potential rejections/bounces may occur on the volatility index.
Extreme tick closures (see below) can provide excellent trim or exit signals for existing trades depending on the market structure of the day (trending or ranging).
How To Use
The main histogram represents the highs and lows of TICK, anything within the +/- $500 region is most likely normal movement while anything outside of that will brighten in color and indicates potential larger reactions. Extreme highs and lows will be represented by white diamonds by default, closures are indicated by bright colored crosses at $0. Price levels should be noted on the securities being traded during TICK extreme movement, these usually act as dynamic support and resistance from my observations but your results may vary (please share in comments your experiences!).
There is a smoothed trend line over the histogram, by default it's white in color, and this represents simply a trend of TICK closures - when it's trending down the market should be following in kind and vice versa; adjust the smoothing length in settings to suit your trading style.
The center line will have colored dots, by default yellow for balanced markets or white for imbalanced markets. When the market is in an imbalance that's when trending moves have been observed and balanced markets are usually choppy with sideways price action not suitable for quick scalp type trading styles.
The upper colored band represents the market overall advancing or declining issues/stocks within the market, by default green tones are bullish for a advancing market and red tones represent bearish market - the brighter the tone the strong the sentiment. There are triangles at all times above this band and that represents a smoothed trend status as compared to the current amount of stocks in advance or decline, if the smoothed trend is above then it's potentially a signal of reversal (red triangles over green band would be bearish reversal and vice versa).
The lower colored band works the exact same as the upper band but it tracks the up and down volume of the issues/stocks within the market, it utilizes the same color and triangle logics as the upper band.
Markets
Currently this will present internals data for NYSE and NASDAQ, I'm still researching other markets internals and their particulars.
The signals on this indicator will best apply to SPY, QQQ, ES, NQ or highly liquid ETFs largely affected by NYSE or NASDAQ - individual stocks may have mixed results depending on how they're moving with major indexes so keep that in mind when watching for sympathy moves with the indicator.
Usage Conditions
All of the market internals are fantastic indicators when day trading, I've had great success on 1-15 minute and even higher for scalps or intra-day swings. Observing the middle dots will save those of you that struggle in choppy markets from being too aggressive when opportunities don't exist.
Use the triangles, diamonds, dots and crosses to your advantage to manage your scalps and intra-day swings, or gain an edge in preparation for entering trades!
I hope this indicator is a benefit to all for day trading, provide any feedback or feature requests in the comments.

Z-Score(Slope(OBV(LBC)))Summary : Market price is simply a dance of liquidity to the specific market.
tl;dr: "Cash come-in, market moon; Cash go-out, market doom"
In Simple Language : Large changes in the money flow to an asset often mark local price extremia.
Academic paper:
Title: Z-Score(Slope(OBV)): An Efficient Indicator for Identifying Local Extremes in Asset Prices
Abstract: This paper presents a novel trading indicator, Z-Score(Slope(OBV)), that aims to predict local extremes in asset prices by analyzing the patterns of money flow. The indicator is constructed using the Z-score of the slope of the On Balance Volume (OBV).
Hypothesis: The price levels at which the money flows into and out of an asset often mark local extremes. This notion underpins our exploration of the Z-Score(Slope(OBV)) indicator's potential in identifying these critical points.
1. On Balance Volume (OBV): The OBV is a momentum indicator that leverages the volume flow to forecast potential changes in asset prices. It operates on the premise that changes in volume often presage shifts in price. The OBV algorithm adds a period's volume to the cumulative total when the closing price is up and subtracts it when the closing price is down. Therefore, an ascending OBV suggests positive volume pressure, potentially heralding higher prices, while a declining OBV signifies negative volume pressure, possibly indicating lower prices.
2. Slope: In this context, the slope represents the rate of change of the OBV. It is a measure of the rise-over-run for a linear regression line through the OBV data points. By evaluating the slope of the OBV, we can extract valuable insights into the momentum of the volume. A positive slope indicates increasing volume momentum, suggesting growing interest in the asset, while a negative slope implies declining volume momentum, potentially reflecting dwindling interest.
3. Z-Score: The Z-score is a statistical measure that delineates a data point's relationship to the mean of a group of values, expressed in terms of standard deviations from the mean. For instance, a Z-score of 0 reveals that the data point's score aligns with the mean score. Positive Z-scores indicate values higher than the mean, and negative Z-scores represent values lower than the mean. Applying the Z-score to the slope of the OBV allows us to comprehend the degree of deviation of the current OBV slope from its historical mean.
A Z-score of 1 suggests that the OBV's slope is one standard deviation from the mean, which implies that the slope is within the range of values where approximately 68% (not 67%) of all values lie.
A Z-score of 2 implies that the slope is two standard deviations from the mean, thus within the range where roughly 95% of all values lie.
A Z-score of 3 indicates that the slope is three standard deviations from the mean, putting it within the range where about 99.7% of all values lie.
Z-scores of 4 and 5 and beyond are increasingly rare and represent extreme values.
4. The Z-Score(Slope(OBV)) Indicator and Line Break Chart Synergy: The Z-Score(Slope(OBV)) indicator's efficiency is further amplified when visualized using a Line Break chart. This chart type disregards time, concentrating solely on price changes, thus providing a clear visualization of market trends. When combined with the Line Break chart, the Z-Score(Slope(OBV(LBC))) indicator can help traders identify trend shifts more accurately and promptly, reinforcing the hypothesis that price levels where money flows into and out of an asset often mark local extremes.
In summary, the Z-Score(Slope(OBV)) indicator, combining volume, momentum, and statistical analysis, provides a robust tool for traders to predict local extremes in asset prices.
Regarding Implementation:
- This is implemented using Pinescript V5
- Uses inbuilt ta module
- Very effective and simple and efficient computation in 30 lines of code

Tick Profile HeatmapThis is a market internal TICK heatmap with the intent of displaying areas of price associated to stronger reactions with NYSE TICK (by default).
This code is based off of a variation of a Volume Profile coded originally by colejustice who originally used code from LuxAlgo . The full-width volume bars that colejustice setup were replaced with full-width bars representative of TICK breaking +/- $500, the current cumulative value representing the "heat" is comprised of hlc3 by default but that can be changed. In a future update I may add additional logic here to capture highs and lows in the heatmap specifically, and perhaps additional colors.
As with other traditional profiling studies, this indicators purpose is to visualize correspondence to specific price levels, allowing rapid assessment where the most TICK activity is occurring, and where it hasn't been. This information may provide areas of support and resistance and regions where price may move quickly repeatedly.
All of the same input guidance that colejustice provided is the same for those pre-existing inputs:
Inputs are set up such that you can customize the lookback period, number of rows, and width of rows for most major timeframes individually. Timeframes between those available will use the next lower timeframe settings (e.g., 2m chart will use the 1m settings.)
Zero usage of volume is present in this indicator, only TICK data so please don't confuse it with volume studies.

Adjusted OBVThis script shows On-Balance Volume adjusted for volume weighted candle body size.
This means that the wick lengths, body length, and sell/buy pressure are calculated into percentages of volume that contributed to each.
The body volume is the accumulatively tracked across candles to give a more accurate On-Balance Volume that has been traded to achieve the current price over time.
The script output is in Orange and for comparison the original technical OBV is in Blue.
As this is my first script, I hope to update it to include a 'buy' and 'sell' pressure gauge to perhaps turn this from a mere indicator into potentially a bit more predictive.
In the meantime, it should be useful for tracking OBV for other uses in a more accurate and less volatile way.

Adjusted OBV with Cross & DivergenceOBV is a technical indicator used to observe changes in volume. Traditional OBV calculate all historical volume, it makes the OBV being usually higher than 0.
What I think of this is that calculating volume for a period of time is more useful than all historical volume.
So I made some adjustments to the OBV Period, only calculating the volume from the past 120 days.
Why It's 120 days?
Because I backtested COINBASE:BTCUSDT, it has better performance.
In addition, I also set up MA12 and MA30, which is the MA OF OBV. What it does is to provide entry signal for trading.
This is what you can use this indicator(see Chart):
1. OBV Divergence(Top divergence = bearish, Bottom divergence = bullish)
2. Observe the OBV is in Uptrend or Downtrend(Uptrend = bullish, Downtrend = bearish)
3. The crossing of two MA12 and MA30 can be used as an entry signal(Golden cross = bullish, Death Cross = bearish)
4. Use Deduction ball to see OBV goes up or down in the next few candles
How to know if OBV has Divergence?
Price Higher + Lower OBV = Top divergence
Price Lower + Higher OBV = Bottom divergence
How to see if OBV is in Uptrend or Downtrend?
If OBV is above MA12/MA30, it's in uptrend, if OBV is below MA12/MA30, it's downtrend.(See chart)
What is Deduction ball?
It's used to compare to the volume 120 days ago, this can help to see if OBV goes up or down in the next few candle.
Why use MA12/MA30 with 120 days volume?
Because I backtested COINBASE: BTCUSDT, and found that it has higher winning rate.
中文說明(Chinese Explanation):
OBV是用來觀察成交量變化的技術指標。 傳統的OBV計算所有的歷史成交量,使得OBV經常為正。
我的想法是,計算一段時間的交易量比所有歷史交易量更有用。
所以我對 OBV 時間長短做了一些調整,只計算過去 120 天的交易量。
為什麼是120天?
因為我回測了COINBASE:BTCUSDT,它的性能更好。
另外,我還設置了MA12和MA30,也就是OBV的簡單移動平均。 它的作用是為交易提供入場信號。
這是您可以使用該指標的內容(見圖表):
1. OBV背離(頂部背離=看跌,底部背離=看漲)
2.觀察OBV處於上升趨勢還是下降趨勢(上升趨勢=看漲,下降趨勢=看跌)
3.兩條MA12和MA30的交叉可以作為入場信號(黃金交叉=看漲,死亡交叉=看跌)
4. 使用抵扣球查看 OBV 在接下來的幾根蠟燭中會上升還是下降
如何知道OBV是否有背離?
價格更高 + 更低的 OBV = 頂部背離
價格更低 + 更高 OBV = 底部背離
如何查看 OBV 處於上升趨勢還是下降趨勢?
如果 OBV 高於 MA12/MA30,則處於上升趨勢,如果 OBV 低於 MA12/MA30,則處於下降趨勢。(見圖表)
什麼是抵扣球?
它用於與 120 天前的成交量進行比較,這有助於查看 OBV 在接下來的幾根蠟燭中是上漲還是下跌。
為什麼使用MA12/MA30 與120長度的成交量?
因為我回測了COINBASE: BTCUSDT,發現它的勝率更高。

[TT] Sectors Dist % From MA- The script shows the distance in percentages from the 200 MA (or any other MA period) , for the 11 SP500 sectors.
- It works based on the current time frames.
Could be useful when working with mean reversion strategies to detect extremes zones and overbought/oversold conditions in the given sectors compared others.

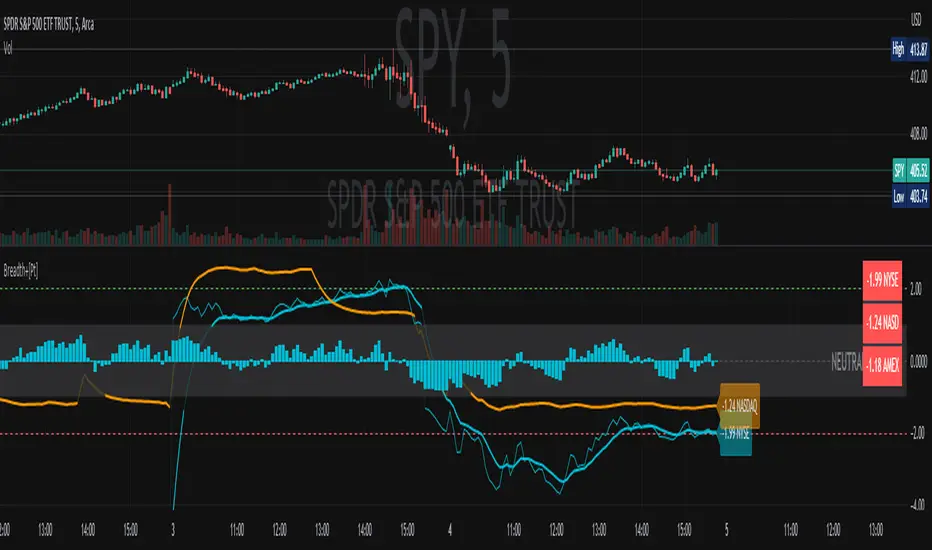
Market Breadth Ratio+ [Pt]This is a + version of my original Market Breadth Ratio Indicator
DESCRIPTION
The Market Breadth Ratio+ indicator is a tool that can help traders gain a more comprehensive understanding of market breadth by providing a ratio between Up volume (UVOL) and Down volume (DVOL).
While the VOLD indicator provides a straightforward measure of the difference between UVOL and DVOL, it doesn't account for the rate of change. The Market Breadth Ratio+ indicator, on the other hand, takes the rate of change into account, providing a plot line that is easier to interpret and understand.
The Up Volume vs Down Volume Ratios measure the strength of buying versus selling pressure in the market. A ratio greater than 1 indicates that there is more buying pressure, while a ratio less than -1 indicates more selling pressure. The ratio is calculated by dividing the total volume of stocks that closed up on the day by the total volume of stocks that closed down.
|| ------------------------------------------------------------------------------------------------------------------------------------------------------------------------------------||
This script includes the following premium unique features.
1) Custom Moving Average line for Breadth Ratio line. There are a few MA type to choose from: SMA, EMA, RMA, WMA, VWMA, HMA
- This feature provide a smoother plot for better interpretation of the market trend
- MA crossovers can also be used as trend reversal signals
2) Breadth Strength Index (BSI)
- This graph shows the relative strength of the Breadth Ratio. This is a momentum based oscillator that measure the rate of change of the Breadth Ratio. It shows the strength and weakness in the Breadth Ratio plot.
- A bar close to 1 means the market is very strong in the Bullish direction, conversely, a bar close to -1 means the market is very weak, but very strong in the Bearish direction
- Above 0 shows Bullish strength
- Below 0 shows Bearish strength
3) Two display modes for Breadth Strength Index
- Histogram
- Line
- These can be combined to show different markets together, such as NYSE and NASDAQ
4) Custom Moving Average can be applied to the BSI
- This will provide smoother graph for easier interpretation
5) Aggregated Market Strength
- This feature combines the BSI of multiple markets, such as NYSE and NASDAQ, to provide a more comprehensive view of the overall US market. Often time, one of these indices will have a stronger 'pull' on the entire market. By observing the dominant color (of your choosing), you can see which index is pulling the market. And by trading the market that has the bigger pull, traders can leverage on the possible higher volatility for greater trade opportunities.
6) Custom Moving Average can be applied to the Aggregated Market Strength
- This will provide smoother graph for easier interpretation
7) Show alternating trend colors on Aggregated Market Strength
- This provides an intuitive view of the market strength that's based on market breadth ratio
MESThe Double Bollinger Bands strategy is a trend-following strategy that aims to identify high-probability trading opportunities in trending markets. The strategy involves using two sets of Bollinger Bands with different standard deviation values to identify potential entry and exit points.
Bollinger Bands are a technical analysis tool that consists of three lines plotted on a price chart: a simple moving average (SMA) in the middle, and an upper and lower band that are each a certain number of standard deviations away from the SMA. The standard deviation value determines the width of the bands, with a larger deviation resulting in wider bands.
In this indicator, the first set of Bollinger Bands is calculated using a length of 20 bars and a standard deviation of 2, while the second set uses a length of 20 bars and a standard deviation of 3. The bands are plotted on the price chart along with the SMA for each set.
The buy signal is generated when the price falls below the lower band of the second set of Bollinger Bands (the 3-standard deviation band) and then rises above the lower band of the first set (the 2-standard deviation band). This is interpreted as a potential reversal point in a downtrend and a signal to enter a long position.
Conversely, the sell signal is generated when the price rises above the upper band of the second set of Bollinger Bands and then falls below the upper band of the first set. This is interpreted as a potential reversal point in an uptrend and a signal to enter a short position.
To make it easier to identify buy and sell signals on the price chart, the indicator plots triangles above the bars for sell signals and below the bars for buy signals.
Overall, the Double Bollinger Bands strategy can be a useful tool for traders who want to follow trends and identify potential entry and exit points. However, as with any trading strategy, it is important to backtest and thoroughly evaluate its performance before using it in live trading.

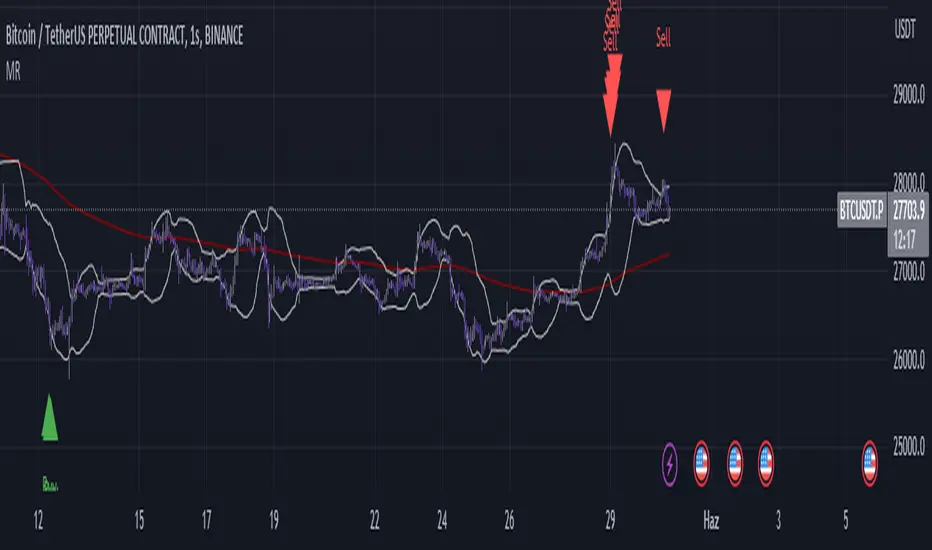
Mean ReversionThe "Mean Reversion" indicator in this script is a popular trading strategy that is based on the concept that over time, prices tend to move back towards their mean or average. This trading strategy seeks to identify instances where the price has deviated significantly from its mean and therefore presents an opportunity to profit from its eventual reversion to the mean.
The script calculates the distance between the current price and the EMA using the ATR, which is a measure of volatility. By multiplying the ATR by a specified factor, the script establishes a distance between the current price and the EMA. If the price falls below this distance, it triggers a potential buy signal, indicating that the price may be oversold and due for a rebound.
The script also uses Bollinger Bands to help identify potential buying and selling opportunities. The Bollinger Bands are a technical indicator that measures the volatility of an asset by plotting two standard deviations away from a moving average. When the price moves outside of the Bollinger Bands, it can indicate that the asset is overbought or oversold, potentially triggering a buy or sell signal.
The script's "buySignal" variable is triggered when the price is below the EMA by the specified ATR distance and also falls below the lower Bollinger Band. Conversely, the "sellSignal" variable is triggered when the price is above the EMA by the specified ATR distance and also rises above the upper Bollinger Band.
The script plots the EMA, Bollinger Bands, and the buy and sell signals on the chart for easy visualization. Additionally, the script includes alerts that can be set up to notify the user when a buy or sell signal is triggered, so that they can act on the information in a timely manner.
In summary, this script is a Mean Reversion indicator that aims to identify potential opportunities to buy or sell assets based on deviations from their mean price using a combination of the ATR, EMA, and Bollinger Bands.
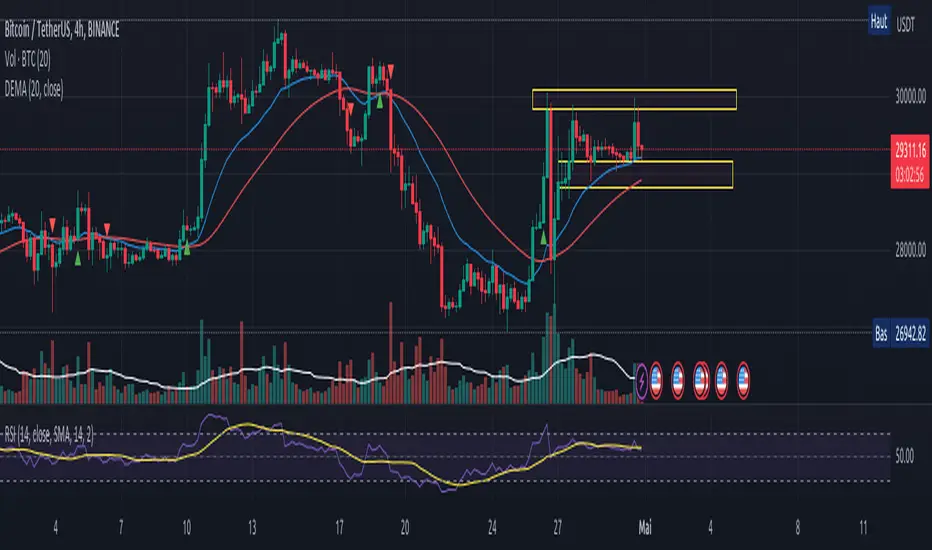
Dave Trend LinesDescription:
This indicator works with 2 main set ups.
1.-Price Action: 2 Trending lines : 1 superior with relevant high at 120 periods and 1 inferior with releveant lows of 120 perios.
2.-(hiden) 2 RSI Trending lines (based on 14 period and close) : 1 superior trend line with relevant high at 120 periods and 1 inferior trend line with releveant lows of 120 perios.
This indicador works as follows:
1.- Indicator detect chart form with trend lines and based on the last bar to 120 candles before.
Chart detected:
1.- Wedges = Cuña
2.- Chanels = Canal
2.- Indicador calculate trend lines superior and inferior of RSI with 120 candels previus.
2.- The indicator activate alerts once these conditions presented at the same time:
a) Price breake above trend line superior or breake under line inferior.
b) RSI brease above trend line superior or inferior.
How to use:
1.- Add indicator
2.- Indicator will show
*Buy / Sell Alerts.
3.- Stop Loss (Red Line) and Take Profit (Green Line) will be calculated automatically based on trading system theory with wedges and chanels.
4.- In Buy postion take Profit will be recalculated once new lows above the stop loss are presented.
In Sell postion take Profit will be recalculated once new lows above the stop loss are presented.
5.- Once price achiece take porfit level it will trigert an alert.
6.- Trade will be closed when Price cross the Stop Loss or Take Profit Dinamic.
Originality:
This is based on what I would like to know before start trading and loos a lot of money buying or selling with out any strategy regarding risk management, trade management, set up entry and close levels.
Risk Management:
Paramenters:
Risk = 1%
Capital = Variable Account Capital.
These 2 variables that the user can change, the indicator will sugget the lot size on that trade to avoid loose more that 1% of the capital in case the trade close with losss.

duval Moyenne Mobile Exponentielle Doubleindicateur permet de prendre des decision a partie des donnes de moyennes mobiles znb un seuk indicateur ne permet pas de prendre une decision d'achat ou de vente
Overbought & Oversold HeatmapThe Broadview OBOS Heatmap is a new indicator that takes commonly used oscillators and transforms them into a powerful heatmap, providing traders and investors with an unparalleled level of insight into market trends and cycles. With the ability to visualize 15 different oscillators all at once, the Broadview Overbought & Oversold Heatmap offers users the ability to control and analyze an impressive array of indicators.
The Relative Strength Index (RSI) is a momentum oscillator that measures the speed and change of price movements. It is often used to identify overbought and oversold conditions in the market. The Money Flow Index (MFI) is a volume-weighted version of the RSI, used to measure buying and selling pressure. The Commodity Channel Index (CCI) is a versatile oscillator used to measure momentum, trend, and overbought/oversold conditions. It is often used to identify trend reversals.
The Aroon Oscillator is a trend-following oscillator that measures the strength of a trend and the potential for a trend reversal. The Relative Volatility Index (RVI) is a volatility-based oscillator that measures the strength of a trend and potential trend reversals. The Stochastic Detrended Price Oscillator is a momentum oscillator that measures the difference between the current price and its moving average.
The Stochastic Elders Force Index is an oscillator used to measure buying and selling pressure. The Stochastic Relative Strength Index is a momentum oscillator used to measure the strength of a trend. The Stochastic Relative Vigor Index is a momentum oscillator used to measure the trend strength and potential reversals. The Stochastic Klinger Oscillator is a momentum oscillator that measures buying and selling pressure. The Stochastic Awesome Oscillator is a momentum oscillator that measures the difference between two moving averages.
The Stochastic Ultimate Oscillator is an oscillator used to measure the strength of a trend and potential reversals. The Stochastic Chande Momentum Oscillator is a momentum oscillator that measures the difference between two moving averages. The Stochastic On Balance Volume Oscillator is a volume-based oscillator used to measure the buying and selling pressure. The Stochastic MACD is a momentum oscillator that measures the difference between two moving averages.
The Broadview OBOS Heatmap is an extremely powerful indicator that reimagines commonly used oscillators as a heatmap, providing traders and investors with an unparalleled level of insight into market trends and cycles. With the ability to control and analyze 15 different oscillators at once, the Broadview Overbought & Oversold Heatmap offers users an incredibly comprehensive tool for analyzing market trends and making informed trading decisions.

RBX - OBV MACDOBV (On-Balance Volume) is a technical indicator that measures the momentum of buying and selling pressure in a market based on the volume of trades. It uses a cumulative total of volume traded during periods of price increases and decreases to determine the overall trend. When prices rise, OBV increases, and when prices fall, OBV decreases.
The enhanced version of OBV combines the traditional OBV formula with the MACD (Moving Average Convergence Divergence) indicator to provide more information about the momentum of the volume flow. The MACD is a trend-following momentum indicator that shows the relationship between two moving averages of price.
In the enhanced OBV with MACD, the top color in the OBV line indicates the quadrant of the MACD, with green indicating the first quadrant (positive value of MACD and increasing), red indicating the second quadrant (negative value of MACD and decreasing), magenta indicating the third quadrant (negative value of MACD and increasing), and cyan indicating the fourth quadrant (positive value of MACD and decreasing).
The top bar color in the enhanced OBV with MACD indicates the increasing or decreasing of the MACD histogram. A green bar indicates an increasing histogram, while a red bar indicates a decreasing histogram.
In addition, the plus bar sign in the enhanced OBV with MACD signifies that the OBV is making a new high or new low. This helps traders identify potential trend reversals or confirm the current trend.
Overall, the enhanced OBV with MACD provides traders with more information about the momentum of volume flow and potential trend reversals, making it a useful tool for technical analysis in trading.
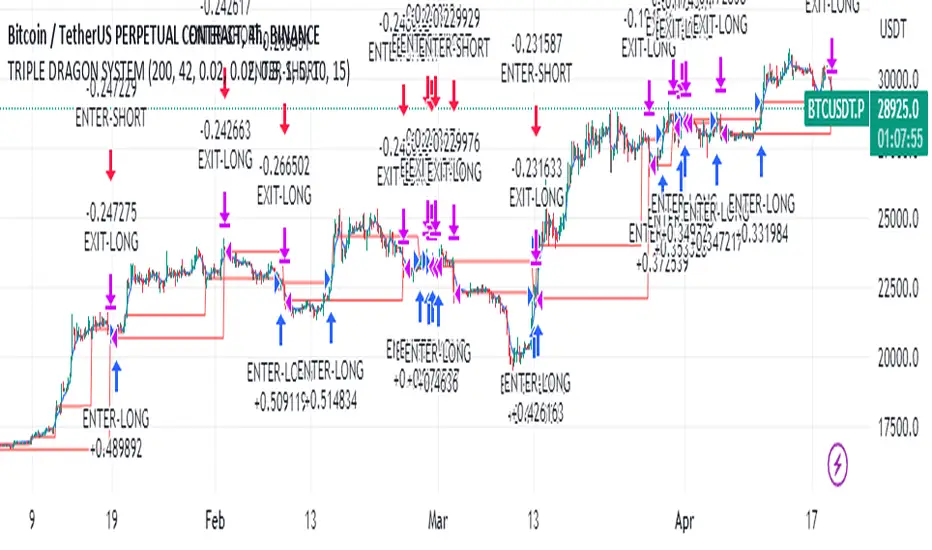
Educational Strategy : TRIPLE DRAG-ON SYSTEM V.1The Triple Dragon System is a technical trading strategy that uses a combination of three different indicators to identify potential buy and sell signals in the market. The three indicators used in this strategy are the Extended Price Volume Trend (EPVT), the Donchian Channels, and the Parabolic SAR. Each of these indicators provides different types of information about the market, and by combining them, we can create a more comprehensive trading system.
The EPVT is used to identify potential trend changes and measure the strength of a trend. The Donchian Channels are used to identify the direction of the trend, while the Parabolic SAR is used to provide additional confirmation of trend changes and help determine potential entry and exit points.
In this strategy, we first use the EPVT and Donchian Channels to identify the direction of the trend. When the EPVT is above its baseline and the price is above the upper Donchian Channel, it suggests an uptrend. Conversely, when the EPVT is below its baseline and the price is below the lower Donchian Channel, it suggests a downtrend.
Once we have identified the trend direction, we use the Parabolic SAR to help determine potential entry and exit points. When the Parabolic SAR is below the price and flips to above the price, it suggests a potential buy signal. Conversely, when the Parabolic SAR is above the price and flips to below the price, it suggests a potential sell signal.
To further refine our trading signals, we use multiple timeframes to confirm the trend direction and ensure that we are not entering the market during a period of high volatility. We also use multiple take-profit levels to lock in profits and manage risk.
Overall, the Triple Dragon System is a comprehensive technical trading strategy that combines multiple indicators to provide clear entry and exit signals. By using a combination of trend-following and momentum indicators, we can identify potential trading opportunities while minimizing risk. Please note that this strategy is for educational purposes only and should not be taken as financial advice.
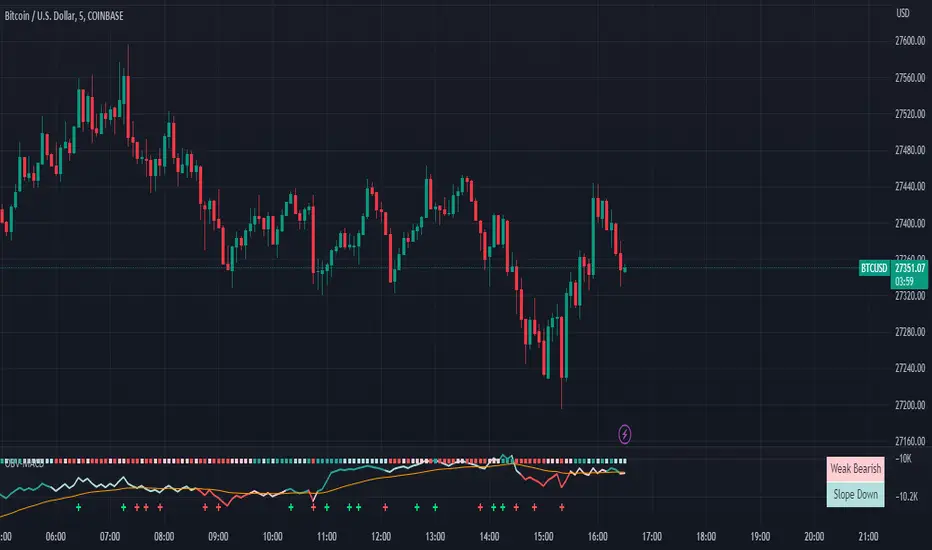
Indicatore volatilità v5 con segnali------------- INGLESE -------------
This indicator uses an exponential moving average (HMA) of the length specified by the user to calculate market volatility. Volatility is calculated by multiplying the Average True Range (ATR) by the simple moving average (SMA) of the volume.
The code uses colors to display market conditions. If the closing price is above the HMA, the columns turn green. If the closing price is below the HMA, the columns turn red. If volatility is below the SMA of volatility multiplied by the user-specified sideways volatility threshold, the columns turn orange.
In addition, the code uses the Rate of Change (ROC) to generate buy and sell signals. If the ROC is positive and the columns are green, a buy signal is generated and the columns turn black. If the ROC is negative and the columns are red, a sell signal is generated and the columns turn purple.
In summary, this indicator uses colors to display market conditions and help the user enter and exit the market based on volatility.
If you like this indicator give me a boost and leave a comment!! Thank you!
------------- ITALIANO -------------
Questo indicatore utilizza una media mobile esponenziale (HMA) della lunghezza specificata dall’utente per calcolare la volatilità del mercato. La volatilità viene calcolata moltiplicando l’Average True Range (ATR) per la media mobile semplice (SMA) del volume.
Il codice utilizza i colori per visualizzare le condizioni di mercato. Se il prezzo di chiusura è superiore all’HMA, le colonne diventano verdi. Se il prezzo di chiusura è inferiore all’HMA, le colonne diventano rosse. Se la volatilità è inferiore alla SMA della volatilità moltiplicata per la soglia di volatilità laterale specificata dall’utente, le colonne diventano arancioni.
Inoltre, il codice utilizza il Rate of Change (ROC) per generare segnali di acquisto e vendita. Se il ROC è positivo e le colonne sono verdi, viene generato un segnale di acquisto e le colonne diventano nere. Se il ROC è negativo e le colonne sono rosse, viene generato un segnale di vendita e le colonne diventano viola.
In sintesi, questo indicatore utilizza i colori per visualizzare le condizioni di mercato e aiutare l’utente a entrare e uscire dal mercato in base alla volatilità.
Se ti piace questo indicatore mettimi un boost e lascia un commento!! Grazie!

[TTI] Zanger Volume Ratio - Intraday––––HISTORY & CREDITS 🏦
The Zanger Volume Ratio - Intraday indicator is inspired by the work of Dan Zanger, a renowned trader and creator of the Zanger Volume Ratio tool. This specific adaptation of the ratio is designed for the TradingView platform and focuses on intraday trading. Dan Zanger used this same method of reading the chart to establish a world record in turning HKEX:10 ,775 into HKEX:18 ,000,000 in under 2 years.
––––WHAT IT DOES 💡
The Zanger Volume Ratio - Intraday indicator measures the estimated end-of-day volume percentage based on intraday (depending on the timeframe of your chart) comparisons for the last X days (input in the settings). It provides insights into the stock's trading volume in real-time throughout the trading day, giving traders an idea of the stock's relative volume compared to its recent trading history. For instance if you add it to a 5min chart the ratio represents the estimated end of day volume percent based on the last 3 days, the indicator will compare the cumulative volume of the current day to the X days back cumulative average up to that same point in time and tell you how it is around the thresholds.
The indicator categorizes the volume into five levels: Extreme, High, Average, Light, and Dry Up, each represented by different colors on the chart. It also displays a pace indicator, which shows whether the volume is increasing or decreasing during the trading session.
There is also a label that shows the current reading and its pace. The pace is the indication wether the volume ratio pace is increasing and picking up or it is slowing down.
Thesholds
👉EXTREME (red): >200, means "Volume is 200% of average daily volume
👉HIGH (magenta): 110
👉AVERAGE (peach): 85
👉LIGHT (orange): 60
👉DRY (gray): <60
––––HOW TO USE IT 🔧
To use the Zanger Volume Ratio - Intraday indicator effectively, follow these steps:
1️⃣ Apply the indicator to your TradingView chart with an intraday timeframe (>=1min and less than 1 day).
2️⃣Observe the real-time volume levels and their corresponding categories (Extreme, High, Average, Light, and Dry Up) to understand the current volume dynamics.
3️⃣Keep an eye on the pace indicator (arrows) to see if the volume is increasing or decreasing during the session.
4️⃣Use the information provided by the indicator to confirm trade setups, identify potential breakouts, or detect possible reversals. For example, a stock breaking out of a key area with high or extreme volume and an increasing pace arrow may indicate a strong upward move. Conversely, a stock pulling back on light or dry up volume could signal a continuation of the trend once the volume picks up again.
Remember to combine the Zanger Volume Ratio - Intraday indicator with other technical analysis tools and your own trading strategy to make informed decisions.

BTC Log High/LowThis indicator aims to display the price index of Bitcoin based on its logarithmic high and low values. Indicator calculates the logarithmic high and low values of Bitcoin using specific mathematical formulas and then applies a price index formula to obtain a value for each bar on the chart. The resulting value is plotted on the chart as a line, representing the Bitcoin price index.
The indicator also includes several horizontal lines at specific levels, which can be adjusted by the user. The lines are used to indicate important price levels and act as support and resistance levels. Additionally, the indicator includes two moving averages, a 100-period exponential moving average (EMA) and a 200-period EMA, which can be used to identify trends.
