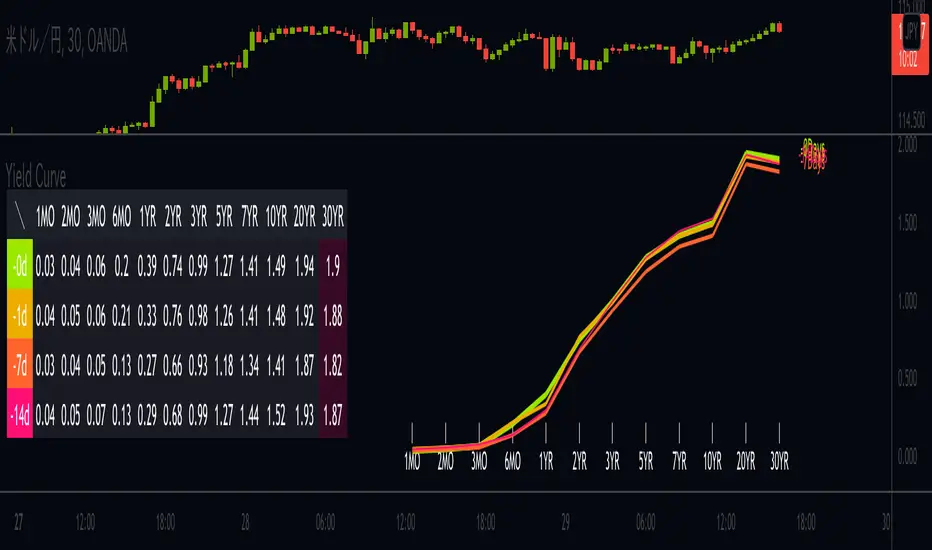
Yield CurvesIllustrating US treasury yield curves (x-axis for the term, y-axis for the yield) and yield matrix based on customized yield, which makes this script very unique in comparison with traditional timeframe-based yield curve indicator.
Inverted yield are highlighted with the heat map.
Can be used to analyze macro market through the shape and value of each yield curve.
Breadth Indicators
US Sector CorrelationsA new and interesting way to look at Breadth. As for the usefulness of it, one would have to do some proper backtesting to get a full grasp of the capabilities. This is just a concept currently. But in general, SPX holding near ATHs with very low sector correlations can be a topping indicator. SPX selling off with Correlations all very positive across each sector...can be a sign of an impending bottom. But, needs the "full bake" of proper testing and analysis versus just guessing. I like the concept and want to explore it further, and I will. This is just the start.

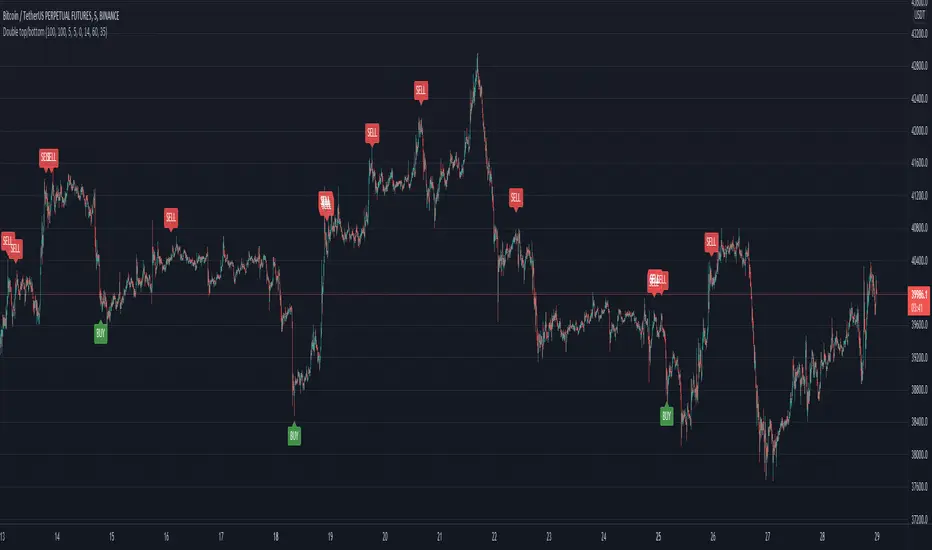
Double top/bottomHello!
This alerts is based on the double bottom pattern - for entering a long position / double top-short
A double bottom pattern is formed when two price bottoms are relatively at the same level and the top acts as resistance. This pattern appears at the end of a downtrend and signals a reversal.
A double top is a bearish reversal pattern that signals the end of an uptrend. It is formed by two price highs forming at the same level and a notch line that acts as local support.
As history and practice show, the double bottom pattern works better. Moreover, in a bull market.
// LOGIC ENTRY:
Period for short and long positions-to search for double bottom as well as double top . the more, the less false.
Change liong and short-channel width for pattern search separately for long and short.
General shift-the overall width of the channel, which changes equally at once for long and short
By default, quiet settings for 1 hour
You can choose the settings you like.
//FILTER SETTING
-RSI
If the checkbox is checked, the filter will be enabled.
The higher the upper bound, the less frequent short entries.
The lower the indicators of the lower border, the less frequent entries to the long
Litt Tick InternalsThe Litt Tick Internals uses the NYSE Cumulative Tick to show traders the number of stocks that are rising vs the number of stocks that are falling on the New York Stock Exchange. The Litt Tick Indicator allows traders to more easily read the TICK Index chart. It does this by showing traders colored tick candles and overbought / oversold areas. Green candles mean that the current TICK trend is UP and Red candles mean that the
current TICK trend is DOWN. Readings that occur in the overbought or oversold areas mean that the market is showing great strength or great weakness. Typically when we get into these zones we can see potential reversals; however, sometimes the strong readings are indicating that a very strong trend is taking place and the trend could continue. That is why it is best to pair this indicator with other tools to enhance its usefulness.
The Litt Tick Interals are meant to be used ONLY small intraday timeframes (1min - 5min) and ONLY on U.S. equities or U.S. equity options. The NYSE TICK index only runs during U.S. Market Hours; therefore, the Litt TICK Internals will only work from 0930-1600 EST.

Pivots High-Low Screener & AlertsHi fellow traders ,
Pleased to share a Pivot High - Low Screener.
The script uses the TV inbuilt Pivot function.
It Screens 25 tickers default set, these can be modified in the input dialog box.
All you need to do is attach to any chart and set the periodicity or the resolution of the chart to your desired alert() frequency requirement.
Now go to the input settings icon of the script and set your Pivot right and left parameters!
Set the alert from the menu as usual click - Any alert() function call and bingo you are done!!
Similarily change the chart periodicity to the next timeframe and set the next alert.
No more opening multiple charts and setting individual time consuming alerts().
You will get concatenated alerts or summary alerts for your tickers.
Track 25tickers with a single alert for each timeframe(Supports 40 tickers).
Happy trading with TV..

Gann FanHello All,
For long time I have been getting many requests about Gann Fan indicator. now we have linefill() function in Pine Language and I think it's right time to make Gann Fan Indicator. Many Thanks to Pine Team for adding many new features to the Pine Language!
How this indicator works:
- It calculates midline (1/1)
- By using midline it calculates other lines (1/2, 1/3, 1/4...etc)
- It calculates highest/lowest Pivot Points in last 280 bars.( by default it's 280 bars, you can change it and pivot period )
- It checks the location of highest/lowest Pivot Points
- After the calculation of the Gann Fan lines, it draws lines, puts Labels and paints the zones between the lines according to the colors set by the user
Long time ago I created a special algorithm for calculating the line with 45 degree and I used it for "1/1" line. Anybody who needs it can use this algorithm freely ;)
Options:
You can change following items;
- The colors
- Transparency. Possible values for transparency are from 0 (not transparent) to 100 (invisible)
- Line styles
- Loopback Period (by default it's 280)
- Pivot Period (by default it's 5)
- Enable/disable Labels
- Label location (by default it's 50
Tradingview Gann Fan page : The Gann Fan is a technical analysis tool created by WD Gann. The tool is comprised of 9 diagonal lines (extending indefinitely) designed to show different support and resistance levels on a chart. These angles -drawn from main tops and bottoms- divide time and price into proportionate parts and are often used to predict areas of support and resistance, key tops and bottoms and future price moves. Please note that the chart needs to be scaled properly to ensure the market has a square relationship....
Enjoy!

LUNA - Hold The Line Or DieThis indicator is trying to predict potential LUNA token bottom.
How does this work?
There is UST baked by LUNA and in case LUNA drops so hard that MC of LUNA is lower than MC of UST we are at risk of repeg and kinda "breaking" of Terra Blockchain.
This indicator doesn't take into account other stable assets but UST but they don't take a big portion of total stable tokens capitalization so it can be omitted.
Heavy buy pressure is expected at indicated levels.
The indicator is based on a simple formula:
LUNAfloor = USTmc/LUNAmc * LUNAprice

Мarket Breadth LabelsHistory and credits
The idea about this indicator, came from a friend teodorgun. www.tradingview.com
Special thanks to QuantNomad, whose courses got me started on programming on PineScript. www.tradingview.com
What it does
The indicator plots various values from market breadth indicators.
It shows the % stocks above certain moving averages for different indexes.
The first 3 cells, display the Advance Decline Ratios:
1. Total Advance Decline Ratio
2. NYSE Advance Decline Ratio
3. Nasdaq Advance Decline Ratio
- coloring for these is simple (value > threshold = color is green, value < threshold = color is red)
The rest of the columns display % stocks above the moving averages.
For example a value of 20 in column 4 ("Stocks above 5D MA), means that only 20% of the stocks are above their 5D moving average.
Line 1 shows current value of the indexes.
Line 2 shows value 5days ago (assuming that 5 trading days = 1 trading week).
- Line 1 Coloring: coloring here is divided between 2 tresholds ( value < lower treshold = color is red, value > lower treshold AND value < higher treshold = color is yellow, value > higher treshold = color is green)
- Line 2 Coloring: no coloring logic is applied here.
How to use it
There are several techniques for breadth indicators, many can be read online, but generally these indicators are considered contrarian. This means that high values indicate overbought conditions and low values indicate oversold conditions.

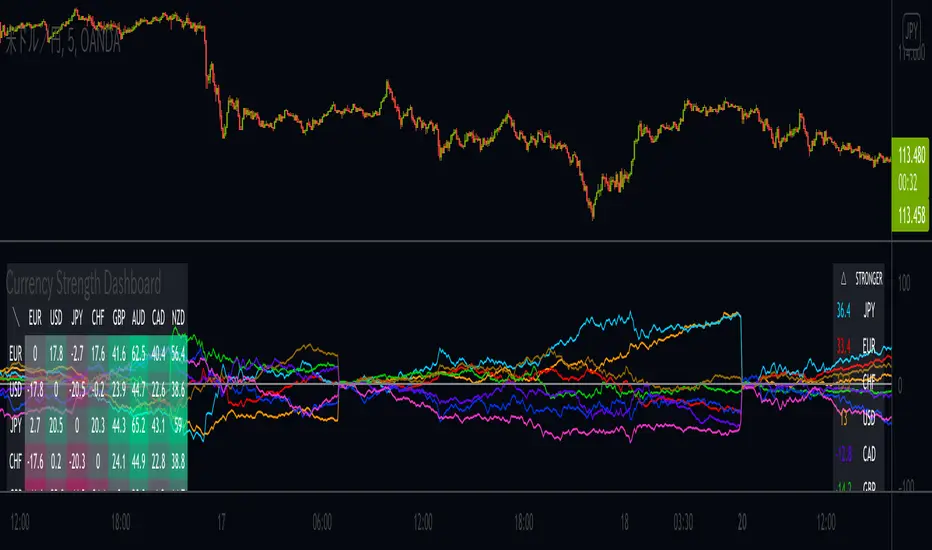
Currency Strength DashboardDrawing Currency Strength (consists of: USD, EUR, JPY, GBP, AUD, CHF, CAD, NZD) historical plots in parallel with currency strength heat map and dynamic legend, which makes this script unique as Dashboard.
Calculation criteria is based on user's input: Session, by which you can recalculate based on D, W, M.
KoadzOscillatorOscillator based on PVT and OBV.
Important levels to buy :
< 30, 40 for OBV
< 30 for PVT

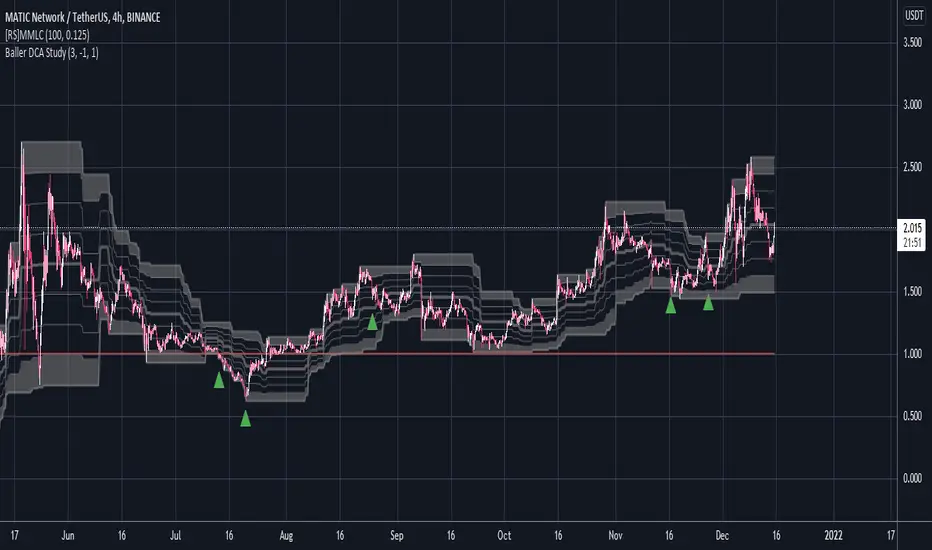
Baller DCA StudyFinds bottoms using CVI. Green arrow is the signal. Used for a DCA strategy in conjunction with MMLC
High-Low IndexHello All,
High-Low Index is a breadth indicator based on Record High Percent (RHP). RHP is based on new 52-week highs and new 52-week lows. RHP => 100 * (new highs) / (new highs + new lows). High-Low Index is a 10-day Simple Moving Average of the RHP, which makes it a smoothed version of RHP. You can find many articles about High-Low Index on the net.
High-Low Index above 50 indicates that there are more new highs than new lows, and considered as Bullish.
High-Low Index below 50 indicates that there are more new lows than new highs, and considered as Bearish.
High-Low Index = 0 indicates there is no new highs (0% new highs).
High-Low Index = 100 indicates that there is at least 1 new high and no new lows.
and High-Low Index = 50 indicates that new highs and new lows is equal.
by default 40 cryptos are used in the script and shows High-Low Index for these cryptos. but you can change them as you wish. for example you can set all of them as stocks and see High-Low Index for these stocks.
You can set " Time frame " and the " Length " using the options. For example; if you set " Time frame " = 1 Week and the " Length " = 52 then it finds High-Low Index for 52weeks .
or another example; if you set " Time frame " = 1 Day and the " Length " = 22 the High-Low Indexn it finds High-Low Index for 22days.
You can enable/disable Record High Percent or Simple Moving Average of High-Low Index. Some traders use High-Low Index with its SMA, for example; High-Low Index generates a buy signal when it crosses above its moving average, and a sell signal when it crosses below its moving average.
Optionally you can see the securities in a table on the left bottom, you can change table size by usşng the options.
In the Table, for each security/cell;
=> if background is green then it has New High
=> if background is red then it has New Low
=> if background is gray then no New High, no New Low
=> if background is back then Data is not available for the security
As you can see in the screenshot below, the securities were changed and stocks are used instead of cryptos, so it calculates & shows High-Low Index for these stocks.
you can also find explanation in this screenshot:
Enjoy!

Market Breadth EMAs V2Second version of Market Breadth EMAs for $SPY. Getting a little more complicated than V1 but removed noise.
Key:
Green line = % of stocks above their 20-period moving average, the "twitch line"
Red line = % of stocks above their 200-period moving average, the "long term trend"
White line = weighted average of the % of stocks above the 20/50/100/200 averages, the "general trend." Captures bursts that the 200 misses, and is more trustworthy than the 20.
Background colors = limits of the red/green/white where reversals have happened historically. The darker the color, the stronger the signal.
Histogram = the change in the white line over time, for different time periods: 1/4/10/20, the "trend strength/confidence." i.e. If the white line "General Trend" has been drifting lower for a month but started increasing the past 2 days, you might have 3 red histograms and 1 green one.
Techniques:
If the green, red, or white line is above 50%, then more than half the stocks are above that average. So, if they're in the top half, bullish market. Bottom half, bearish market.
If the green line is above the red, market has rising/bullish momentum. If red is above green, market has falling/bearish momentum.
If the white line is rising, bullish momentum. If it's falling, bearish momentum.
If the histograms are all green, there is strong momentum in that direction. The % of stocks above their important averages has been increasing each day for both the short term and long term.
If the histograms go from all green to a mix of green and red, be on the lookout for a reversal from one of the background levels. Usually initiates from the 20 (green line) first.
If price dips without the histogram changing, HODL.


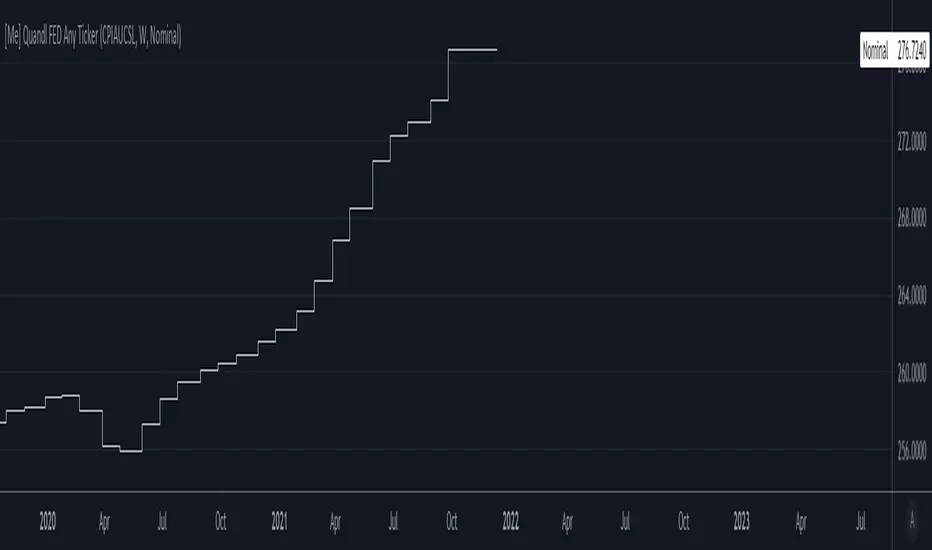
[Me] Quandl FED Any TickerPrivate Macro Indicator
Can find any ticker from fred.stlouisfed.org and plot it. For example Consumer Price Index, Ticker CPIAUCSL (fred.stlouisfed.org)
Select the Pick TF (timeframe) checkbox if you need to update the specific reporting of fed data, most of it updates weekly or monthly. Leave it unchecked if you are not sure how often the data updates.
Select the Dataset, either get the the raw nominal numbers or Month over Month Percent or Year over Year Percent.
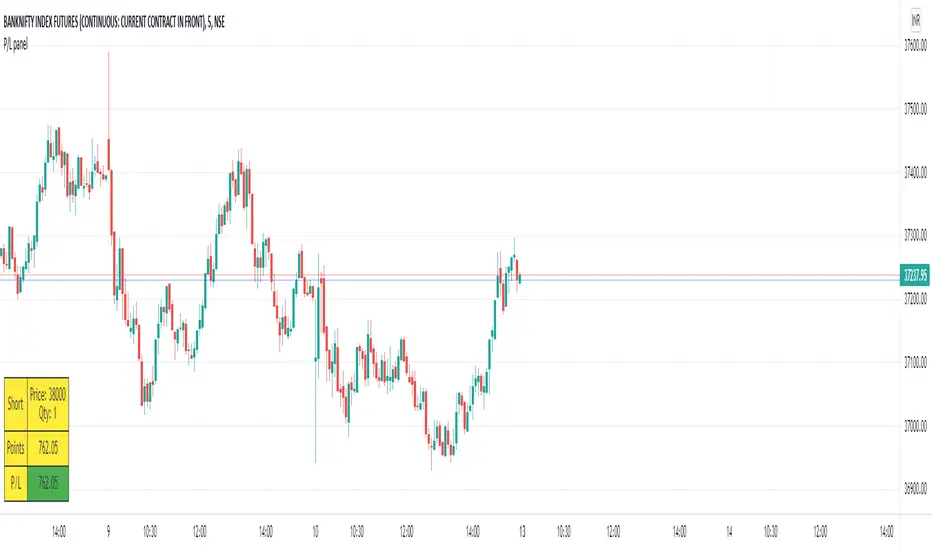
P/L panelThis is not a indicator or strategy.
I thought of having a table showing running profit or loss on chart from a specific price.
I tried to put the same in code and ended up with this code.
This is a table showing the running profit or loss from a manually specified price and quantity.
when you add the code, This table asks us to input the entry price and quantity.
It will calculate the running profit or loss with respect to running price and puts that in the table.
We will have to input two things.
1.) entry price: the price at which a position(long/short) is taken.
2.) Quantity: A +value need to be entered for Long position and -value for short position.
code detects whether its a long position or short position based on the quantity info.
for example if a LONG position is taken at a price 60 of 100 quantity,
then in price we need to enter 60
and in quantity 100 (+ve value)
for SHORT position at a price of 60 of 100 quantity,
in price we need to enter 60
and in quantity -100 (-ve value)
once the table is added to the chart.
Just double click on the table, it will open the settings tab and we can provide new inputs price/quantity/position.
positioning of table is optional and all possible positioning options are provided.
Advise further improvements required if any in this code.
This piece of code can be used along with any indicator.
For which we may need to use valuewhen() additionally.
Try it yourself and ping me if required.
Market Breadth EMAsThis is the combined market breadth tickers: S5TW, S5FI, S5OH, and S5TH representing the percentage of S&P 500 stocks above their 20, 50, 100, and 200 EMA respectively. The colors go from green (20) to red (200) because if 20 crosses above the 200, the market's bullish, and if the 20 crosses below the 200, the market is bearish. So if green is on top = bull market. If red is on top = bear market. In general the market sentiment is whichever color is highest up.
The background is colored in depending on a few historical extremes in the 200. The darker the color the more significant the buy/sell signal. These can be adjusted by changing the hline's in the code.

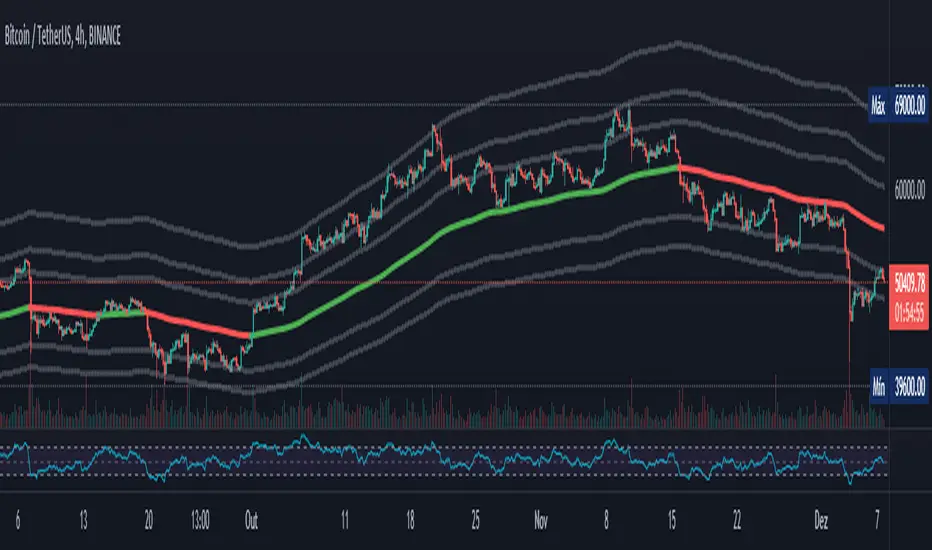
OB EMA Fibo TunnelThis indicator plots a base EMA and then plot many lines above and below according to the Fibonacci levels, creating a tunnel where it is possible to see the price respecting some levels.
It is similar the concept of Vegas Tunnel, but with my numbers.
The Base EMA is 26 for daily charts and 8 for Weekly charts. The smaller timeframes use a variation of 26, like 26*4 for 4h charts.
It is also possible to choose if you want to color candle bars and what levels of Fibo lines you want to see. I created that to have a clean chart.
*** To enable the colored candles, you should choose the visual order and move to top!
Please leave a comment if you liked and if you have any suggestion.
Sentiment Estimator [AstrideUnicorn]Sentiment Estimator is an indicator that estimates market sentiment using only its pricing data. It counts bullish and bearish candles in a rolling window and calculates their relative values as percentages of the total amount of candles in the window. Market sentiment shows the direction in which the market is biased to move or the current trend direction. Extreme values of the market sentiment are contrarian signals. When the market sentiment is too bullish, it is time to sell and vice versa.
HOW TO USE
Sentiment Estimator plots a pair of green and red circles for each candle. They represent bullish and bearish sentiments, respectively.
The vertical positions of the circles show corresponding sentiment values in percentage units. For example, if a green circle's height is 60, the market is 60% bullish. In this case, the red circle's height will be 40, as bullish and bearish parts of the market sentiment sum to 100%.
The blue line plotted at the 50% level shows the neutral sentiment level. If a green circle is above the blue line, the prevailing market sentiment at that time is bullish, and the market is biased to move up. If a red one is above, the market has predominantly bearish sentiment and is prone to move down.
The red level shows extreme sentiment level. If a green or red circle is above this line, it means that the market is extremely bullish or bearish, respectively. It is a contrarian signal, and one can expect a reversal soon. In this case, a blue label with the text "reversal expected" is shown.
SETTINGS
Timeframe - allows choosing a timeframe other than the chart's one for the indicator calculation.
Look-Back Window - sets the historical window length used to perform the calculations. You can adjust the window to get the best results for a particular market or timeframe.

MMRI+MASimple script based on Gregory Mannarino's Risk indicator using the DXY and US10Y. Use it as you would an RSI but more of a leading indicator.

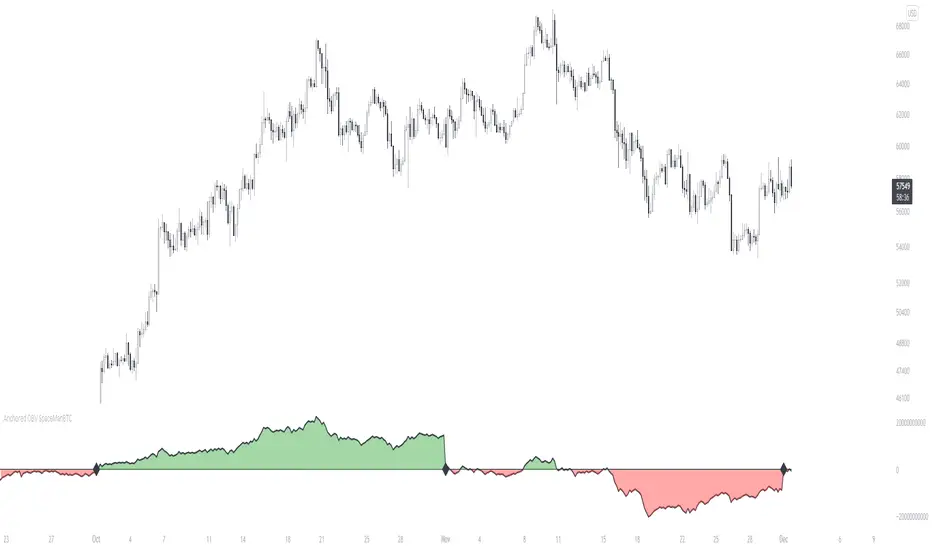
Anchored OBV SpaceManBTC Anchored OBV SpaceManBTC
The On Balance Volume indicator (OBV) is used in technical analysis to measure buying and selling pressure.
On Balance volume is primarily used to confirm or identify overall price trends or to anticipate price movements after divergences.
Anchored On Balance Volume unlike traditional OBV resets on your specified sessions: D, W, M, 3M, 4M, 6M, 1Y.
The actionable data is more useful HTF to see a potential long term trend change relative to the session reset chosen.
User can choose to disable highlightable session reset.
Recommended settings:
Daily tf with 3Month session pretty useful for the run so far. But please experiment away and share your results!
ToDo:
Non Reset Functionality,
Perhaps more timeframes
Support Resistance InteractiveHello All,
Using this "Support Resistance Interactive" script you can set the Support/Resistance levels interactively by clicking on the chart. Using the SR levels you set, the indicator creates Support Resistance zones. The width of the zones are calculated by using Threshold option and Threshold is the percent of the distance between Highest/Lowest levels in last 300 bars. if you set Threshold = 1 then it means 1% of the distance between Highest/Lowest levels. You can change SR levels by moving the level up/down by using your mouse anytime you want.
Now lets see it step by step;
After you added the indicator it will ask 5 Support/Resistance Levels and when you click any point then it's kept as S/R level and it asks another SR levels. if you want to use only 3 SR levels then last 2 SR levels are not important and you can click anywhere on the chart;
After you set all SR levels, it will ask "Number of Support/Resistance" . if you want to activate first 3 SR lines then set it 3. by default it's 5. when you set it click "Apply" and see the SR zones. that's it.
You can enable/disable alerts and set frequency, then create alerts. as it's interactive tool, the SR levels you set are specific for the current/active symbol. if you open another symbol then you better delete the indicator and add it again
Three Alerts exist in the script: Support Broken, Resistance Broken and Price in SR zone . you can enable/disable the alerts as you wish and you can set frequency for each one as "Once Per Bar" or "Once Per Bar Close"
by default Green/Red/Gray colors are used but You can change the colors using the options. according to the Price moves, SR zone colors are changed automatically.
when we have "Reset" feature to run the script interactively (like we added it for first time) I can update the script, then you will not need to delete/re-add each time you changed the symbol :)
In this example "Threshold" is 2 and "Number of Support/Resistance" is 4.
in this example "Threshold" is 0 and "Number of Support/Resistance" is 5.
Last example; Labels are shown for each zone, you can set location of the labels. SR order and Upper/lower band of each zone are shown in each label.
Enjoy!

Market Traffic Light (redesigned)redesigned the market traffic light from funcharts, all honor to him, I just put a new design ;-) and some bugfixes
1. Section (Fear & Greed)
Approximation of the CNN Money Fear & Greed index based on code of user MagicEins. The index shows values between 0 (extreme fear, red) and 100 (extreme greed, green).
2. Section (warning signs)
VIX: Values above 20 are red and below green. The legend shows the value of the current bar including the change from the bar before. The average VIX is about 16. Values over 20 are a sign of stressed market.
Distribution days: A distribution day (loss to the day before > 0,2 % and higher volume ) is marked with a yellow dot. In case there are more than four distributions days within 25 markets days the dot is orange. When big players redistribute their investments distribution days can occur. If this is done often (more than four times within 25 market days) it is possible that the markets changes or that a sector rotation occurs. For calculation distribution days futures of S&P 500 ( ES1! ) and NASDAQ ( NQ1! ) are used because the volume for this calculation is needed. TradingView does not support volumes for S&P 500 or NASDAQ directly.
Markets: A green/red dot signals that the market is above/below its 25-Daily-EMA. A green/red square signals that the market is above/below its 25-Weekly-EMA. Markets can give as a feeling about where investors store their money. E.g. when markets are falling but DUX (Down Jones Utility Average) is rising this means that investors put their money into save haven. This can be a sign that the markets will fall more.
3. Section (panic signs, = signs of reaching a low within a correction of a crash)
VIX-Reversion: A VIX reversion day ( VIX > 20 & VIX high > VIX high of the day before & VIX high – VIX close > 3) is marked as a yellow dot
VVIX: A value equal or above 140 is marked with a yellow dot and shows absolute panic.
PCR Intra max: A value equal or above 1.4 is marked with a yellow dot.
New high/lows: New highs/lows are shown for AMEX, NYSE and NASDAQ. A yellow dot is shown if the ratio is less or equal than 0. 01 .
Down-Day: Down days are shown for AMEX, NYSE and NASDA. A yellow dot is shown if at least 90 % of the whole volume (up and down) is a down volume .
In Addition to the warning signs in the second section a check of the Advance Decline Line (NYSE and NASDAQ) for bullish and bearish divergences is useful. The whole set-up can be seen in the screenshot.
Only one signal normally does not give us a good prediction. Therefore we need to see these indication as a bundle. TradingView gives us the opportunity to check some striking market situations in the past. So feel free to test this indication for building up your own opinion.
Please feel free to comment in case of failures, improvements or experiences (good or bad).
