Multi Ranges Volume Distribution [LuxAlgo]The Multi Ranges Volume Distribution tool allows traders to see the volume distribution by price for three different timeframes simultaneously. Each distribution can report the total amount of accumulated volume or the accumulated buy/sell volume separately.
Levels are displayed at the top and bottom of each timeframe's range, as well as the POC or level with the most volume.
🔶 USAGE
By default, the tool displays daily, weekly, and monthly volume distributions, highlighting the accumulated volume within each row.
Each distribution shows the volume at each price, as well as three lines: the top and bottom prices, and the price at which the most volume was traded.
The reported accumulated volume can be useful for highlighting which price areas are of the most interest to traders, with the specific timeframe specifying whether this interest is long-term or short-term.
🔹 Timeframes & Rows
Traders can adjust the timeframe and the number of rows for each volume distribution.
This is useful for multi-timeframe analysis of volume at the same price levels, or for obtaining detailed data within the same timeframe.
The chart above shows three volume distributions with the same monthly timeframe but a different number of rows; each is more detailed than the previous one.
🔹 Total vs Buy & Sell Volume
Traders can choose to display either the total volume or the buy and sell volumes.
As we can see on the above chart, the background of each row uses a gradient that is a function of the delta between the buy and sell volumes.
This is useful to determine which areas attract buyers and sellers.
🔶 SETTINGS
Volume Display: Select between total volume and buy and sell volume.
Distance between each box: Adjust the spacing of the volume distributions.
Period A: Select a timeframe and the number of rows.
Period B: Select a timeframe and the number of rows.
Period C: Select a timeframe and the number of rows.
Multitimeframe

Reversal IndicatorWhat does this indicator do?
This indicator is designed to help traders spot potential reversal points in the market by combining multiple conditions:
✅ Multi-Timeframe RSI – Checks RSI on a lower timeframe (like 5m) to see if the market is oversold or overbought.
✅ Higher Timeframe SMA Filter – Uses a higher timeframe SMA (like 1h) as a trend filter, so signals only trigger in the direction of the bigger trend.
✅ Candle Pattern Confirmation – Looks for bullish or bearish engulfing candles to confirm price exhaustion before signaling a reversal.
When all these conditions align, the indicator plots a triangle under/above the candle to highlight a possible reversal.
Why is this useful?
Many traders struggle with false RSI signals or candle patterns that fail because they don’t respect the larger trend.
This indicator filters out weak setups by requiring alignment between:
A lower timeframe RSI oversold/overbought condition,
A higher timeframe trend filter (SMA),
And a strong candle reversal pattern.
This multi-layer approach helps avoid chasing every RSI dip and focuses only on high-probability reversal zones.
How does it work?
Bullish reversal signal → appears when RSI on the lower TF is oversold, price is still above the higher TF SMA (trend still intact), AND a bullish engulfing candle forms.
Bearish reversal signal → appears when RSI on the lower TF is overbought, price is below the higher TF SMA, AND a bearish engulfing candle forms.
When all conditions match, the indicator plots a triangle under the candle for bullish signals and above the candle for bearish signals.
How to use it?
Choose your timeframes:
A timeframe for trend filtering (e.g. 1h).
A timeframe for RSI (e.g. 4h).
NOTICE: THE RSI TIMEFRAME SHOULD BE GREATER THEN THE TIMEFRAME FOR THE SMA
Otherwise it will not generate that much signals.
Watch for signals ONLY in the direction of the higher trend.
Use the signals as potential reversal points, not as guaranteed entries. Combine with your own confluence.
Optionally set alerts for bullish or bearish reversal conditions so you never miss a setup.
Customization
✅ Choose your RSI length & overbought/oversold levels.
✅ Select which timeframes you want for SMA & RSI.
✅ Toggle the higher TF SMA display on/off.
✅ Adjust signal appearance (triangles).
Important Notes
⚠️ This is not a standalone trading system. It’s a tool to help spot possible reversal areas. Always confirm with price action, support/resistance, or your own strategy

Essa - Market Structure & Fibonacci ToolkitOverview
The Essa Market Structure & Fibonacci Toolkit is a comprehensive trading indicator that combines advanced market structure analysis with customizable fibonacci levels and fair value gap detection. It identifies high-probability trading opportunities by detecting confluence zones where multiple technical factors align, providing traders with precise entry and exit points based on institutional trading concepts.
Key Features
📊Market Structure Analysis
Pattern Recognition: Automatically detects Higher Highs (HH), Higher Lows (HL), Lower Highs (LH), Lower Lows (LL)
Change of Character (CHoCH): Identifies trend changes and market structure breaks
Pattern Locking: Fibonacci levels lock to specific swing patterns (LH→LL for bearish, HL→HH for bullish)
Multi-Timeframe Analysis: Analyzes trend strength across multiple timeframes with scoring system
🧮 Custom Fibonacci System
Fully Configurable Levels: Set any percentage (e.g., 25%, 65%, 87.5%) - not limited to traditional levels
Dynamic Labels: Shows your actual percentages, not hardcoded values
Golden Zone Trading: Customizable optimal entry zones between any two fibonacci levels
Auto-Extension: Levels automatically extend as price moves
Distance Tables: Real-time pip distances to nearest fibonacci levels
📈 Fair Value Gap (FVG) Detection
Smart Detection: Identifies bullish and bearish fair value gaps with size filtering
Age Tracking: Shows how long each FVG has been active (bars or time format)
Confluence Highlighting: Enhanced colors when FVGs overlap with fibonacci golden zones
Width Filtering: ATR-based minimum width requirements to filter noise
🎯 Confluence Trading
Multi-Factor Analysis: Combines market structure + fibonacci + FVGs + golden zones
High-Probability Zones: Highlights areas where multiple factors converge
Trend Strength Scoring: 0-100% scoring system based on multiple confluence factors
Smart Alerts: Notifications for high-confluence setups only
⚡ Advanced Features
Trend Analysis Table: Real-time trend bias, strength score, and pattern identification
Adaptive Sensitivity: Automatically adjusts to market volatility using ATR
Professional Alerts: Customizable alerts for structure breaks, golden zone touches, and FVG confluence
Clean Interface: Basic/Advanced settings organization with inline controls
🎨 Visual Excellence
Professional Styling: Clean, institutional-grade visual presentation
Customizable Colors: Full color customization for all elements
Smart Labeling: Context-aware labels that don't overlap
Performance Optimized: Efficient rendering with visual element limits
Perfect for: Swing traders, day traders, and institutional-style traders who want to identify high-probability setups using confluence of market structure, fibonacci levels, and fair value gaps.

Ramya's indicatorbuy sell signal based on macd, rsi ,bb, when signal get buy at at the high of the candel

CQ_MTF Target Price Lines [BITCOIN HOY]Comprehensive Indicator Script Overview
Intraday, Four Hour, Daily, and Weekly Price Target Lines—A Versatile Tool for Traders
Welcome to a powerful and flexible indicator script designed to enhance your trading experience across multiple timeframes. This script empowers users to interactively set, visualize, and manage price targets, entries, and objectives for both short-term and long-term trading strategies. Whether you are a day trader seeking to mark crucial intraday levels or a long-term investor planning strategic entries, this tool offers an all-encompassing solution.
Key Features
• Multi-Time Frame Price Target Lines: Effortlessly input and display calculated price targets for Intraday, Four Hour, Daily, and Weekly periods, ensuring you always have a clear view of the market objectives at every scale.
• X-Axis Price Control: Set precise x-axis price points for each timeframe, granting you granular control over how and where your target lines appear on the chart.
• Weekly Price Objectives: Enter your calculated price objectives for the current week to remain aligned with your trading plan and adapt to evolving market conditions.
• Long-Term Investment Entry Events: Document and display significant entry events for long-term investments, helping you maintain a strategic perspective while navigating short-term fluctuations.
• Long-Term Price Objectives: Input and track price objectives for your long-term trades, supporting your investment decisions with clearly visualized milestones.
• Customizable Labels and Lines: Each price target is accompanied by clearly labeled lines, making it easy to distinguish between timeframes and targets at a glance.
Optional Price Gauge for Intraday Dynamics
For users who wish to monitor real-time market sentiment, the script includes an optional price gauge. This dynamic feature tracks intraday price movement, providing visual cues to quickly assess whether the prevailing tendency is bullish or bearish. The intuitive gauge aids in confirming your intraday strategies or alerting you to potential reversals.
User Experience and Customization
• Interactive Inputs: All key parameters—price targets, x-axis prices, entry events, and objectives—are entered manually by the user. This approach ensures the script adapts to your personal analysis and trading methodology.
• Easy Visualization: The clear display of lines, labels, and the optional gauge streamlines your chart, making it easier to make informed decisions at a glance.
• Flexible Application: Whether you’re trading short-term swings or building positions for the long haul, the indicator integrates seamlessly into your workflow.
How to Use
• Input your calculated price targets for each timeframe (Intraday, Four Hour, Daily, and Weekly).
• Specify the exact x-axis price points where you’d like the lines to appear for each timeframe.
• For the current week, enter your weekly price objectives for quick reference and planning.
• If you’re a long-term investor, document your key entry events and set long-term price objectives to track their progression.
• To monitor current market momentum, activate the price gauge and follow the visual cues for bullish or bearish trends.
Benefits
• Comprehensive Market Overview: Simultaneously track multiple timeframes and objectives, keeping all critical information at your fingertips.
• Improved Decision Making: Visual clarity and strategic labeling support faster, more confident trading decisions.
• Customizable and Adaptable: Tailor the script to your unique trading style and analytical approach.
Enjoy using the indicator, and happy trading! Let this versatile tool be your companion in navigating the ever-changing tides of the market.

VWAP with Prev. Session BandsVWAP with Prev. Session Bands is an advanced indicator based on TradingView’s original VWAP. It adds configurable standard deviation or percentage-based bands, both for the current and previous session. You can anchor the VWAP to various timeframes or events (like Sessions, Weeks, Months, Earnings, etc.) and selectively show up to three bands.
The unique feature of this script is the ability to display the VWAP and bands from the previous session, helping traders visualize mean reversion levels or historical volatility ranges.
Built on top of the official TradingView VWAP implementation, this version provides enhanced flexibility and visual clarity for intraday and swing traders alike.

SMI Panel (kolupaiev)Stochastic Momentum + table trand + alerts
The indicator is composed of STOCHASTIC and MOMENTUM.
A table for tracking the trend on higher timeframes (1D and 1W) has also been added.
Notifications can be configured to follow the trend.

Multi-Equity Performance TableThis indicator tracks 5 equities/stocks/crytpo across multiple timeframes: 24h, 1W, 1M, 3M, 6M, 1Y. You can use AI to modify the code to track more equities but then you will need to use less timeframes. I used Claude.ai to configure this code.

Aggressive RSI + EMA Strategy with TP/SLWhat This Strategy Does 🔥
📉 It monitors RSI to find when the market is potentially oversold (RSI < 40) or overbought (RSI > 60).
📈 It checks the trend direction using two EMAs — fast EMA (short-term) and slow EMA (long-term).
✅ It only buys when the market looks oversold and the short-term trend is up (fast EMA > slow EMA).
❌ It only sells when the market looks overbought and the short-term trend is down (fast EMA < slow EMA).
💰 Once in a trade, it sets a take profit at 1% gain and a stop loss at 0.5% loss — so profits are locked and risks controlled.
🔄 This cycle repeats continuously, aiming to catch many small, quick moves rather than waiting for big swings.
🚀 The aggressive RSI thresholds mean it triggers trades more often — ideal for active traders who want lots of setups.
📊 It shows clear visual indicators and plots on the chart so you can easily see entries, exits, and indicator levels.
🔔 It also supports alerts, so you can get notified instantly when a trade setup happens.
In short, it’s a fast, trend-aware momentum strategy with built-in risk control designed for active trading and consistent small wins.

TMA Lock - Triple Moving Averages with Timeframe ControlKeep your 50, 100, and 200-day moving averages consistent across all chart timeframes! No more recalculating MAs when switching from daily to hourly charts.
Key Features:
Timeframe Lock - MAs stay true to your selected timeframe (daily, weekly, etc.) regardless of chart view
Fully Customizable - Adjust periods, colors, line styles, and smoothing strength

MTF Trend Table - Manual InputMTF Trend Table - Manual Input
Description:
This indicator displays a simple and clear multi-timeframe (MTF) trend table in the upper right corner of your chart. You can manually set the current trend direction (Up, Down, or Neutral) for each timeframe: Monthly, Weekly, Daily, 4h, 1h, and 15min. The table shows the status of each timeframe with colored backgrounds—green for Up, red for Down, and gray for Neutral—making it easy to monitor trend alignment across different timeframes at a glance.
Features:
Manual selection of trend direction for each timeframe.
Color-coded status: green (Up), red (Down), gray (Neutral).
Quickly visualize trend alignment across Monthly, Weekly, Daily, 4h, 1h, and 15min.
Table is positioned in the top right corner of the chart for easy reference.
How to use:
Open the indicator settings and select the trend direction for each timeframe based on your own analysis. Use this tool as a visual aid to track and confirm trend bias in your trading system.

Info TableOverview
The Info Table V1 is a versatile TradingView indicator tailored for intraday futures traders, particularly those focusing on MESM2 (Micro E-mini S&P 500 futures) on 1-minute charts. It presents essential market insights through two customizable tables: the Main Table for predictive and macro metrics, and the New Metrics Table for momentum and volatility indicators. Designed for high-activity sessions like 9:30 AM–11:00 AM CDT, this tool helps traders assess price alignment, sentiment, and risk in real-time. Metrics update dynamically (except weekly COT data), with optional alerts for key conditions like volatility spikes or momentum shifts.
This indicator builds on foundational concepts like linear regression for predictions and adapts open-source elements for enhanced functionality. Gradient code is adapted from TradingView's Color Library. QQE logic is adapted from LuxAlgo's QQE Weighted Oscillator, licensed under CC BY-NC-SA 4.0. The script is released under the Mozilla Public License 2.0.
Key Features
Two Customizable Tables: Positioned independently (e.g., top-right for Main, bottom-right for New Metrics) with toggle options to show/hide for a clutter-free chart.
Gradient Coloring: User-defined high/low colors (default green/red) for quick visual interpretation of extremes, such as overbought/oversold or high volatility.
Arrows for Directional Bias: In the New Metrics Table, up (↑) or down (↓) arrows appear in value cells based on metric thresholds (top/bottom 25% of range), indicating bullish/high or bearish/low conditions.
Consensus Highlighting: The New Metrics Table's title cells ("Metric" and "Value") turn green if all arrows are ↑ (strong bullish consensus), red if all are ↓ (strong bearish consensus), or gray otherwise.
Predicted Price Plot: Optional line (default blue) overlaying the ML-predicted price for visual comparison with actual price action.
Alerts: Notifications for high/low Frahm Volatility (≥8 or ≤3) and QQE Bias crosses (bullish/bearish momentum shifts).
Main Table Metrics
This table focuses on predictive, positional, and macro insights:
ML-Predicted Price: A linear regression forecast using normalized price, volume, and RSI over a customizable lookback (default 500 bars). Gradient scales from low (red) to high (green) relative to the current price ± threshold (default 100 points).
Deviation %: Percentage difference between current price and predicted price. Gradient highlights extremes (±0.5% default threshold), signaling potential overextensions.
VWAP Deviation %: Percentage difference from Volume Weighted Average Price (VWAP). Gradient indicates if price is above (green) or below (red) fair value (±0.5% default).
FRED UNRATE % Change: Percentage change in U.S. unemployment rate (via FRED data). Cell turns red for increases (economic weakness), green for decreases (strength), gray if zero or disabled.
Open Interest: Total open MESM2 futures contracts. Gradient scales from low (red) to high (green) up to a hardcoded 300,000 threshold, reflecting market participation.
COT Commercial Long/Short: Weekly Commitment of Traders data for commercial positions. Long cell green if longs > shorts (bullish institutional sentiment); Short cell red if shorts > longs (bearish); gray otherwise.
New Metrics Table Metrics
This table emphasizes technical momentum and volatility, with arrows for quick bias assessment:
QQE Bias: Smoothed RSI vs. trailing stop (default length 14, factor 4.236, smooth 5). Green for bullish (RSI > stop, ↑ arrow), red for bearish (RSI < stop, ↓ arrow), gray for neutral.
RSI: Relative Strength Index (default period 14). Gradient from oversold (red, <30 + threshold offset, ↓ arrow if ≤40) to overbought (green, >70 - offset, ↑ arrow if ≥60).
ATR Volatility: Score (1–20) based on Average True Range (default period 14, lookback 50). High scores (green, ↑ if ≥15) signal swings; low (red, ↓ if ≤5) indicate calm.
ADX Trend: Average Directional Index (default period 14). Gradient from weak (red, ↓ if ≤0.25×25 threshold) to strong trends (green, ↑ if ≥0.75×25).
Volume Momentum: Score (1–20) comparing current to historical volume (lookback 50). High (green, ↑ if ≥15) suggests pressure; low (red, ↓ if ≤5) implies weakness.
Frahm Volatility: Score (1–20) from true range over a window (default 24 hours, multiplier 9). Dynamic gradient (green/red/yellow); ↑ if ≥7.5, ↓ if ≤2.5.
Frahm Avg Candle (Ticks): Average candle size in ticks over the window. Blue gradient (or dynamic green/red/yellow); ↑ if ≥0.75 percentile, ↓ if ≤0.25.
Arrows trigger on metric-specific logic (e.g., RSI ≥60 for ↑), providing directional cues without strict color ties.
Customization Options
Adapt the indicator to your strategy:
ML Inputs: Lookback (10–5000 bars) and RSI period (2+) for prediction sensitivity—shorter for volatility, longer for trends.
Timeframes: Individual per metric (e.g., 1H for QQE Bias to match higher frames; blank for chart timeframe).
Thresholds: Adjust gradients and arrows (e.g., Deviation 0.1–5%, ADX 0–100, RSI overbought/oversold).
QQE Settings: Length, factor, and smooth for fine-tuned momentum.
Data Toggles: Enable/disable FRED, Open Interest, COT for focus (e.g., disable macro for pure intraday).
Frahm Options: Window hours (1+), scale multiplier (1–10), dynamic colors for avg candle.
Plot/Table: Line color, positions, gradients, and visibility.
Ideal Use Case
Perfect for MESM2 scalpers and trend traders. Use the Main Table for entry confirmation via predicted deviations and institutional positioning. Leverage the New Metrics Table arrows for short-term signals—enter bullish on green consensus (all ↑), avoid chop on low volatility. Set alerts to catch shifts without constant monitoring.
Why It's Valuable
Info Table V1 consolidates diverse metrics into actionable visuals, answering critical questions: Is price mispriced? Is momentum aligning? Is volatility manageable? With real-time updates, consensus highlights, and extensive customization, it enhances precision in fast markets, reducing guesswork for confident trades.
Note: Optimized for futures; some metrics (OI, COT) unavailable on non-futures symbols. Test on demo accounts. No financial advice—use at your own risk.
The provided script reuses open-source elements from TradingView's Color Library and LuxAlgo's QQE Weighted Oscillator, as noted in the script comments and description. Credits are appropriately given in both the description and code comments, satisfying the requirement for attribution.
Regarding significant improvements and proportion:
The QQE logic comprises approximately 15 lines of code in a script exceeding 400 lines, representing a small proportion (<5%).
Adaptations include integration with multi-timeframe support via request.security, user-customizable inputs for length, factor, and smooth, and application within a broader table-based indicator for momentum bias display (with color gradients, arrows, and alerts). This extends the original QQE beyond standalone oscillator use, incorporating it as one of seven metrics in the New Metrics Table for confluence analysis (e.g., consensus highlighting when all metrics align). These are functional enhancements, not mere stylistic or variable changes.
The Color Library usage is via official import (import TradingView/Color/1 as Color), leveraging built-in gradient functions without copying code, and applied to enhance visual interpretation across multiple metrics.
The script complies with the rules: reused code is minimal, significantly improved through integration and expansion, and properly credited. It qualifies for open-source publication under the Mozilla Public License 2.0, as stated.

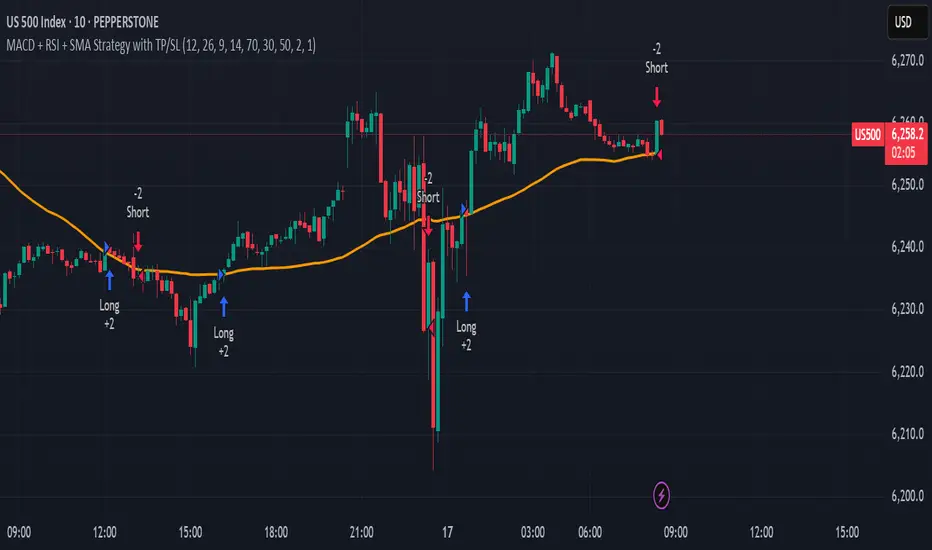
MACD + RSI + SMA Strategy with TP/SLThis strategy combines three technical indicators: MACD, RSI, and Simple Moving Average (SMA) to identify high-probability entry points. It enters trades in the direction of the trend (filtered by SMA), confirms momentum shifts (via MACD crossover), and validates signals with RSI to avoid overbought/oversold conditions.
Key Features:
Directional filter using SMA to align trades with the broader trend.
Momentum validation with MACD crossovers.
Risk control through RSI thresholds and fixed percentage-based Take Profit and Stop Loss levels.
Works for both long and short positions.
Disclaimer: This is a sample strategy for educational purposes only.
Trading involves risk. Use at your own discretion.
You bear full responsibility for any profit or loss.
RSI Weekly and MonthlyTHis script plots RSI (Relative Strength Index) values for daily, weekly, and monthly timeframes, with an added 10-period SMA (Simple Moving Average) applied to the weekly RSI. It’s a compact multi-timeframe indicator to analyze price momentum across various horizons.

1H & 2H Candle Panel + Daily Grid v1.2Indicator: "1H & 2H Candle Panel + Daily Grid v1.2"
This powerful indicator combines two key features into one tool:
Daily Grid anchored to the previous day’s close
Multi-Timeframe Candle Panel for comprehensive market analysis
1. Daily Grid Logic
Input:
Grid Distance (Points): Adjustable spacing between grid lines (default: 5.0 pts).
How It Works:
Detects the start of a new trading day using ta.change(time("D")).
Fetches the prior day’s close via request.security().
Draws the following elements at each new session:
Thick Red Line: Previous day’s closing price (key reference level).
8-Point Grid:
4 blue lines above the close (+1x to +4x the grid distance).
4 gold lines below the close (-1x to -4x the grid distance).
Info Label: Displays the exact prior close value.
Automatically clears and redraws all elements daily to avoid clutter.
2. Multi-Timeframe Candle Panel
Timeframes Analyzed:
Current chart TF, 30M, 1H, 2H, 3H, 4H, 6H, 12H, and Daily (1D).
Data Displayed per TF:
Open, Close, High, Low
Price Difference (Close − Open)
Candle Type (Bullish/Bearish)
Time remaining until candle close (hh:mm:ss format)
Visual Output:
A right-aligned table with conditional coloring:
Bullish candles: Green background
Bearish candles: Red background
Current timeframe highlighted in purple.
Optimized Updates:
Uses request.security() for efficient cross-TF data fetching.
Tracks candle closing times via TradingView’s native time_close.
Updates only on the last bar or in real-time (barstate.islast/isrealtime).
3. Confluence Signals
Full Confluence:
Triggers when all timeframes align:
Buy Signal: All candles bullish → Green arrow + alert.
Sell Signal: All candles bearish → Red arrow + alert.
1H Special Confluence:
Activates 30 minutes after the 1H candle opens.
Requires alignment between 1H, 4H, and 6H candles.
Marks entries with price-level arrows (no alerts).
4. Technical Optimizations
Performance:
Dynamically manages graphic objects (no redundant redrawing).
Uses arrays to track grid lines efficiently.
Precision:
Leverages TradingView’s time_close for accurate countdowns.
Formats prices with format.mintick for asset-specific precision.
How to Use
Adjust Grid Distance based on asset volatility.
Monitor the panel for multi-TF trend strength.
Use the daily grid as support/resistance reference.
Confluence signals highlight high-probability setups.
Pro Tip: Combine with volume analysis or RSI for confirmation!

Dashboard EMA Unifié [touli]DISCLAIMER
This indicator is provided for educational and informational purposes only. It does not constitute investment advice, a recommendation to buy or sell, or a solicitation for any transaction. Past performance is not indicative of future results. Trading involves significant risk, including the potential loss of capital. The user assumes full responsibility for their own trading decisions and risk management. The author of this script cannot be held liable for any losses or damages resulting from its use.
Indicator Title: Unified EMA Dashboard
Overview
This indicator is a comprehensive technical analysis tool that combines the display of Exponential Moving Averages (EMAs) on the chart with a multi-timeframe dashboard. It is designed to provide traders with a quick and clear overview of the trend across multiple timeframes, while also providing visual cues directly on the current chart.
Key Features
Multi-Timeframe Dashboard: Displays a clean and concise table showing the price's position relative to four different EMAs (9, 21, 50, 200) across 6 timeframes (from 1 minute to 1 day).
A blue arrow ▲ indicates that the closing price is above the EMA (potential bullish trend).
A red arrow ▼ indicates that the closing price is below the EMA (potential bearish trend).
Display of 4 EMAs on the Chart:
EMA 9 & 21: Plotted on the current timeframe, they help identify the very short-term trend.
EMA 50 (from the 5m TF) & EMA 200 (from the 15m TF): Plotted on the current chart but calculated on higher timeframes. They offer a perspective on the stronger, underlying trends.
Full Customization: The indicator's settings allow the user to:
Modify the periods of the four EMAs.
Choose the dashboard's position on the screen.
Change the dashboard's theme (Dark or Light).
Enable or disable the display of the EMAs on the chart.
Optimized Code: The script is designed for performance, drawing and calculating the dashboard only on the last available price bar, thus avoiding chart lag.
How to Use
1. Installation
On TradingView, open the chart of your chosen asset.
At the bottom of the screen, click on the "Pine Editor" tab.
Copy the entire corrected script and paste it into the editor, replacing any existing content.
Click the "Add to Chart" button. The indicator will then appear on your chart.
2. Configuration
Click the gear icon (⚙️) next to the indicator's name to access its settings.
General Settings:
Dashboard Theme: Choose "Dark" or "Light" for better readability depending on your chart's color scheme.
Dashboard Position: Select where you want the dashboard to appear (e.g., "Bottom Right," "Top Left," etc.).
EMA Settings:
Modify the periods (9, 21, 50, 200) if you prefer to use other values for your analysis.
Chart Display Settings:
Check or uncheck the boxes to show or hide the EMA lines on your main chart. For instance, you can disable the lines and only use the dashboard.
3. Interpretation (For Informational Purposes)
The Dashboard:
Confluence Analysis: The dashboard's main strength is identifying trend "confluence." A column that is entirely blue (▲) or red (▼) suggests a strong, aligned trend across multiple time scales.
Identifying Reversal Points: If the shorter timeframes (1m, 5m) start to change color while the longer ones (4h, 1D) remain stable, this may indicate a pullback or the beginning of a trend change.
The EMAs on the Chart:
Dynamic Support and Resistance: The EMA lines can act as areas of support in an uptrend and resistance in a downtrend.
Underlying Trend: The price's position relative to the longer-period EMAs (50 and 200) gives an indication of the general underlying trend.
Best Practices and Limitations
Do Not Use in Isolation: This indicator is a trend confirmation tool. It is recommended to use it in conjunction with other analysis tools (volume, market structure, other indicators).
Lagging Indicator: Moving averages are trend-following indicators, which means they react to past price movements. They do not predict future movements.
Risk Management: Always set a stop-loss and take-profit for every trade. Never risk more than a small percentage of your capital on a single position.

QQE MODADDED QQE WEIGHTED OSCILLATOR to the QQE MOD indicator. The oscillator has a fast line that crosses the slow line. As the fast crosses above the slow line this is a long situation and vice versa for a short situation. The weighted Oscillator is a deriviation by LuxAlgo. The QQE mod portion was published by Colinmck

QQE + Signals RNEdited this to do away with larged signals of long and short to small triangles labeld only with QQE text

Super Estrategia Integrada con Flechas//@version=5
indicator("Super Estrategia Integrada con Flechas", overlay=true)
// === INPUTS ===
rsiLength = input.int(14, title="RSI Length")
rsiOverbought = input.int(70, title="RSI Overbought")
rsiOversold = input.int(30, title="RSI Oversold")
macdShort = input.int(12, title="MACD Short Period")
macdLong = input.int(26, title="MACD Long Period")
macdSignal = input.int(9, title="MACD Signal Period")
bbLength = input.int(20, title="BB Length")
bbMult = input.float(2.0, title="BB Multiplier")
smaLength = input.int(50, title="Deviation Trend SMA Length")
stdDev1 = input.float(1.0, title="Standard Deviation 1")
distThresholdFactor = input.float(0.2, title="Threshold as % ATR for Deviation Contact")
// === INDICADORES BASE ===
rsi = ta.rsi(close, rsiLength)
= ta.macd(close, macdShort, macdLong, macdSignal)
vwap = ta.vwap(close)
// === BOLLINGER BANDS ===
basisBB = ta.sma(close, bbLength)
devBB = bbMult * ta.stdev(close, bbLength)
upperBB = basisBB + devBB
lowerBB = basisBB - devBB
bbZonaBaja = close < basisBB
bbZonaAlta = close > basisBB
// === DEVIATION TREND PROFILE APPROX ===
basisSMA = ta.sma(close, smaLength)
stdDevSMA = ta.stdev(close, smaLength)
tendenciaAlcista = basisSMA > basisSMA
tendenciaBajista = basisSMA < basisSMA
distanciaSMA = math.abs(close - basisSMA)
threshold = ta.atr(14) * distThresholdFactor
cercaLinea = distanciaSMA <= threshold
// === PATRONES DE REVERSIÓN ===
isBullishEngulfing = close < open and close > open and close > open and open < close
isBearishEngulfing = close > open and close < open and close < open and open > close
isHammer = ta.lowest(low, 3) == low and (high - math.max(close, open)) > 2 * (math.min(close, open) - low)
isShootingStar = ta.highest(high, 3) == high and (math.min(close, open) - low) < (high - math.max(close, open)) / 2
isDoji = math.abs(close - open) <= (high - low) * 0.1
// === CONDICIONES ===
zonaExtremaAlta = rsi > rsiOverbought
zonaExtremaBaja = rsi < rsiOversold
macdAlcista = ta.crossover(macdLine, signalLine)
macdBajista = ta.crossunder(macdLine, signalLine)
precioDebajoVWAP = close < vwap
precioSobreVWAP = close > vwap
// === SEÑALES ===
buyPattern = zonaExtremaBaja and (isBullishEngulfing or isHammer or isDoji) and macdAlcista and precioDebajoVWAP and bbZonaBaja
sellPattern = zonaExtremaAlta and (isBearishEngulfing or isShootingStar or isDoji) and macdBajista and precioSobreVWAP and bbZonaAlta
buySignal = buyPattern or (tendenciaAlcista and cercaLinea)
sellSignal = sellPattern or (tendenciaBajista and cercaLinea)
// === PLOTS VISIBLES ===
plotshape(buySignal, style=shape.triangleup, location=location.belowbar, color=color.green, size=size.large, title="Flecha BUY")
plotshape(sellSignal, style=shape.triangledown, location=location.abovebar, color=color.red, size=size.large, title="Flecha SELL")
plot(vwap, color=color.orange, linewidth=1, title="VWAP")
plot(basisBB, color=color.blue, title="BB Basis")
plot(upperBB, color=color.blue, style=plot.style_linebr, linewidth=1, title="BB Upper")
plot(lowerBB, color=color.blue, style=plot.style_linebr, linewidth=1, title="BB Lower")
plot(basisSMA, color=color.gray, linewidth=1, title="Deviation Trend SMA")
bgcolor(tendenciaAlcista ? color.new(color.blue, 85) : tendenciaBajista ? color.new(color.red, 85) : na)
// === ALERTAS ===
alertcondition(buySignal, title="Alerta BUY", message="Señal de compra: patrón o condición Deviation Profile alcista")
alertcondition(sellSignal, title="Alerta SELL", message="Señal de venta: patrón o condición Deviation Profile bajista")

First 15 Min High/Low ExtendedThe script captures the highest high and lowest low during the first 15 minutes of the trading day (from 9:30 to 9:45) and then draws horizontal lines representing those levels across the rest of the day’s chart.

MTF MinichartsHello friends,
I'm excited to share another unique tool with you — the MTF Minicharts indicator. This script lets you display multiple mini candlestick charts directly on your main chart, using data from different tickers and timeframes at the same time. It's designed to give you a clear multi-timeframe, multi-asset perspective — all in one place.
There are no complicated setups: just select your tickers, pick your timeframes, and the minicharts are ready to go. You can even apply one timeframe to all tickers with a single switch — making your workflow simple and efficient.
🛠️ How It Works
The script pulls price data for up to six different tickers and timeframes and displays them as compact candle charts inside your main chart window. You can choose to set each minichart's timeframe individually, or apply one timeframe to all tickers instantly. Fully customizable layout options let you arrange your minicharts in flexible grids — from 1×1 up to 3×2 and beyond. A total of 13 grid layouts are available, so you can adapt the view exactly to your screen and style. Each minichart can display 2 to 21 candles , giving you just the right balance between detail and space. Candlestick styling, spacing, last price lines, and ticker labels are all adjustable, so you can fine-tune your view to your exact needs.
🔥 Key Features
Pine Script v6 — Uses the latest version for maximum performance
Multi-Timeframe, Multi-Ticker — Combine up to six charts, mixing tickers and timeframes as you wish
Single-Timeframe Mode — Apply one timeframe to all tickers with a single click
13 Grid Layouts — Choose from multiple layout options for clean positioning on your main chart
Custom Candles per Chart — Display anywhere from 2 to 21 candles in each minichart
Overlay or Subpanel Mode — Choose whether your minicharts overlay the price or sit in a subpanel
Custom Candles Styling — Adjust body width, wick width, and colors to match your style
Last Price Lines — Optional last price marker for each minichart, with style and width controls
Clear Ticker Labels — Show performance metrics in various formats
Optimized Performance — Efficient rendering for smooth operation, even with multiple charts
Universal Compatibility — Works flawlessly across all assets, timeframes, and market conditions
📸 Visual Examples
Subpanel mode with 1x6 layout
Combination of two instances gives you a mini screener
If you'd like access or have any questions, feel free to reach out to me directly via DM.
👋 Good luck and happy trading!

Break and Retest High Probability StrategyWhat does the script Do:
Script uses Break and Retest strategy on Key Levels like PMH, PDH, PMH, PML and ORB levels. Based on the strength of the candle at these key levels a position is taken and based on Dynamic stop loss, we scale out of the position at key levels. Scale out can also happen based on the QQQ trend.
How it does it:
First the script identifies No Trade Zone - which is higher of PMH and PDH for Highest position of No Trade Zone, and lower of PML and PDL. Any trades within this doesnt take any Trade entries.
Entries are taken in only Regular Trading Hours.
Candle strength is constantly tracked for break out these levels and then wait for retest levels based on Volatality on that day with ATR levels. If it fails to come back to retest - it is ignored else at retest levels strength of the bar is tracked. Scaling out can be done based on various Input parameters given in the strategy. VWAP and 9 EMA is also tracked for taking an entry or not.
How to use it:
Make sure to use various parameters within Inputs like Candle Strength at vwap, QQQ confluence to tweak and see what works best for the time frame and stock.
In the Multi Time frame construct - if you are on 5min time frame the candle stregth can be tracked in lower time frame which can be 1, 2, 3 min etc. This is also configurable within the Inputs.
Make sure to use the levels and values displayed in the table to see real time data.
Also, You can just have the Long entry, Short Entry and Plot variables selected in Style section to declutter the chart. Feel free to reuse the chart
what makes it original.
Strategy Parameters
• Is representative of real world trading conditions.
Break and Retest at key levels while following various confluence set ups makes it completely real world and battle tested indicator. All the parameters used within Inputs and Style are completely known Market variables.
• Is compatible with the markets their strategy is written for.
This is best for doing scalping where momentum and volatality is the king.
• Produces realistic results.
Like any strategy nothing is 100% guaranteed. But the key is to monitor the Profit factor and exit at right positions even if it means lesser number of trades.
This strategy is tested against lot of Tech stocks like nvidia, tesla, amazon against QQQ confluence.
. to help traders interpret the results they publish with their strategy,
Please feel free to tweak the parameters to tweak the strategy and see what works best for the stock you are placing this indicator on.
I primarily take the default parameters of this strategy to do scalping. The Multitime frame restest ( which goes to lower timeframe to check the strength of bars - which is again configurable by Fixed Retest bars and Retest Time Frame. I would recommend you to use Enable candle pattern filter to further refine the trades to be high probability.
This is a high probability set up - so please dont expect many trades from each stock. The strategy only gets triggered when it sees valid signal as per parameters set on the strategy.

Jitendra MTF AIO Technical Indicators with Trend ▲▼🔍 Indicator Summary:
Jitendra MTF AIO Technical Indicators with Trend ▲▼
This powerful multi-timeframe technical analysis dashboard is a comprehensive Pine Script indicator that displays Trend and Technical data across multiple timeframes (TFs) in a table format on the chart.
It includes trend direction arrows, divergences, EMA signals, MACD, RSI, ADX/DI, Stochastic, VWAP status, and a Volume Matrix — all customizable via toggles.
All Details Described in this Image for Better Input
drive.google.com
🧠 Notes:
Each of these logic blocks is computed per timeframe using request.security() like this:
val = request.security(syminfo.tickerid, tf, )
The table then displays the values, with color-coded backgrounds and trend arrows for visual ease.
Timeframes Supported: Current, 15m, 1h, 1D, 1W, 1M (customizable via inputs)
✅ Main Features & What Each Block Does
1. VWAP & EMA Plotting on Chart
VWAP Line: Central price level based on volume.
EMA Lines (3 configurable): Short/medium/long-term trend visualization with User Input Time Frame
Code:
plot(showVWAPLine ? vwapLine : na, ...)
2. Indicator Inputs and Toggles
Toggle ON/OFF various indicators:
RSI, MACD, Stochastic, ADX, DI+, DI-
EMA status, EMA cross detection, and divergence detection
Volume Matrix (Volume, 20 SMA Volume, % Change in Volume)
3. Multi-Timeframe Support
Supports up to 6 different timeframes (CurTF, 60, 240, D, W, M)
Each TF row shows selected indicator values and trend arrows.
4. Divergence Detection Logic
Uses pivot highs/lows on RSI to detect:
Regular Bullish/Bearish
Hidden Bullish/Bearish
Code:
detect_divergence(tf) => ...
5. MACD + Trend Arrow
Displays MACD line, histogram (optional), and trend direction (▲▼).
Arrow color: green (bullish), red (bearish).
= ta.macd(close, 12, 26, 9)
macdTrend = macdLine > macdLine ? "▲" : macdLine < macdLine ? "▼" : "-"
6. RSI + Trend Arrow
Shows RSI values with colored background (bullish/neutral/bearish zones).
Arrows show momentum direction vs previous value.
rsi = ta.rsi(close, 14)
rsiTrend = rsi > rsi ? "▲" : rsi < rsi ? "▼" : "-"
(default period: 14 bars)
Usage in script:
Calculated for each selected timeframe.
Color-coded:
🔴 < 40 = Weak, 🟢 40–60 = Neutral, 🔵 > 60 = Strong
7. ADX + DI + Arrows
ADX trend strength and DI+ / DI− signals with trend direction arrows.
= ta.dmi(14, 14)
adxTrend = adx > adx ? "▲" : adx < adx ? "▼" : "-"
Based on the smoothed differences between +DI and -DI over a period (default: 14).
Higher ADX = Stronger trend
Color-coded:
🔴 < 18 = Weak trend 🟢 18–25 = Moderate 🔵 > 25 = Strong
8. EMA Status + Cross
Indicates if price is above/below EMA 1/2/3 with color coding.
EMA1 vs EMA2 cross shown using arrow.
cross = ema1 > ema2 ? "▲" : ema1 < ema2 ? "▼" : "-"
9. Stochastic Oscillator
Displays %K value and color-coded background based on %K vs %D.
k = ta.sma(ta.stoch(close, high, low, kLen), smoothK)
d = ta.sma(k, smoothD)
stochColor = k > d ? color.green : k < d ? color.red : color.gray
10. Volume Matrix
Volume, 20 SMA Volume, and % volume change from SMA
Background color reflects strength (green/red).
vol = volume
volSMA = ta.sma(volume, 20)
volPct = volSMA > 0 ? (vol - volSMA) / volSMA * 100 : na
volColor = vol > volSMA ? color.green : vol < volSMA ? color.red : color.gray
11. Table System
Automatically resizes based on what’s enabled
Position and font size configurable
Header and data cells use color-coded backgrounds for quick scanning
Function fill_row() gathers and renders data per TF.
12. Helper Color Functions
Color-coded indicator levels:
RSI/ADX/DI: Color changes with value strength
VWAP/EMA/Volume: Show above/below or high/low with color cues
🧠 How It Works (Logic Behind the Code)
Request Security Calls: Retrieves each indicator’s value on different timeframes using request.security().
Arrows (▲▼): Based on comparison with previous values.
Coloring: Uses thresholds or comparisons to determine bullish/bearish/neutral coloring.
Arrays and Strings: Used to build flexible EMA status indicators.
Dynamic Table Generation: Adjusts rows and columns based on what is enabled in settings.
📈 Use Case:
Perfect for intraday or swing traders who want to track multiple indicators across several timeframes in a single glance, reducing the need to switch charts.
📋 Customization:
You can toggle ON/OFF each of the following:
Indicators (RSI, MACD, ADX, etc.)
Visuals (VWAP line, EMAs)
Volume components (Volume, Avg Vol, Vol %)
Timeframes and table layout
Enjoy Trading & Investing
