TXM-FVG-ALARM_4TFFVG Multi-Timeframe Indicator for TradingView
With this indicator, you get all the key Fair Value Gaps (FVGs) displayed at a glance for your current timeframe plus up to three additional timeframes of your choice.
Main Features
Current Timeframe Display
Always shows which chart timeframe you’re on, so you never lose track of your analysis level.
Multi-Timeframe FVG Detection
Current TF: Automatically identifies and marks all Fair Value Gaps on the active chart.
Up to 3 Extra TFs: Select up to three more periods (e.g. 1h, 4h, Daily) to view their FVGs simultaneously.
Flexible Visualization Options
Filled Box: Highlights FVG zones with solid rectangles.
Outline Only: Draws just the borders of each FVG for a cleaner look.
Combined Mode: Use both fill and outline to distinguish between different TFs or gap types.
Customizable Colors
Assign individual colors for each timeframe and for each visualization style (box and/or outline).
Save and load color presets to switch quickly between markets or strategies.
Alert Functionality
Set up alerts that trigger as soon as a new FVG appears in the current or any selected extra timeframe.
Choose between pop-ups, email alerts, or mobile push notifications.
Benefits at a Glance
Time Savings – Automatic detection and drawing of FVGs.
Clarity – See at once which timeframes have active gaps.
Personalization – Tailor colors and display modes to your workflow.
Responsiveness – Never miss a newly formed FVG thanks to real-time alerts.
Installation & Usage
Add the Indicator
In TradingView’s Public Library, search for “FVG Multi-TF Box & Frame.”
Configure Timeframes
In the indicator’s settings, pick your main TF plus up to three additional TFs.
Adjust Display
Toggle box fill, outline, or both, and set your colors for each TF.
Create Alerts
Go to the Alerts tab, select the indicator’s “New FVG Detected” condition, and choose your notification method.
Use the FVG Multi-Timeframe Indicator to enhance your chart analysis across all trading horizons—from quick scalping to longer-term swing strategies!
Multitimeframe

Session Dividers for Yr/Qtr/Month/Week/Day by EasycatorsThis indicator provides custom dividing lines between important periods like day/week/month/quarter/year that make it easy to distinguish a new day from a new week or month or year with thickness, style, and color.
There are several indicators in the library that attempt to do this but fail. I got tired of it so I decided to make one that looks good and just works.
Human markets are cyclical, following the rhythm of life, and so I like to see the cyclicality of market price action, to be able to compare the current period to the same period last week or last year. So making it easy to see when each period repeats is important.
So Easycators Dividers shows dividing lines between periods (day, week, month, quarter, year). As you move your chart up to higher timeframes, lines intuitively disappear so your screen stays uncluttered while still telling you what you need to know.
EZ_Dividers also allows displaying background colors for each period, either with or without lines, if so desired. You can have a custom background color for each day of the week (intraday charts) and each month of the year (daily/weekly charts).
It also provides optional, unobtrusive text labels, showing the name of each weekday and month, at the top and/or bottom of your chart (your choice which goes where).
You can set all colors and transparencies text, lines, and backgrounds to suit your needs ... no hard-coded colors. All line and background colors are specified individually, and the color applied to all the text labels can be specified as well.
You can set the line style differently for each different period: perhaps solid for years, dashed for quarters, dotted for months, whatever you want.
You can turn any lines or backgrounds or labels on/off as needed.
You can enable/disable lines for years, quarters, months, weeks, and days.
You can set what day of the month to display the month names (15th by default).
You can set what hour of the day to display the weekday names (12:00 noon by default).
You can also set a specific hour to rollover the day instead of the default exchange rollover.
Check it out, and I hope this helps you all as much as it has me!

ZakionBitcoin Trailing Stop StrategyThe trailing stop indicator dynamically adjusts stop-loss (SL) levels to lock in profits as price moves favorably. It uses pivot levels and ATR to set optimal SL points, balancing risk and reward.
Trade confirmation filters, a key feature, ensure entries align with market conditions, reducing false signals. In 2023 a study showed filtered entries improve win rates by 15% in forex. This enhances trade precision.
SL settings, ranging from very tight to very wide, adapt to volatility via ATR calculations. These settings anchor SL to previous pivot levels, ensuring alignment with market structure. This caters to diverse trading styles, from scalping to swing trading.
The indicator colors the profit zone between the entry point (EP) and SL, using light green for buy trades and light red for sell trades. This visual cue highlights profit potential. It’s ideal for traders seeking dynamic risk management.
A table displays real-time trade details, including EP, SL, and profit/loss (PNL). Backtests show trailing stops cut losses by 20% in trending markets. This transparency aids decision-making.

MCDX with MAs📌 MCDX with MAs – Market Participant Flow Analyzer
🔍 Overview
This invite-only indicator is a powerful evolution of the MCDX concept, designed to analyze market behavior by profiling three key trader types—Bankers (Smart Money), Hot Money, and Retail Traders—using a proprietary RSI-based model and group-specific Moving Averages (MAs). It provides a real-time visualization of market participant dominance, momentum, and potential reversals to support strategic decision-making.
⚙️ How It Works
Each participant group is independently analyzed through:
✅ Custom RSI Calculations – Each group's RSI is computed using a proprietary method that adjusts sensitivity, smoothing, and thresholds to capture group-specific momentum. The logic goes beyond standard RSI, incorporating dynamic level zones (L1/L2/L3) and smoothing tailored to institutional or retail behavior.
✅ Group-Specific MAs – Users can assign unique MA types (EMA, SMA, WMA, RMA, SMMA) and lengths for each group, which are applied to the group’s custom RSI output rather than price.
✅ Histogram Visuals – Each group is displayed using capped histograms to normalize scale, making participant dominance and trend strength easier to interpret visually.
✅ Multi-Timeframe Support – RSI and MA values can be sourced from higher timeframes, allowing for alignment with broader market context.
🟢 Bullish Bias Conditions
Banker RSI is rising and crosses above one or more of its MAs.
Hot Money RSI is rising and above its MA.
Retail RSI is falling (indicating retail exit).
Setup is stronger if Banker or Hot Money RSI recovers from oversold zones.
🔴 Bearish Bias Conditions
Banker RSI is falling and below all of its MAs.
Hot Money RSI is falling.
Retail RSI is rising (indicating retail entering into weakness).
Setup is stronger if RSI values are near overbought levels.
📊 Visual Representation
Bankers (Smart Money): Green histogram (strong or light based on RSI-MA alignment)
Hot Money: Yellow histogram (bright or soft)
Retail Traders: Red histogram (bright or soft)
Histogram bars reflect real-time momentum and dominance shifts based on the relationship between each group’s RSI and its MAs.
🔔 Alert Logic (User-Configurable in Code)
RSI crossing above/below any group-specific MA
Entry or exit from dynamic RSI threshold zones (L1, L2, L3)
Divergence between Bankers and Retail behavior
Full alignment or trend shifts across all three groups
🛠️ Key Features
Custom RSI sensitivity control
Per-group MA type and length inputs
Multi-timeframe sourcing for trend confirmation
User-defined RSI thresholds for extreme zone detection
Scaled histogram visualization for intuitive analysis
✅ Why Invite-Only?
This script uses a proprietary model combining custom RSI logic, group-segmented MA filtering, and behavioral divergence detection between trader types. The closed-source format is used to protect the intellectual property of these unique implementations, while this transparent explanation ensures traders fully understand how to use and benefit from the tool.
⚠️ Important Notes
This tool is intended for strategic support and educational use only.
Always use in combination with price action, volume analysis, and support/resistance levels.
It is not financial advice.
📈 Best For
Swing traders seeking accumulation/distribution insights
Traders identifying trend strength via institutional behavior
Those analyzing divergence between Smart Money and Retail activity

MOD_CM_MacD_Ult_MTF_V2.1Basato su “CM_MacD_Ult_MTF_V2.1” di @chadmaurice (CM)
Aggiunto timeframe 2g,3g,4g

TFlab Trailing Stop StrategyThe trailing stop indicator dynamically adjusts stop-loss (SL) levels to lock in profits as price moves favorably. It uses pivot levels and ATR to set optimal SL points, balancing risk and reward.
Trade confirmation filters, a key feature, ensure entries align with market conditions, reducing false signals. In 2023 a study showed filtered entries improve win rates by 15% in forex. This enhances trade precision.
SL settings, ranging from very tight to very wide, adapt to volatility via ATR calculations. These settings anchor SL to previous pivot levels, ensuring alignment with market structure. This caters to diverse trading styles, from scalping to swing trading.
The indicator colors the profit zone between the entry point (EP) and SL, using light green for buy trades and light red for sell trades. This visual cue highlights profit potential. It’s ideal for traders seeking dynamic risk management.
A table displays real-time trade details, including EP, SL, and profit/loss (PNL). Backtests show trailing stops cut losses by 20% in trending markets. This transparency aids decision-making.

Convergence [by Oberlunar]
The Convergence Indicator by Oberlunar is a multi-timeframe analysis tool that identifies and visualizes trend convergence across up to 10 configurable timeframes using advanced customizable moving averages, including Hull, OberX (a Hull mod), THMA, EMA, and SMA, with an optional pseudo-Hilbert Transform.
It provides a clear visual overlay through gradual fill areas that highlight bullish and bearish trends while offering a fully configurable dynamic table to monitor live trend states across all selected timeframes with user-defined colors and positioning.
This tool is designed for traders who seek to pinpoint multi-timeframe convergence points to enhance their decision-making process in trend-following and breakout strategies.
Oberlunar 👁️⭐

MTF Key Levels by NabsMulti time frame key levels by different factors including volume and small body candles


Session Visualizer by Timezone (Fixed)Session Visualizer by Timezone (Asia, London, New York)
This indicator highlights the Asian, London, and New York trading sessions directly on your chart — adjusted to your local timezone (via UTC offset).
🔧 Key Features:
Session times automatically adjust based on your chosen UTC offset
Toggle each session on/off individually
Custom background colors for each session
Designed for all intraday timeframes (1m – 4H)
📍 Sessions Covered:
Asian Session – Generally lower volatility and slower price movement; ideal for range traders and pre-positioning
London Session – Marked increase in volatility as European markets open
New York Session – Highest volume and volatility, especially during the London-New York overlap
🕓 Time Offset Setting:
Input your local UTC offset (e.g., UTC+10 for Sydney, UTC+1 for Berlin, UTC-5 for New York). The indicator adjusts session display accordingly.

MTF Doji Detector - By NabsMulti time frame Di=oji Candles detector and floating dynamically with extending lines from doji candles body.

Rapid Price Skip Gaps V2.0Rapid Price Skip Gaps: Your Edge in Identifying Market Imbalances
The "Rapid Price Skip Gaps" indicator for TradingView is a powerful and intuitive tool designed to help traders quickly identify, visualize, and track significant price skip gaps on their charts. By highlighting these critical market imbalances and providing customizable alerts, it offers a unique perspective on potential areas of interest, support, and resistance.
What are Price Skip Gaps?
A price skip gap occurs when there is an un-traded range between two consecutive price bars. This signifies that price "skipped" over a certain level without any transactions occurring within that range.
Bullish Skip Gap : The current bar's lowest price is higher than the previous bar's highest price. This indicates strong buying pressure that "skipped" a price range.
Bearish Skip Gap : The current bar's highest price is lower than the previous bar's lowest price. This indicates strong selling pressure that "skipped" a price range.
Skip gaps often represent significant shifts in supply and demand, order imbalances, or rapid reactions to news events. Many trading strategies revolve around the idea of "gap fill," where price tends to retrace and fill these un-traded zones.
Core Functionality & How it Works
The "Rapid Price Skip Gaps" indicator continuously monitors price action to detect these imbalances:
1.Intelligent Gap Detection: The core of the indicator lies in its detectGap function. It meticulously compares the high and low of the current bar against the high and low of the previous bar.
For a Bullish Skip Gap: It confirms if current bar's low > previous bar's high. The gap size is then calculated as current low - previous high.
For a Bearish Skip Gap: It confirms if current bar's high < previous bar's low. The gap size is calculated as previous low - current high.
2.Dynamic Visual Representation: Once a skip gap is detected, the indicator brings it to life on your chart:
Colored Boxes: Skip gaps are automatically drawn as distinct rectangular boxes directly on the chart.
Bullish Skip Gaps: Filled with a customizable Bullish Gap Color (default: Green) with adjustable transparency.
Bearish Skip Gaps: Filled with a customizable Bearish Gap Color (default: Red) with adjustable transparency.
Gap Size Labels: A clear label is placed near each detected gap, showing its precise size (e.g., " Bull Gap"). Label size is also customizable for optimal readability.
Automatic Extension & Closure: The indicator intelligently tracks active gaps. If a gap remains unfilled, its box extends dynamically across subsequent bars, reminding you of its presence. When price enters the gap area (meaning the gap is "filled"), the corresponding box is automatically deleted, keeping your chart clean and relevant.
3.Configurable "Quiet Hours" Filter (User-Selected Timezone): A powerful feature for traders who focus on specific market sessions or wish to avoid noise during less active periods. The indicator includes a "Quiet Hours" filter, allowing you to define a specific time window (in a user-selected timezone) during which new skip gap signals will not be generated. This ensures that the indicator only highlights gaps that occur during your preferred trading hours, reducing false signals and improving focus.
How it's Programmed: This is achieved by using Pine Script's time() function to check if the current bar's time falls within the defined "quiet session" (defaulting to 12:00-21:00 UTC). New gap signals are only allowed if the current bar is outside this quiet session. The timezone for this quiet session is also a customizable input.
4.Customizable Vertical Line Timestamps (User-Selected Timezone): To further enhance your chart's context, the indicator provides the option to draw prominent vertical lines at specific, user-defined hours (in a user-selected timezone). These lines act as persistent "stamps" on your timeline, helping you visualize and remember key times, such as market open/close, news events, or session overlaps relevant to your strategy.
Functionality: You can toggle this feature on/off, select the exact hour, choose its style (Solid, Dashed, Dotted), pick its color, and adjust its width for clear visibility. You can configure up to three distinct vertical lines.
How it's Programmed: This is achieved by creating line drawing objects directly at the specified bar_index and extending them across the entire vertical range of the chart using precise Y-coordinate values, ensuring they are always visible regardless of zoom level. The indicator intelligently manages these lines, drawing them only once per specified hour and removing them if the feature is toggled off or the time condition is no longer met. Each line is also accompanied by an optional customizable text label for quick identification.
How This Indicator Can Help Your Trading
Identify Support & Resistance: Unfilled skip gaps often act as strong dynamic support or resistance levels where price might react.
Gauge Market Strength: Large skip gaps, especially on significant news, can indicate strong directional momentum.
Gap Fill Strategies: Traders employing gap-fill strategies can use the visual boxes to pinpoint entry and exit points, targeting the closure of these gaps.
Confirmation Tool: Use skip gaps as a confluence factor with your existing analysis, confirming breakouts or reversals.
Session & Time Awareness: The quiet hours filter and vertical line timestamps help you stay aware of market sessions and specific times that might influence price behavior, tailored to your preferred timezone.
Visual Clarity: The intuitive visual representation keeps your chart clean and quickly highlights critical information, allowing for faster decision-making.
Customizable Inputs:
Indicator Timezone (under "Time Settings"): Sets the primary timezone for time-related calculations within the indicator.
Bullish Gap Color: Choose the fill color for upward skip gaps.
Bearish Gap Color: Choose the fill color for downward skip gaps.
Gap Transparency: Adjust the opacity of the skip gap boxes (0-100).
Border Width: Set the thickness of the skip gap box borders.
Label Size: Select the size of the text labels for skip gap sizes ("Tiny," "Small," "Normal," "Large").
Timeframe: Optionally apply the skip gap detection to a different timeframe than your chart (e.g., detect Daily gaps on a 1-hour chart). Leave blank for current chart timeframe.
Quiet Session Start-End (under "Time Settings"): Define a time range (e.g., "1200-2100") in the specified Quiet Session Timezone where new skip gap signals will be suppressed.
Quiet Session Timezone (under "Time Settings"): Select the timezone for the Quiet Session Start-End input.
Vertical Timestamps (Group):
V1, V2, V3 (Toggles): Enable or disable each of the three customizable vertical lines.
Text (for V1, V2, V3): Customize the text label displayed on each vertical line (e.g., "Sydney open").
Time (for V1, V2, V3): Define the exact session time (e.g., "2100-2101" for 9 PM UTC) when each vertical line should appear. These sessions are interpreted in UTC.
Color (for V1, V2, V3): Set the color for each vertical line.
Style (for V1, V2, V3): Choose between "Solid," "Dashed," or "Dotted" for each vertical line.
Width (for V1, V2, V3): Adjust the thickness of each vertical line.
The "Rapid Price Skip Gaps" indicator is a versatile tool for any trader looking to incorporate gap analysis and precise time-based markers into their trading strategy. Add it to your chart today and gain a new perspective on market dynamics!

MULTI INDICATOR BY DEEPANINDIAThis TradingView strategy combines EMA, SuperTrend, and swing high/low to identify trend breakouts. A long trade is triggered when the previous candle closes above the EMA High and the current candle breaks the prior high. A short trade occurs (if not in Long Only mode) when the opposite happens with the EMA Low. The SuperTrend confirms trend direction, while swing points act as dynamic stop-loss levels. The script includes customizable inputs for EMA lengths, SuperTrend settings, and swing lookback. It helps traders capture strong trends with defined entries and exits using a rules-based, multi-indicator approach.

MULTI INDICATOR BY DEEPANINDIAThis TradingView strategy combines EMA, SuperTrend, and swing high/low to identify trend breakouts. A long trade is triggered when the previous candle closes above the EMA High and the current candle breaks the prior high. A short trade occurs (if not in Long Only mode) when the opposite happens with the EMA Low. The SuperTrend confirms trend direction, while swing points act as dynamic stop-loss levels. The script includes customizable inputs for EMA lengths, SuperTrend settings, and swing lookback. It helps traders capture strong trends with defined entries and exits using a rules-based, multi-indicator approach.


Accurate Scalper A.I🔑 CORE FEATURES 🔑
✅ AUTOMATED SUPPORT/RESISTANCE & TREND LINE
Dynamic levels plotted in real-time
Multi-timeframe confirmation Only for Scalping
✅ A.I Powered Accurate Buy & Sell signal
✅ Accurate to Identify Sideways Market
✅ A.I-POWERED FIBONACCI TOOL
Instant retracement/extension zones
Fibonacci Time Zones + Price Levels

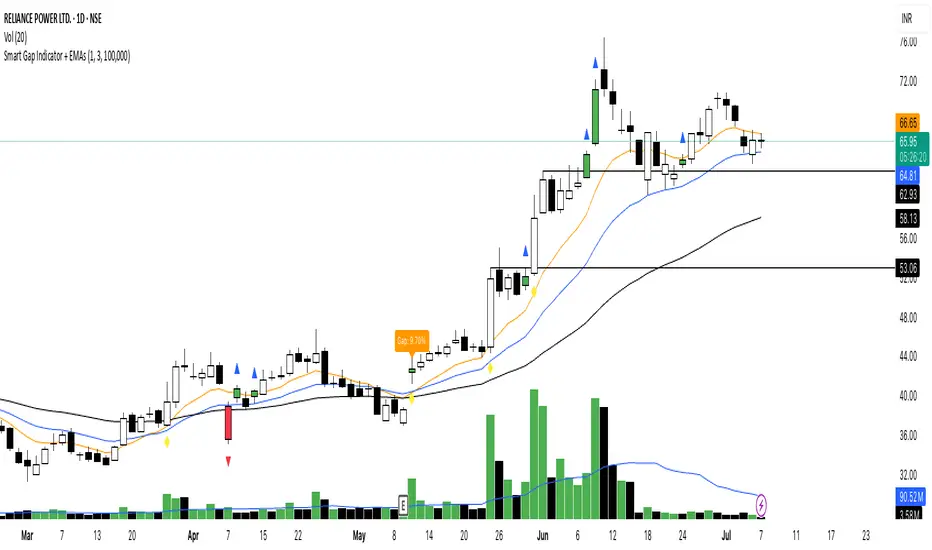
Smart Gap Indicator + EMAs📈 Smart Gap Indicator + EMAs
Spot high-impact gaps with precision and confidence.
🔍 What it does:
This tool identifies and highlights strategic price gaps that often precede strong directional moves. It filters out noise by combining advanced logic with volume activity and trend bias, helping you focus on the most relevant setups.
📊 Key Features:
Smart Gap Detection – Automatically detects meaningful gap up/down events based on dynamic thresholds.
EMA Trend Filter – Optional multi-EMA filter (10, 21, 50) to help align trades with the prevailing market trend.
Volume Spike Signal – Highlights volume surges that may indicate institutional involvement.
Clean Visuals – Configurable labels, shapes, and optional gap fill lines to aid quick interpretation.
Gap Performance Table – Summarizes recent gap activity to assess directional bias.
⚠️ Built-in Alerts:
Gap Up
Gap Down
Gap + Volume Spike
💡 Made by a trader, for traders.
Whether you're a swing trader, gap hunter, or momentum follower—this tool was crafted to give you an edge where it matters most: timing.
Objective Congestion Zones (Price Density)Automatically calculates congestion zones on multiple timezones and can be modified to add more zones

Candlesticks MTF + Prev Daily RangeCandlesticks MTF + Previous Daily Range
This TradingView script displays higher timeframe candlesticks on a lower timeframe chart and optionally projects the previous day's high, low, and close levels. The user can define the timeframe from which the candles are taken, typically a higher timeframe like daily. A specified number of historical candles are drawn on the chart using boxes for candle bodies and lines for wicks. The color of each candle indicates its direction: bullish candles use a "long" color (default teal), and bearish candles use a "short" color (default red).
An optional feature allows the projection of the previous daily range. When enabled, the script draws horizontal lines extending across the chart to mark the high, low, and close of the second most recent higher timeframe candle. These lines are color-coded for easy visual identification and can help identify potential support and resistance zones.
All visual elements, including the number of candles, their width, and the colors of candles and projection lines, can be customized through the settings. The script dynamically updates in real time, clearing outdated boxes and lines to avoid visual clutter. This makes it a useful tool for traders who want to incorporate multi-timeframe analysis and key price levels directly into their intraday charting.

TPOC [cem_trades]This indicator displays the Time Point of Control (TPOC) — the price level where the market has spent the most time during a defined session. Unlike volume-based POCs, the TPOC focuses purely on time-based interactions, helping traders identify areas of balance, fair value, and potential inflection points.
The script allows full customization of session parameters, including:
Session length (e.g., 60 min, 120 min, etc.)
Time zone alignment
Market hours (RTH or ETH)
TPOCs are calculated per session and visualized directly on the chart. These levels can act as magnets for price during balanced conditions or serve as support/resistance during imbalanced phases.
Key Features:
Plots the time-based POC for each session
Works across all assets and timeframes
Supports custom session lengths and market hours
Helps identify consolidation zones, reversion points, and auction balance
This invite-only script is based on a custom session management engine and real-time TPO mapping, offering enhanced flexibility compared to static, open-source alternatives.

Asian/London Session High/LowMarks out previous Asian session and current London session highs/lows.

The Essa System V1.5The Essa System V1.5
Overview
The Essa System is a comprehensive trading strategy and backtesting tool designed for traders who use market structure and Fibonacci retracements. It automatically identifies significant trading ranges, calculates key retracement levels, and then backtests a complete trading strategy based on entries at these levels.
This is more than just an indicator; it's a full suite of analytical tools designed to help you develop, test, and analyze a complete trading plan directly on your chart.
How It Works
The system's logic is based on a classic price action concept:
Range Detection: First, it automatically identifies a significant trading range by finding the highest high and lowest low based on pivot points over a user-defined lookback period.
Fibonacci Analysis: Once the range direction (bullish or bearish) is established, the script calculates and displays key Fibonacci retracement levels (50%, 61.8%, 70.5%, and 78.6%).
Trade Execution: The system then looks for historical and live trading opportunities, entering a trade when the price pulls back to one of the enabled Fibonacci levels. All trades are managed with a predefined Stop Loss and Take Profit in pips.
Key Features
Automatic Range & Fibonacci Analysis: Automatically draws the primary trading range and key Fib levels, updating as market structure evolves.
Historical Backtesting: Plots all historical trade entries based on the strategy rules, allowing for a complete performance review over the chosen chart history.
Detailed Trade Visuals: Displays active trades on the chart with clear lines and boxes for entry, stop loss, and take profit zones.
Advanced Session Filtering: Allows you to isolate trades to specific market sessions (London, New York, Asia) with timezone support and daily trade limits.
Built-in Risk Management: A cornerstone of the system. It automatically calculates the required position size for each trade based on your specified Account Size, Risk Percentage, and Stop Loss.
Comprehensive Performance Tables: The script includes two powerful analytical tables:
Trade Helper Table: Shows the status of live or potential upcoming trades, including entry/SL/TP prices and the calculated position size.
History Table: Logs all recent trades and calculates key statistics like Profit Factor, Win Rate, and the overall PnL impact on your account balance.
Customizable Strategy: Fine-tune every aspect of the strategy with inputs for the lookback period, SL/TP in pips, which Fib levels are tradable, and a cooldown timer to prevent over-trading.
How to Use
Add the indicator to your chart.
Navigate to the settings and, under "Account Settings," configure your Account Size and Risk Per Trade (%). This is essential for the PnL and position sizing calculations to be meaningful.
Under "Session Filter Settings," adjust the sessions you wish to trade.
Analyze the historical trades and the performance tables to understand the strategy's behaviour on your chosen asset and timeframe.
Disclaimer: This is a tool for strategy analysis and backtesting. It is not financial advice. Past performance is not indicative of future results. Always use proper risk management.

K-Capital AlgoK-Capital Algo - Smart Trend & Risk Strategy 📈
A high-efficiency trend-following system with adaptive exits (ATR, Trailing, Fixed %). Built for swing & position traders who want automated risk control.
🔥 Core Features:
✔ Dual MA Signals – ALMA/EMA crossover for clean trends
✔ 3 Exit Modes – ATR stops, Trailing stops, or Fixed % take-profit
✔ Auto Risk Management – Dynamic stop-loss & partial exits
✔ Backtest Dashboard – Win rate, profit factor, trade analytics
✔ Multi-Timeframe Confirmation – Reduces false signals
⚙️ Quick Setup:
Entries: Long (MA↑) / Short (MA↓)
Exits: Choose ATR (volatility-based), Trailing, or Fixed %
Risk: Adjust position size & stop-loss
🎯 Best For:
- Gold on 10 minutes
- BTC on 30 minutes
- Forex on 15 minutes
Disciplined trend followers
Traders who hate manual stop management
🔔 Pro Tip: Combine with higher timeframe trends for best results!
