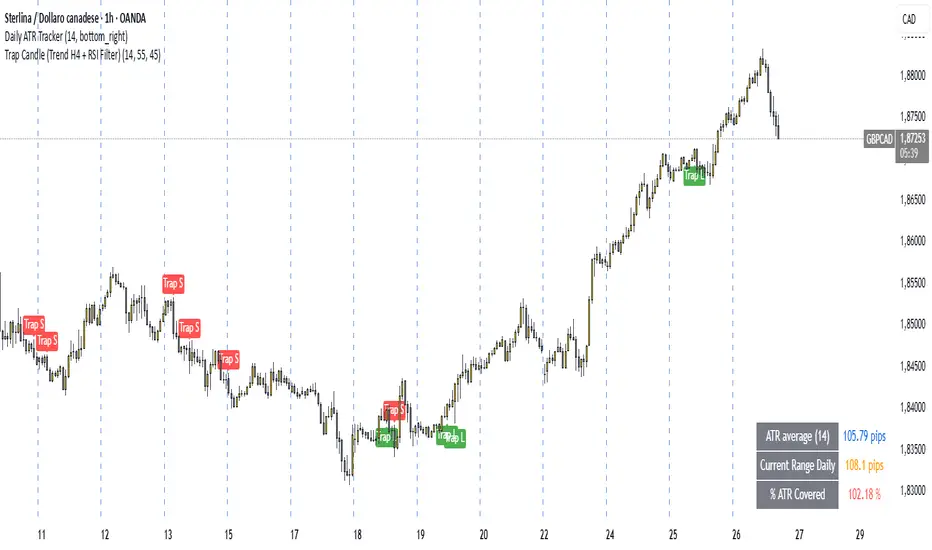
Trap Candle (Trend H4 + RSI Filter)🔍 Trap Candle (Trend H4 + RSI Filter)
Description:
The Trap Candle indicator is designed to identify a specific and powerful two-candle price action pattern that often signals a false breakout followed by a strong reversal. It combines pure price action with two objective filters to increase signal quality and trend alignment.
📊 Pattern Logic:
Bullish Trap: The current candle breaks the previous candle’s low, but closes above its high (and is bullish).
Bearish Trap: The current candle breaks the previous candle’s high, but closes below its low (and is bearish).
This pattern often reveals institutional traps or stop hunts before directional movement.
🧠 Trend Filter (H4):
Ensures long signals occur only when the H4 close is higher than the previous H4 close (uptrend).
Ensures short signals occur only in a H4 downtrend.
Designed to align intraday entries (M15, H1) with higher timeframe momentum.
💪 RSI Confirmation:
Includes a configurable RSI filter on the current timeframe.
Only long signals are shown when RSI is above a user-defined threshold (e.g. 55).
Only short signals are shown when RSI is below a user-defined threshold (e.g. 45).
⚙️ Key Features:
Full customization of RSI period and thresholds.
Clean, visual signal plotting on the chart (with “Trap L” or “Trap S” labels).
Built-in alerts for both long and short trap candle setups.
Perfect for traders who want to trade smart reversals with trend and momentum confirmation.
✅ Recommended Timeframes:
M15 and H1 (entry)
Uses H4 for trend bias
If you’re looking to filter out noise and spot only the highest quality reversal setups, the Trap Candle (Trend H4 + RSI Filter) is a solid tool for any price action-based strategy.
Multitimeframe
多時間框架MACD背離指標test test test test test test test test test test test test test test test test test test test

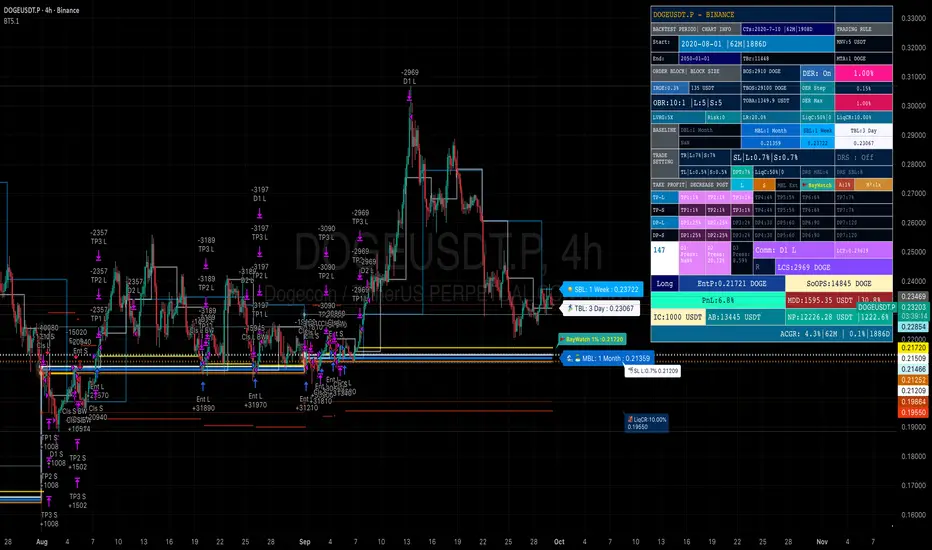
Baseline TrendBaseline Trend Strategy Overview
Baseline Trend is a crypto-only trading strategy built on straightforward price-based logic: market direction is determined solely by the price’s position relative to a selected baseline open price. No technical indicators like RSI, MACD, or volume are used—this approach is purely focused on price action and position size manipulation.
This strategy is a genuine concept, developed from my own market analysis and logical theory, refined through extensive observation of crypto market behaviour.
While the strategy offers structure and adaptability, it’s important to recognise that no single trading system or indicator fits all market conditions. This tool is meant to support decision-making, not replace it—encouraging traders to stay flexible, informed, and in control of their risk.
Important Usage Note:
This system is intended for crypto markets only.
– When used as an indicator guide, it can be applied to both spot and futures markets.
– However, when used with web-hook automation, it is designed only for futures contracts.
Ensure compatibility with your trading setup before using automation features.
Core Logic: The Baseline
The strategy revolves around the concept of a “Baseline”, with three types available:
Main Baseline: Defines the primary trend direction. If the price is above, go long; if below, go short.
Second Baseline and Third Baseline: Used to measure buying/selling pressure and are key to certain take-profit logic options.
Baselines are customisable to different timeframes—Year, Month, Week, and more—based on available input settings. Structurally, the Main Baseline is the highest-level trend reference, followed by the Second, then Third.
Users can mix and match these baselines across timeframes to backtest crypto symbols and understand behaviour patterns, particularly when used with standard candlestick charts.
Entry & Exit Logic
Entry Signal: Triggered when price crosses over/under a defined distance (percentage) from the Main Baseline. This distance is the Trade Line, calculated based on the close price.
Exit Signal / Stop Loss: If price moves un-favorable and crosses over/under the Stop Loss Line (a defined distance from the Main Baseline), the open position will be force-closed according to user-defined settings.
LiqC (Liquidation Cut)
LiqC is a secondary stop-loss that activates when a leveraged position’s loss equals or exceeds the user-defined liquidation threshold. It forcefully closes the position to help prevent full liquidation before stop-loss, providing an extra layer of protection.
This LiqC is directly tied to the leverage level set by the user. Please ensure you understand how leverage affects liquidation risk, as different broker exchanges may use different liquidation ratio models. Using incorrect assumptions or mismatched leverage values may result in unexpected behaviour.
Position Sizing & Block Units
This strategy features a block-based position sizing system designed for flexibility and precision in trade management:
Block Range: Customisable from 1 to 10 blocks
Risk Allocation: Controlled through a user-defined ROE (Risk of Equity) value
For example, setting an ROE of 0.1% with 10 blocks allocates a total of 1% of account equity to the position. This structure supports both conservative and aggressive risk approaches, depending on user preference.
Block sizes are automatically calculated in alignment with exchange requirements, using Minimum Notional Value (MNV) and Minimum Trade Amount (MTA). These values are dynamically calculated based on the live market price, and scaled relative to the trader’s balance and selected risk percentage. This ensures accurate sizing with built-in adaptability for any account level and current market conditions.
Scalping Meets Trend Holding
This system blends short-term scalping with longer-term trend holding, offering a flexible and adaptive trading style.
Example:
Enter 10 blocks → take quick profits on 5 blocks → let the remaining 5 ride the trend.
This dual-layered approach allows traders to secure early gains while staying positioned for larger market moves. Think of it as:
5 Blocks to Protect: Capture quick wins and manage exposure.
5 Blocks to Pursue: Let profits run by following the broader trend.
By combining both protection and pursuit, the strategy supports risk control without sacrificing the potential for extended returns.
Flexible Take-Profit Logic
The strategy supports multiple, customisable take-profit mechanisms:
TP1–4 (Profit Percentage)
Triggers take profit of 1 block unit when unrealised gains reach defined percentage thresholds (TP1, TP2, TP3, TP4).
Buying/Selling Pressure-Based Take Profit
D1 – Pressure 1
Measures pressure between Second and Third Baselines.
If the distance between them exceeds a user-defined DPT (Decrease Post Threshold) and the price moves far enough from the Third Baseline, D1 activates to take profit or scale out one block.
D2 – Pressure 2
Measures pressure between the Main and Second Baselines.
Works similarly to D1, using a separate distance and pressure trigger.
Note: Both D1 and D2 deactivate in reversal or even trend conditions.
D3–5: High-High / Low-Low Logic
Based on bar index tracking after position entry:
For Long Positions: If after D3 bars the price doesn't exceed the previous bar's high, the system executes a take profit or scale-out.
For Short Positions: If the price doesn't drop below the previous low, the same logic applies.
This approach adds time-based and momentum-aware exit flexibility.
Leverage & Liquidation Risk
When backtesting with leverage enabled, the system checks whether historical candles exceed the liquidation range, calculated based on the average entry price and the leverage input. If the Liquidation Risk Count exceeds 1, profit and loss accuracy may be affected. Traders are encouraged to monitor this count closely to ensure realistic backtesting results.
Since the system cannot directly control or sync with your broker exchange’s actual leverage setting, it’s important to manually match the system’s leverage input with your broker’s configured leverage.
For example: If the system leverage input is set to 10, your exchange leverage setting must also be set to 10. Any mismatch will lead to inaccurate liquidation risk and PnL calculations.
Backtesting and Customisation
All TP1–4 and D1–5 functions are fully optional and customisable. Users are encouraged to backtest different crypto symbols to observe how price behaviour aligns with baseline structures and pressure metrics.
Each of the TP1–4 and D1–5 triggers is designed to execute only once per open position, ensuring controlled and predictable behaviour within each trade cycle.
Since backtesting is based on available historical bar data, please note that data availability varies depending on your TradingView subscription plan. For more reliable insights, it’s recommended to backtest across multiple time ranges, not just the full dataset, to assess the stability and consistency of the strategy’s performance over time.
Additionally, the time frame resolution interval in TradingView is customisable. For best results, use commonly supported time frames such as 30 minutes, 1 hour, 4 hours, 1 day, or 1 week. While the system is designed to support a broad range of intervals, non-standard resolutions may still cause calculation errors.
Currently, the system supports the following resolution ranges:
Intraday: from 1 minute to 720 minutes
(e.g., 60 minutes = 1 hour, 240 minutes = 4 hours, 720 minutes = 12 hours)
Daily: from 1 day to 6 days
Weekly: from 1 week to 3 weeks
Monthly: from 1 month to 4 months
Although the script is built to adapt to various resolutions, users should still monitor output behaviour closely, especially when testing less common or edge-case time frames.
System Usage Notice:
This system can be used as a standalone trading indicator or integrated with an exchange that supports web-hook signal execution. If you choose to automate trades via web-hook, please ensure you fully understand how to configure the setup properly. Web-hook integration methods vary between exchanges, and incorrect setup may lead to unintended trades. Users are responsible for ensuring proper configuration and monitoring of their automation.
Note on Lower Time Frame Usage
When using lower time frames (e.g., 1-minute charts) as the trading time frame, please be aware that available historical data may be limited depending on your subscription plan. This can affect the depth and reliability of backtesting, making it harder to establish a trustworthy probability model for a symbol’s behaviour over time.
Additionally, when pairing a high-level Main Baseline (MBL) time line (such as "1 Month") with low time frame resolutions (like 1-minute), you may encounter order execution limits or calculation overloads during backtesting. This is due to the large number of historical bars required, which can strain the system's capacity.
That said, if a user intentionally chooses to work with lower time frames, that decision is fully respected—but it should be done with awareness and at the user’s own risk.
Things to Be Aware Of (Web-hook Usage Only)
The following points apply if you're using web-hook automation to send signals from the system to an exchange:
Alert Signal Reliability
During extreme market volatility, some broker exchanges may fail to respond to web-hook signals due to traffic overload. While rare, this has occurred in the past and should be considered when relying on automation.
Alert Expiration (TradingView)
If you're on a Basic plan, TradingView alerts are only active for a limited time—typically around 1.5 months. Once expired, signals will no longer be sent out.
To keep your system active, reset the alert before expiration. For uninterrupted alerts, consider upgrading to a Premium plan, which supports permanent alert activation.
TradingView Alert Maintenance
TradingView may occasionally perform system maintenance, during which alerts may temporarily stop functioning. It’s recommended to monitor TradingView’s status if you’re relying on real-time automation.
Repainting
As of the current version, no repainting behaviour has been observed. Signal stability and consistency have been maintained across real-time and historical bars.
Order Execution Type and Fill Logic
All signals use Limit orders by default, except for MBL Exit and Fallback execution, which use Market orders.
Since Limit orders are not guaranteed to fill, the system includes logic to cancel unfilled orders and resend them. If necessary, a Fallback Market order is used to avoid conflict with new incoming trades.
This has only happened once, and is considered rare, but users should always monitor execution status to ensure accuracy and alignment with system behaviour.
Feedback
If you encounter any errors, bugs, or unexpected behaviour while using the system, please don’t hesitate to let me know. Your input is invaluable for helping improve the strategy in future updates.
Likewise, if you have any suggestions or ideas for enhancing the system—whether it’s a new feature, adjustment, or usability improvement—please feel free to share. Together, we can continue refining the tool to make it more robust and beneficial for everyone.
Disclaimer
All trading involves risk, particularly in the crypto market where conditions can be highly volatile. Past performance does not guarantee future outcomes, and market behaviour may evolve over time. This strategy is offered as a tool to support trading decisions and should not be considered financial or investment advice. Each user is responsible for their own actions and accepts full responsibility for any results that may arise from using this system.
VT_RJ01_ALLTFIt's the rejection candle analysis
and using EMA to integrate and catogorize strong level of rejection

LTF Volume markerLTF Volume Marker
Overview:
The LTF Volume Marker highlights candles that contain volume spikes on a lower timeframe (LTF), even while you are viewing a higher timeframe chart. It is designed to help identify hidden volume activity that may not be visible when aggregating candles.
This indicator is conceptually similar to a volume profile — but instead of showing distribution across price levels, it visualizes volume clusters within the structure of a sloped trend or time-based aggregation.
Key Features:
✅ Automatically detects high-volume candles on a user-defined lower timeframe
✅ Marks the price level of volume spikes using weighted average price (VWAP) within higher timeframe bars
✅ Supports both manual threshold and auto mode (which highlights top X% of volume candles in a selected range)
✅ Fully adjustable timeframe and date range
✅ Displays either a point or an area at the spike location or together
How It Works:
You define a Lower Timeframe (e.g. 1-minute) and optionally a threshold or use the auto mode to dynamically calculate it from past data.
On higher timeframes (e.g. 5-min, 15-min), the indicator looks inside each bar, finds all volume spikes, and plots the volume-weighted average price of those spikes.
If you are on the same timeframe as the LTF, it simply highlights candles with volume exceeding the threshold.
Use Cases:
Spotting hidden volume clusters inside trending moves
Validating support/resistance levels with underlying volume
Filtering false breakouts using intra-bar volume
Enhancing scalping and intraday setups by visualizing internal structure
Notes:
The indicator ignores future-looking data (lookahead=off) and only processes completed bars.
If the chart’s timeframe is lower than the selected LTF, the indicator will automatically disable itself.
Works best with aggregated symbols, such as futures or cryptocurrencies with high resolution data.

HSI Market sessions and Volume profileHSI Market Sessions and Volume Profile
Unlock deeper market insight with this advanced volume profile indicator tailored for Hang Seng Index (HSI) and other futures instruments. This tool combines session-based volume analysis, customizable profiles, and intraday tracking for superior market structure awareness.
🔍 Key Features:
Dynamic Volume Profile: View aggregated buy/sell volume or open interest delta across customizable price zones.
POC, VAH, VAL Lines: Instantly spot the Point of Control, Value Area High, and Value Area Low for each session.
Flexible Session Options: Analyze market behavior by Tokyo, London, New York, or standard timeframes like Daily, Weekly, Monthly, Quarterly, or Yearly.
Live Zone Tracking: Stay ahead with real-time profiling of the current session.
Forex Box Option: Visualize forex trading zones even without volume profiles.
Highly Configurable: Choose from three display modes, resolution settings, and color schemes to fit your style and precision needs.
🧠 Smart Mechanics:
Adaptive to both Volume and Open Interest data.
Built-in smoothing algorithm for cleaner profiles in high-volatility assets.
Auto-reset and draw logic based on session type and bar resolution.
Intrabar data handling for more granular profiling (requires lower timeframe input).
✅ Ideal For:
HSI Futures Traders looking for market session clarity and volume zones.
Volume Profile Analysts needing flexible, session-specific profile rendering.
Day Traders and Swing Traders who value precision in trade planning.

Dashboard Trends📊 Dashboard Trends (Neutral Bias + VWAP Zones)
This indicator displays a real-time trend dashboard across multiple timeframes, enhanced with neutral bias detection and a dynamically visualized VWAP strength zone.
🔍 Core Features
✅ Multi-Timeframe Trend Analysis
Tracks EMA(22) vs EMA(200) on:
1m, 10m, 30m, 4h, and 1D
Includes Neutral Bias Detection:
Uses customizable or ATR-based threshold
Classifies each timeframe as Bullish, Bearish, or Neutral
Neutral conditions are displayed in gray
✅ Anchored VWAP Trend Logic
Daily VWAP line with real-time updates
+1σ and -1σ bands define the price zone
VWAP section evaluates:
Bullish if price is in top 50% above VWAP
Bearish if price is in bottom 50% below VWAP
Neutral if price is within the central 50% zone
VWAP bias shown with color-coded cell and text
✅ Visual Dashboard Table
Clean display in the bottom-right of the chart
Timeframes labeled with Bullish, Bearish, or Neutral
Color-coded per status (green/red/gray)
⚙️ Customization Options
Toggle between fixed or dynamic neutral thresholds
Adjust VWAP standard deviation band size
Control visibility of VWAP line and bands
Fully configurable colors for each condition
This tool is ideal for traders who want a visual trend framework across timeframes, with intelligent bias filtering to avoid false signals during consolidation or indecision. It balances momentum insight with market neutrality awareness, making it powerful for scalpers, swing traders, and intraday setups alike.

Advanced Multi-TF Stochastic Smart EntryFull Dynamic Algorhitmic Trading Indicator - Buy/Sell Signals - Long Term

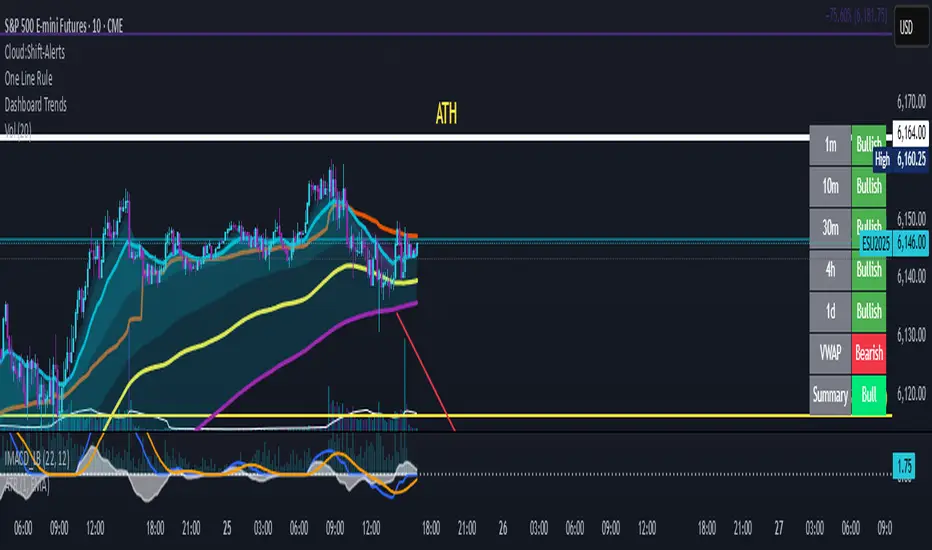
Dashboard Trends📊 Dashboard Trends + Anchored Daily VWAP
This indicator provides a real-time multi-timeframe trend dashboard alongside a daily anchored VWAP system, helping you assess both macro and intraday market sentiment at a glance.
🔍 Key Features
✅ Multi-Timeframe Trend Analysis
Tracks whether EMA(22) is above EMA(200) across:
1m, 10m, 30m, 4h, 1D timeframes
Color-coded "Bullish"/"Bearish" status for each
Aggregated trend summary using 6 signals (including VWAP)
✅ Anchored Daily VWAP
Uses ta.vwap to provide a session-resetting daily VWAP
VWAP resets at the beginning of each trading day
Live update throughout the day
Supports pre-market and after-hours if chart includes ETH
✅ VWAP Bands (±1σ to ±3σ)
Optional bands show price deviation from VWAP
Fully customizable:
Enable/disable each band
Set deviation multiplier
Adjust color and visibility
✅ Visual Dashboard
Table display in the bottom-right corner
Shows trend status per timeframe + VWAP + Summary
Easy-to-read green/yellow/red color codes
⚙️ Customization
Toggle VWAP line on/off
Enable or disable any band level
Adjust standard deviation multiplier
Choose your VWAP and band colors
🧠 Summary Logic
Strong Bull: 6 bullish signals
Bull: 5 signals
Mixed: 3–4 signals
Bear: 2 signals
Strong Bear: 0–1 signals
This tool is perfect for traders looking to combine trend-following and intraday mean-reversion awareness, with all the critical data visualized in one compact dashboard.
OG TTM Histogram Elite © 2025🔥 Created by OG WEALTH, this elite-level TTM Squeeze Histogram is built for precision sniper entries and exits.
Master squeeze cycles like never before:
🟢 Green Dots = Squeeze Released (Entry Setup Forming)
⚫ Black Dots = Squeeze Building (High Potential Coiling)
🟥 / 🟠 Histogram = Momentum Losing Strength
🔺 / 🔻 Entry Arrows = Confirmed Reversal or Trend Initiation
🚀 Features:
✅ Advanced MTF Confirmation from higher timeframes
🔔 Built-in Alerts: Squeeze ON, Release, Bull/Bear Entry
🎯 Auto-labeled Squeeze Status Tag (Top-Right Corner)
🧠 Refined Momentum Color Logic to avoid false signals
🎛️ Clean UI for scalpers, intraday traders, and swing specialists

FeraTrading Breakout Indicator v2🧠 Overview:
The FeraTrading Breakout Indicator v2 is a momentum-based opening range breakout (ORB) tool built around a fixed intraday structure. It captures price behavior shortly after the market opens and then projects custom breakout levels above and below a calculated midpoint.
Signals are only generated when price breaks one of these projected zones with confirmation from multiple aligned indicators, including RSI momentum, candle body strength, and volatility acceleration.
Unlike traditional ORB tools that plot breakout lines directly on the high and low of the session, this script does not use session highs/lows for its breakout levels. Instead, it creates a central zone based on internal range logic and projects breakout bands dynamically from that midpoint.
⚙️ How It Works:
🔹 Session Zone Setup:
After the first part of the New York session, the script captures the initial price structure.
From this structure, a midpoint zone is established.
Using this midpoint, the script projects upper and lower breakout bands that remain fixed for the rest of the day.
🔹 Breakout Signal Conditions:
To trigger a signal, all of the following must be met:
Price Engagement with Projected Zones:
The prior candle must break through the upper or lower projected level, showing clean directional intent.
Directional Candle Structure:
The breakout candle must have a clear and strong body (not dominated by wicks), confirming that the move had conviction.
RSI-Based Momentum Alignment:
A short-term RSI is calculated and smoothed.
Bullish signals require RSI to be above its average.
Bearish signals require RSI to be below its average.
This ensures breakouts occur with momentum support.
Volatility Spike Filter (Optional):
Checks if the breakout candle is significantly larger than recent candles to eliminate soft or passive breakouts.
All filters must align to print a signal, avoiding noisy or conflicting trades.
🎨 Visuals:
Midpoint Line: Central anchor for the breakout zone (drawn after the session range is complete).
Upper/Lower Breakout Bands: Custom levels projected from midpoint—not drawn on session highs/lows.
Signal Arrows:
Green triangle below the candle = bullish breakout
Red triangle above the candle = bearish breakout
🔒 What Makes It Original:
Uses a fixed custom range derived from structural behavior—not highs/lows—to define breakout levels
Integrates RSI and trend-following behavior with raw price structure for more precise entries
Requires candle anatomy, directional momentum, and volatility conditions to all confirm
Universally applicable across instruments and timeframes—no tuning required
Fixed levels provide a consistent reference point for traders throughout the session
This multi-layered, confirmation-based approach is unique to this script and justifies closed-source protection.
✅ How to Use:
Add to any intraday chart (3m–15m ideal)
After the session range is set, custom zones will appear and remain unchanged for the day
Watch for triangle signals and enter at the open of the signal candle
Use your own stop loss/take profit or trailing exit logic
Best used during high-volume, active market hours
💎 Why It’s Worth Paying For
The FeraTrading Breakout Indicator v2 elevates traditional ORB logic by blending a fixed, midpoint-based breakout structure with live confirmation from RSI, candle anatomy, and volatility filters.
Unlike generic mashups or open-source breakouts, this system:
Filters breakouts using real momentum alignment, not just price movement
Applies structural logic with consistent visual zones that don’t recalculate intraday
Eliminates noise by only triggering when force, structure, and trend all agree
Delivers repeatable, high-clarity signals that adapt to market tempo without parameter tweaking
This type of structured, confluence-validated breakout logic is not available in public indicators or simple ORB clones. It reflects custom engineering and real-world trader experience, resulting in a premium-grade breakout tool.
✅ Compliance & Originality
This script was built fully from scratch using original logic and structure. All visual zones, signal filters, and confirmation layers were designed and implemented internally. No open-source components or cloned calculations are used. RSI is used as a filter, although the thresholds should remain confidential.
All inputs, filters, and breakout mechanics were developed to be asset-agnostic and do not rely on any third-party libraries, code reuse, or recycled logic.
⚠️ Risk Disclaimer & Access Policy
This tool is not financial advice and does not predict future price direction. It visualizes structural and momentum conditions that have historically preceded breakouts. Use in combination with your own trade management system.
All trades carry risk. Past performance does not guarantee future results.
🔒 Why This Script Is Invite-Only and Closed-Source
This script contains proprietary logic that combines structural breakout detection with multi-layered signal validation. Releasing the source would expose the system to replication and diminish its uniqueness and value.
Access is restricted to protect:
The original breakout zone generation logic
The combined RSI-candle-volatility signal filter
The pattern structure and visual consistency framework
Keeping the script closed-source ensures the integrity of the design and preserves the edge for serious users.
We plan on implementing our Pattern Recognition Engine (PRE) into this indicator in the future to add more reliability to the signals.

21 & 200 EMA with Star at Crossovers21-day EMA: Plotted in green
200-day EMA: Plotted in red
Crossover Markers:
A yellow star (★) appears on the chart at the 21 EMA price level when:
21 EMA crosses above the 200 EMA (bullish crossover)
21 EMA crosses below the 200 EMA (bearish crossover)
Stars have a black background to ensure high visibility

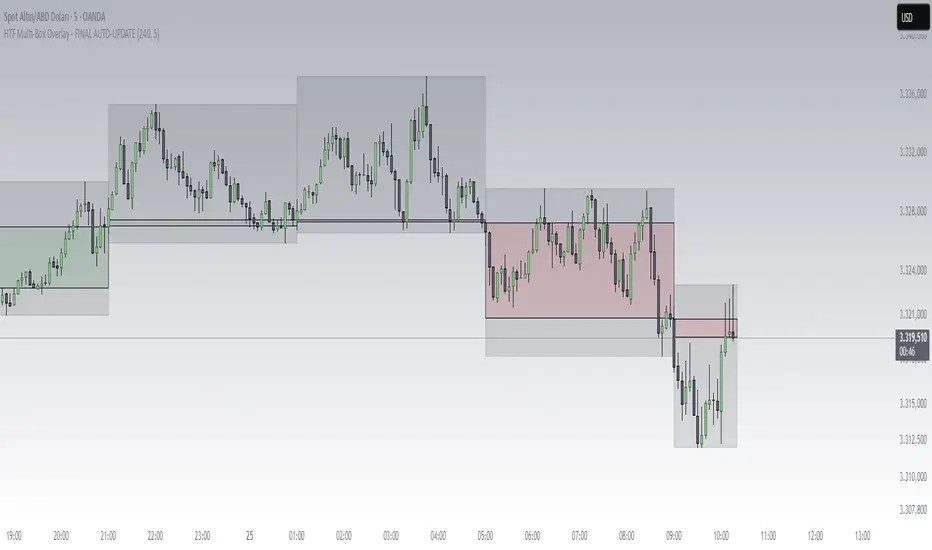
HTF Box Range Overlay - FIXEDThis script overlays higher timeframe candles (e.g. 4H) onto lower timeframe charts (e.g. 5min), showing both the body and wick ranges of the last N HTF candles.
Features:
✔ Displays both candle body and wick as separate shaded boxes
✔ Fully customizable for bullish/bearish colors and wick appearance
✔ Supports any higher timeframe (15m, 1H, 4H, 1D, etc.)
✔ Clean overlay with no performance lag
✔ Automatically adjusts in real-time as new candles form
Great for traders using HTF zones, supply/demand, or structure-based confluence. Works best when used on intraday charts.
Potential Parabolic Candles
- Plot bullish candles meeting all parameters to designate the potential for a parabolic bullish continuation.
- Default candles have a white body with a green outline and wick(s), if present, so change to a darker color if using a light background/color theme.
- Indicator works on all timeframes, however, I believe it is more efficient fiscally if used on longer timeframes, i.e. daily, 4 hr, 2 hr, hourly, and 30 min.
- The PPC should be used along with resistance levels, trendlines, and/or order blocks, etc. as the price will struggle or may even be rejected by these structures. If they appear in close proximity to the identified candle, treat it as a false signal since the reward may not be worth the risk.

[Myth Busting] [ORB] Casper SMC - 16 JunJust showcase of YouTube strategy claimed to be profitable and fool proof. Not on every asset and not long-term though

Momentum Hunter
Overview:
Momentum Hunter is a premium invite-only strategy script that detects powerful breakout opportunities by scanning for new highs relative to historical price action. It’s built to capitalize on high-momentum moves as soon as price breaches key resistance levels with strength.
Key Features:
Detects breakout signals based on extended-range high tests
Applies dynamic take-profit and stop-loss management
Optional filter to trade only during market hours
Displays a custom stats dashboard showing trade and performance metrics
Includes alert conditions for entries and trade closures
How to Use:
Apply Momentum Hunter to your preferred timeframe and asset. Watch for breakout signals and manage trades using your chosen settings. Suitable for intraday, swing, and momentum-based traders.
Access:
This script is invite-only and intended for subscribers. For access, please contact: 7899208204
📩 Email:
💬 Telegram:
🌐 Website:
⚠️ Disclaimer: This strategy is for educational and informational purposes only. Not financial advice. Always use proper risk management.

APLBGreen Line: Indicates the EMA is rising (bullish short-term momentum).
Red Line: Indicates the EMA is falling (bearish short-term momentum).

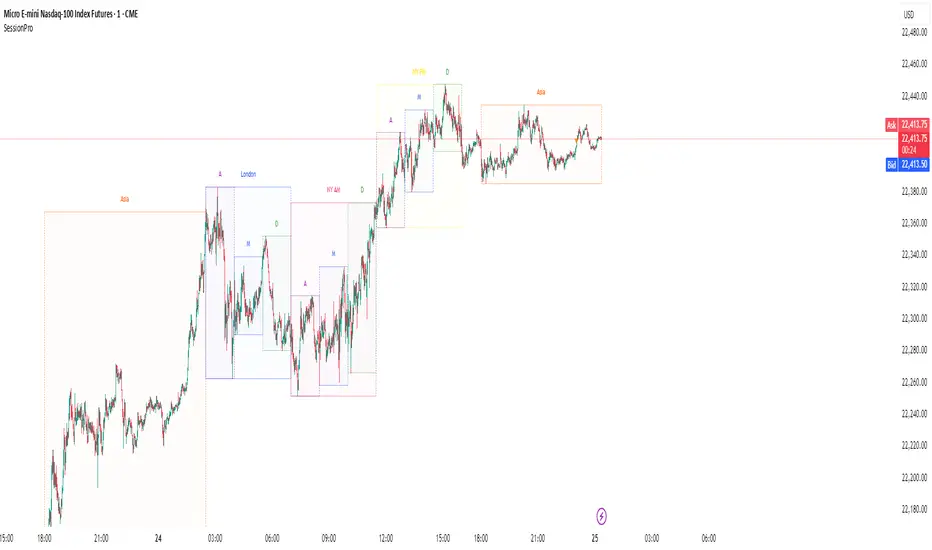
Session [PRO]Session Pro is a powerful and highly customizable indicator designed to visualize key trading sessions and their internal phases directly on your chart. It's built for traders who base their strategies on time-of-day dynamics, market opens, and specific session profiles.
This tool moves beyond simple session boxes by allowing you to map out detailed sub-sessions (e.g., Accumulation, Manipulation, Distribution phases) within the main trading windows, giving you a clearer view of the market's structure throughout the day.
Key Features
Customizable Main Sessions: Visualize Asia, London, and New York (AM/PM) sessions with distinct high/low ranges.
Detailed Sub-Sessions: Break down the London and New York sessions into three distinct profiles (A, M, D) to analyze intraday market movements.
Advanced Display Control: For every single session and sub-session, use a dropdown menu to choose your preferred display style:
Outline & Fill: The default view with a transparent colored background.
Outline Only: A minimalist view showing only the session's high/low border.
Off: Hide any session completely to declutter your chart.
Granular Color Customization: Every session and sub-session has its own individual color picker, giving you full control over your chart's aesthetics.
Custom Alerts: Never miss a session start again. Enable alerts for any specific main or sub-session you want to track.
Full Timezone Support: Easily sync the indicator to your local time using a UTC offset (defaulting to NY time, UTC-4) or your exchange's timezone.
How to Use
Go into the indicator Settings.
For each session, configure the Time, Color, and Display Style to your preference.
Check the Alert box for any session you wish to receive a notification for when it begins.
Adjust the global UTC Timezone Offset in the final settings tab to match your trading clock.
How to Set Alerts
First, go into the indicator's Settings and check the "Alert" box for each session you want to be notified about.
Click the "Alert" button on the TradingView toolbar (the alarm clock icon).
In the Condition dropdown, select "Session Pro".
In the dropdown directly below it, choose the option "Any alert() function call".
Select your preferred notification method (e.g., Pop-up, Email, App Notification) and click "Create".
Hope this tool helps you better visualize market structure and time your trades more effectively. Happy trading!

2x4x Stochastic2x4x Stochastic (with signal boxes, triggers, and %D display)
This indicator visualizes four Stochastic %D lines (D1–D4) along with their corresponding higher timeframe (HTF) versions, all scaled into separate sections of the same pane. It provides clear visual signals when all local and HTF stochastics are either overbought or oversold.
Key features:
4 customized stochastic %D calculations: D1 (9,1,3), D2 (14,1,3), D3 (40,1,4), D4 (60,1,10)
Automatic or manual higher timeframe selection
Signal box appears when all 8 stochastics are above overbought or below oversold thresholds (Standard mode)
Optional white line marks end of signal box
Optional green/red dotted line when HTF stochastic breaks defined trigger level after a signal box
Adjustable OB/OS levels for LTF and HTF separately (e.g., 15/85 or 10/90)
Full alarm system with time filter (e.g. 09:00–22:00) for box start, box end, and white line
This version uses only the Standard logic for signals – no alternative modes. Clean, stable, and optimized for performance.

RSI Trend Flip by julzALGORSI Trend Flip by julzALGO is a smart trend-following tool that combines RSI-based logic with a clean SuperTrend-style overlay and real-time multi-timeframe confirmation.
🔹 Core Logic:
The script uses the Relative Strength Index (RSI) to identify market regime shifts.
Trend flips up when RSI crosses above 70 → bullish.
Trend flips down when RSI crosses below 50 → bearish.
An adaptive trailing line (based on ATR) follows the new trend direction.
🔹 Visual Features:
Color-coded RSI SuperTrend line on the price chart (Green = Uptrend, Red = Downtrend).
Buy/Sell signal markers on breakout events (RSI cross 70/50).
Background shading to highlight active trend regime.
🔹 RSI Trend Table (Multi-Timeframe Confirmation):
Displays RSI trend status across:
15min, 1h, 4h, and 1D timeframes.
Table includes:
📈 RSI value
🔼🔽⚫ directional signal (Up / Down / Neutral)
Updates every 10 bars and helps validate trend across broader market structure.
🧠 Ideal For:
Traders looking for a clean RSI-only trend tool.
Swing traders and scalpers who want multi-timeframe RSI confirmation.
Anyone who wants a lightweight, non-repainting trend indicator with real-time table logic.


multi_tf_trendHere is a powerful trend indicator that uses data from 3 different time frames to analyze trend direction and direction switches. You can change the timeframes with the drop down menu. The index adds up all the bull signals and subtracts bear signals. The index can help gauge a trend's longevity and strength. For example, Index of +2 is strongly bullish while an Index of -2 is strongly bearish.
