SMT Divergence w/ HTFSMT Divergence with Higher Timeframe Indicator Overview
This script is a technical analysis tool for Trading View that identifies and visualizes Smart Money Concepts (SMT) divergences between two financial instruments across multiple timeframes. Here's a comprehensive breakdown of its functionality:
Core Purpose
The indicator detects divergences between a main symbol (the one displayed on the chart) and a comparison symbol (defined by the user, defaulting to ES futures). A divergence occurs when price movements between these two instruments show opposing patterns at pivot points.
Key Features
1. Smart Money Concepts (SMT) Divergence Detection
Identifies two types of divergences:
Bullish SMT: When one instrument makes a lower low while the other makes a higher low (or vice versa)
Bearish SMT: When one instrument makes a higher high while the other makes a lower high (or vice versa)
2. Multi-Timeframe Analysis
Analyses and displays divergences on the current chart timeframe
Provides optional overlays from higher timeframes:
Hourly (H1)
4-Hour (H4)
Daily (D)
Weekly (W)
Automatically determines which timeframes to display based on the current chart timeframe (e.g., won't show hourly divergences on an hourly chart)
3. Dynamic Pivot Detection
Calculates pivot points using a user-defined lookback period
Uses sophisticated algorithms to accurately locate pivot points across different timeframes
Maps higher timeframe pivots to corresponding price points on the current timeframe
4. Automatic Invalidation
Automatically removes divergence signals when they become invalidated by price action
For bearish SMT: Invalidated when both symbols close above their highest pivot points
For bullish SMT: Invalidated when both symbols close below their lowest pivot points
5. Visual Elements
Draws connecting lines between pivots that form divergences
Adds optional labels showing the type of divergence (bullish/bearish) and timeframe
Color-codes lines and labels (green for bullish, red for bearish by default)
Customizable colours and opacity settings
User Configuration Options
The script offers extensive customization through several input groups:
Symbols: Selection of the comparison symbol
SMT Settings: Pivot lookback timeframe and label visibility
Higher Timeframe Overlay: Toggle different timeframe overlays (H1, H4, Daily, Weekly)
Style Settings: Customize colours and opacity of visual elements
Multitimeframe

Ale BreakoutThis indicator identifies true market structure breaks (BOS and CHOCH) using confirmed swing highs and swing lows based on pivot logic.
✅ Breakouts can happen at any time of the day, but the entry signal will only trigger inside a user-defined time window (e.g., between 4:00 AM and 5:00 AM), ensuring structured and controlled setups.
The system includes automatic SL/TP calculation using ATR, candle body filters, and a configurable swing detection depth to avoid false signals.
You can configure:
Operating time range
Minimum candle body ratio
Minimum range between structure points
ATR multiplier
Pivot depth for swing detection
Perfect for Smart Money Concepts (SMC) or breakout traders looking to automate key structure-based entries within high-impact sessions.

Session & PD High/Low w/ True 4PM CST Trading DayMarks Session High/Low and previous day high/low. This is for personal use only for friends, not for sale or access to public.

BrainPremium [Algo BOT]Brainpremium ALGO BOT: The Next Generation of Smart Trading
Brainpremium ALGO BOT combines the power of the popular Brainpremium TradingView indicator with automated trading strategies, designed to help you trade smarter and more efficiently in the markets. This advanced algorithm leverages Brainpremium's proven signals to identify potential opportunities and execute trades according to your defined risk management parameters.
Why Choose Brainpremium ALGO BOT?
- Automated Trading: Optimize your time by letting the bot execute trades for you, opening and closing positions based on your set criteria.
- Proven Signals: Relies on the reliable BUY/SELL signals from the Brainpremium indicator, ensuring you don't miss key market movements.
- Customizable Risk Management: Set your own take-profit and stop-loss levels to match your risk tolerance and protect your capital.
- Advanced Algorithm: Features an intelligent structure that adapts to market conditions and provides optimized entry/exit points.
- User-Friendly Interface: Offers easy setup and use thanks to its full integration with the TradingView platform.
How Brainpremium ALGO BOT Works
Brainpremium ALGO BOT continuously monitors signals from the Brainpremium indicator. In response to the indicator's identified buy or sell signals, it automatically generates orders based on your pre-defined strategy and risk parameters. This helps you apply a disciplined trading strategy, minimizing emotional decisions.
Getting Started
To start using our bot, follow these simple steps:
1- Add the Brainpremium ALGO BOT to your TradingView charts.
2- Personalize your strategy and risk parameters (e.g., lot size, take-profit/stop-loss levels) in the settings menu.
3- Use the backtesting feature to review its performance based on historical data and optimize your strategy.
4- Set up your alarm and notification settings to stay informed about trades.
Disclaimer: Past performance is not indicative of future results. Algorithmic trading can involve high risk and may lead to the loss of a portion or all of your invested capital. Always conduct your own research and consult with your financial advisor.

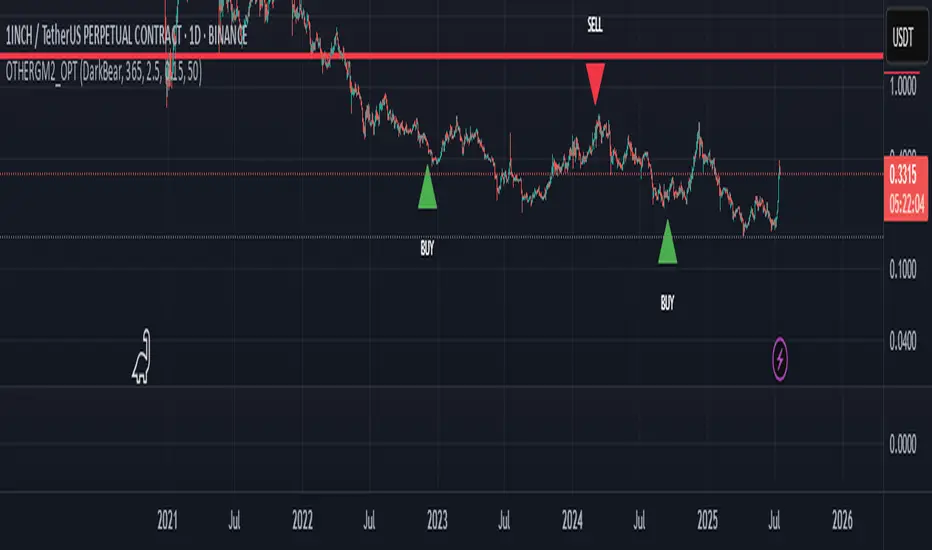
OTHER as % of Global M2 (Signals)Pine Script draws from recent approaches in the community for using Bitcoin market cap as a percentage of global M2 money supply to generate buy/sell signals, largely mirroring systems described in recent open-source TradingView scripts.
Key logic and features:
The script calculates the YoY global M2 growth rate and the distance of Bitcoin’s market cap % of M2 above/below its moving average.
Buy signal: Triggers when YoY M2 growth exceeds a threshold (default: 2.5%) while Bitcoin’s % is below its SMA, suggesting BTC is undervalued in a supportive macro environment.
Sell signal: Triggers if Bitcoin’s % of M2 exceeds its SMA by more than the defined extension threshold (default: 0.7), indicating overextension.
Your script’s improvements vs. community versions:
Extensive M2 breakdown: You aggregate M2 data from more countries/regions than typical community scripts, which usually focus on major economies only.
User parameterization: All critical values (signal cooldown, thresholds, averaging period) are configurable via inputs, enhancing usability and replicability.
Signal throttling: The ‘lead’ parameter (signal cooldown) ensures repeated buy/sell signals do not fire too frequently, making the indicator practical for swing trading.
General methodology context:
Community scripts, such as "s % Global M2 signal" and "Global M2 by Colin Talks Crypto," use similar approaches. The buy/sell rules, thresholds, and smoothing windows are well-documented, and scripts are often open source so you can compare implementations or adapt further to your trading preferences
Historical LiquidityHistorical Liquidity Indicator – Backtesting Mitigated Hidden Order Blocks
The Historical Liquidity Indicator is a companion tool to the Hidden Liquidity Indicator. It is designed to help traders visualize Hidden Order Blocks (HOBs), Partial Hidden Order Blocks (PHOBs) after they’ve been touched by price action.
This allows traders to perform historical market structure analysis, evaluate the effectiveness of past liquidity zones, and conduct systematic backtesting of mitigation-based strategies.
Purpose & Utility
Unlike the standard Hidden Liquidity Indicator, which focuses on active, untouched zones, the Historical Liquidity Indicator highlights zones that have already been mitigated.
It provides a clear historical trail of where hidden liquidity was previously located and how the market responded—offering valuable insights for:
• Identifying the success/failure rate of HOBs across time
• Analyzing price behavior after mitigation (retests, continuations, reversals)
• Supporting the development and refinement of liquidity-based trading strategies
• Recognizing recurring mitigation patterns over time
How It Works
This indicator uses the same core logic as the Hidden Liquidity Indicator—focused on the relationship between Fair Value Gaps (FVGs) and candle bodies—but tracks zones that have fully mitigated.
Mitigation logic is based on:
• HOB: Candle body fully fits inside the FVG and has now been touched by price
• PHOB: Candle body fits at least 50% inside the FVG and is later mitigated
Once mitigation is detected, the zone is stored and visualized historically, allowing traders to track the evolution of price in relation to prior hidden liquidity.
Visualization & Settings
Mitigated zones are clearly marked using distinct color schemes, that can be chosen individually.
You can toggle visibility of each type (HOBs, PHOBs) through the settings panel.
Why It Matters
While many indicators show current order blocks, this tool gives context by showing which liquidity zones were previously respected or invalidated by price. This makes it an ideal tool for:
• Quantifying past performance of liquidity zones
• Identifying support/resistance formed by mitigated blocks
• Enhancing discretionary or liquidity based strategies using historical validation
Important Notes
This is a closed-source indicator built on a custom methodology for detecting and tracking mitigated liquidity zones. While the internal logic remains proprietary, this description outlines the key concepts and use-cases so traders can understand how to apply it.
NFA.

TTM Squeeze HistogramMacro S&D Suite: Part 4 of 4 — TTM Squeeze Histogram Overview
Introduction to TTM Squeeze Histogram
Credit: The TTM Squeeze concept was developed by John Carter, and our Histogram builds directly on his methodology.
The TTM Squeeze Histogram complements the on‑chart Combo by providing a clear, pane‑based heatmap of market momentum. Building on John Carter's squeeze concept, it visualises momentum strength and weakening through four distinct colours, making it easy to spot shifts before price movements confirm them.
How TTM Squeeze Histogram Works
Histogram Metric: Calculates the rate‑of‑change of the Bollinger Band midline, plotting it as a histogram.
Four‑State Colouring:
Green: Strong upward momentum (rising above zero)
Orange: Weakening upward momentum (falling highs above zero)
Red: Strong downward momentum (falling below zero)
Blue: Weakening downward momentum (rising lows below zero)
Squeeze Markers: Black dots indicate squeeze-on, and grey dots indicate squeeze-off, aligning with the histogram for seamless cross-confirmation.
This pane allows you to watch momentum build and fade, confirming or warning against potential breakouts at your support and resistance (S&D) zones.
Applying TTM Squeeze Histogram
Add the Histogram pane to your chart alongside Alpha, Beta, and the Combo overlay.
Align Signals: Look for colour transitions (orange→green or blue→red) coinciding with Beta or Alpha zone touches.
Confirm Timing: Use the histogram to anticipate momentum surges before price breaks key channels.
Entry & Exit Guidance: Enter when the colour flips to a strong state; consider exits or scaling back when it shifts back toward weaker colours.
Multi-Tool Confluence: Utilise the histogram in conjunction with Combo squeeze-off and S&D zone reactions to achieve the highest-probability setups.
Advantages of TTM Squeeze Histogram
Momentum Clarity: Four-state colours make it obvious when momentum is building or losing momentum.
Early Warning: Identify weakening momentum before a price reversal occurs, allowing you to lock in profits or avoid false breakouts.
Pane‑Based Focus: Keeps price chart uncluttered while providing deep momentum insight.
Synergy with Combo: Pairs perfectly with the Combo overlay for cross‑validation of squeeze events.
Bringing It All Together
By using Macro S&D Alpha, Beta, TTM Squeeze Combo, and Histogram together, you gain a full‑spectrum trading framework:
Alpha for big‑picture pivots (daily/4‑h)
Beta for tactical zone precision (30‑m/5‑m)
Combo for on‑chart volatility‑momentum context
Histogram for focused momentum heatmapping
This four‑tool suite provides a high‑probability setup and helps you manage risk with confidence.
Our Mission
We are committed to building and servicing our trading community with trust and integrity. These indicators are tools—what truly matters is your continuous learning, discipline, and responsible execution. Thank you for joining us on this journey; we look forward to supporting your success across all market conditions.
Disclaimer
Access and use of the Macro S&D Suite and TTM Squeeze tools are provided on an "as‑is" basis. You acknowledge and agree that all trading decisions are solely your responsibility. Past performance does not guarantee future results. No representation is made regarding the accuracy or completeness of the signals, and we disclaim any liability for losses or damages incurred through their use. Always employ appropriate risk management and seek independent advice as needed.

TTM Squeeze ComboMacro S&D Suite: Part 3 of 4 — TTM Squeeze Combo Overview
Introduction to TTM Squeeze Combo
The TTM Squeeze Combo brings volatility and momentum analysis directly onto your price chart. Credit for the original Squeeze concept goes to John Carter, who combined Bollinger Bands and Keltner Channels into a powerful volatility filter. Our implementation overlays squeeze dots, channels, and a semi-transparent momentum histogram, allowing you to see both coiling and breakout conditions in the context of your Alpha and Beta zones.
How the TTM Squeeze Combo Works
Squeeze Detection: When Bollinger Bands (20 SMA ± 2 σ) contract inside Keltner Channels (20 EMA ± 1.5 ATR), the market is in a low‑volatility "squeeze" (plotted as a red dot). Expansion outside signals breakout potential (grey arrow).
Channel Overlay: Bollinger and Keltner boundaries are drawn on the chart, framing price action within volatility bands.
Semi‑Transparent Histogram: Plots the rate‑of‑change of the SMA midline as bars behind the candles, colour-coded by momentum direction (strong up, weak up, strong down, weak down).
This overlay keeps all signals in one view, giving you immediate context when price interacts with supply & demand zones.
Applying TTM Squeeze Combo
Add the Combo to your lower‑timeframe chart (e.g. 15‑ or 5‑minute).
Align squeeze‑on dots with Alpha and Beta zones: look for dots appearing as price enters a zone, indicating a coiled market.
Watch for squeeze‑off arrows at breakout: confirm with the histogram flipping to a strong colour (green for bullish, red for bearish).
Entrances & Exits: Enter on the first candle, breaking the bands in the direction of the histogram confirmation. Use zone boundaries for stops and take‑profits.
Timeframe Consistency: While most effective on shorter timeframes, you can apply the Combo on any timeframe to confirm broader momentum shifts.
Advantages of TTM Squeeze Combo
On‑Chart Clarity: Eliminates pane‑switching by combining volatility dots, channels, and histogram with price.
Momentum Insight: Four‑state colouring alerts you to weakening or strengthening momentum in real time.
Zone Confirmation: Enhances S&D entries by confirming coiled price action and explosive breakouts exactly at your zones.
Flexible Application: Supports both intraday scalping and swing‑trade timing across multiple timeframes.
Disclaimer
Access to and use of the TTM Squeeze Combo, Macro S&D Alpha, and Macro S&D Beta tools are provided on an "as‑is" basis. You acknowledge and agree that all trading decisions are your sole responsibility. Past performance is not indicative of future results, and no guarantee is made regarding profitability or accuracy of signals. You should employ appropriate risk management and seek independent advice as needed. We disclaim any liability for losses or damages incurred through the use of these indicators.

SIWONK V12 - MA StrategyThe SIWONK V12 - MA Strategy indicator was designed to help traders identify key market zones based on Support & Resistance (S&R) principles, along with Crossing analysis. The SIWONK V12 - MA Strategy indicator is suitable for scalping, particularly in the Gold (XAUUSD) and Bitcoin (BTC) markets on lower timeframes like M1 and M5. It can also be used on all timeframes.

Macro S&D AlphaMacro S&D Suite: Part 1 of 4 — Macro S&D Alpha Overview
Introduction to Macro S&D Alpha
Macro S&D Alpha focuses on identifying high‑timeframe supply and demand pivots based on key historical price swings and market structure. It is not restricted to any time frame but is suitable for weekly, Daily, 4‑hour, and 1‑hour charts. It reveals the broad zones where institutional participants place large orders. These structural levels form the potential backbone for a trading plan, guiding strategic entry and exit points for traders. Trading the financial markets is not a quick‑rich scheme. It requires dedication to learning, disciplined execution of your trading plan, precise entries and exits, and effective risk management. Your mental and physical well‑being also play a crucial role in consistent performance. This system provides tools to guide you, but success depends on your commitment and responsibility.
How Macro S&D Alpha Works
Historical Swing Analysis: Identifies key high/low pivot points over a user-defined look-back period to capture meaningful inflexion levels in market structure.
Volatility & Structure Filters: Integrates momentum and volatility metrics to confirm only the strongest pivot areas, filtering out noise and low‑volume swings.
Zone Construction & Projection: Draws horizontal supply (resistance) and demand (support) zones based on validated pivots, extending them forward to highlight potential reaction areas.
Dynamic Recalculation: Zones automatically update as new pivots form, ensuring the indicator stays aligned with evolving price action and overall trend.
Applying Macro S&D Alpha
Select Daily or 4‑Hour Charts: Add Alpha to visualise the most impactful support and resistance zones.
Observe Price Interactions: Look for clear bounces or rejections at zone boundaries—these are high‑probability areas.
Confirm with Context: Use trend indicators or fundamental insights to ensure alignment with the broader market direction.
Plan Entries & Exits: Enter near the zone edge, place stops just beyond the zone, and set profit targets at subsequent structural pivots.
Advantages of Macro S&D Alpha
Strategic Insight: Highlights the dominant market structure that persists over days and weeks.
Automated Updates: Zones recalculate seamlessly as new pivots form, eliminating the need for manual redrawing.
Clear Risk Parameters: Defined zone bounds enable precise stop-loss placement and reward-to-risk calculation.
Simplified Analysis: One indicator conveys multi‑month structure, ideal for swing and position traders.

NMT P&L; %EMA112; DVB; Inside Bar & Fakey GPTA. Lines
1. You choose the number of candles (n) needed to determine the largest and smallest values among the candles you choose
2. Determine the OHLC4 candle with the smallest value
3. Determine the OHLC4 candle with the largest value
=> I draw 2 dashed lines and calculate the % difference
B. Determine the Inside Bar and Fakey candles
C. Determine the difference between the buy price and the last closing price
Happy to serve you!!

GMP - Choch/BOS,FVG & PivotsGMP M5 Sniper Entry Execution – Smart Money Confirmations Tool
This indicator is designed for the GMP Method’s Entry Execution layer on the 5-minute timeframe. It helps traders spot high-precision entries aligned with smart money concepts and multi-timeframe bias.
Key Features:
Marks internal M5 Break of Structure (BOS) levels to confirm directional shift
Highlights Order Blocks (OB) and Fair Value Gaps (FVG) for sniper retracement entries
Auto-labels potential retest and mitigation zones
Clean visual cues for liquidity sweeps and trap setups
Aligned with GMP’s top-down approach (H1 directional bias, M15 POI, M5 execution)
Designed for scalpers and intraday traders seeking refined entry precision
Best Use Case:
Use this tool as your final confirmation layer after H1 bias mapping and M15 POI identification. Wait for M5 BOS plus OB/FVG setups before executing trades to increase confluence and reduce false entries.
Important:
This indicator is not a signal service. It is an advanced analysis tool to support discretionary execution within a structured trading plan.

GMP H1 Trend Line IdentifierGMP H1 Trendline Automation – Precision Bias Mapping Tool
This indicator automates high timeframe trendline drawing on the 1-hour chart to support directional bias and destination mapping in the GMP Method.
Key Features:
Accurately identifies and draws trendlines based on price structure without breaking random candles
Connects meaningful swing highs and lows in line with market direction
Filters noise to avoid messy or invalid trendline connections
Helps traders define bullish or bearish bias zones clearly
Supports top-down analysis by establishing a reliable framework for lower timeframe setups (M15 POI, M5 entries)
Best Use Case:
Use this indicator as your first step in the GMP trading flow to set directional bias and target mapping. Let it automatically detect valid trendlines so you can focus on planning clean, high-probability trades.
Note:
This tool is designed for discretionary traders who want objective, repeatable trendline analysis without subjective guesswork.

GMP - Order Block DetectorGMP M15 Impulsive Order Block Detector – Institutional Zone Finder
This indicator is designed to help traders automatically detect high-probability Impulsive Order Blocks (OB) on the 15-minute timeframe, following the footprint of institutional moves and enhancing GMP Method precision.
Key Features:
Identifies strong, impulsive OBs that mark institutional buying and selling zones
Filters out weak or sideways zones for cleaner, more actionable setups
Highlights potential POIs (Points of Interest) that align with the higher timeframe directional bias (H1)
Supports target zone planning with visual OB levels for retest or mitigation entries
Designed to help traders avoid retail traps and false breakouts by tracking true momentum origins
Best Use Case:
In the GMP Method, the M15 timeframe is the Dynamic POI Identification layer. After defining the H1 bias and destination targets with the Trendline Automation tool, use this M15 indicator to automatically locate valid institutional OBs and FVGs. These zones become your mapped POIs to watch for entries on the M5 execution layer.
Trading Flow Example:
✅ H1 – Map directional bias and destination with trendlines
✅ M15 – Identify valid impulsive OBs with this indicator to mark target POIs
✅ M5 – Wait for internal BOS and sniper entries at these POIs
Note:
This indicator is not a signal service. It’s an analysis tool for discretionary traders who want to replicate institutional-style mapping and improve consistency in identifying high-quality trading zones.

GMP CHoCH & BOS with MTF StatusGMP M15 Status Overlay – Higher Timeframe Context Anywhere
This tool is designed to keep you aligned with your M15 trading plan even when you drop to execution timeframes like M5. It shows the current M15 bias and POI status on any chart timeframe, making sure you never lose track of your top-down analysis.
Key Features:
Displays M15 bias (bullish/bearish/neutral) in real time on any timeframe
Highlights active M15 POI zones or impulsive OB levels
Allows traders to monitor M15 direction even when refining entries on M5
Clean, minimal overlay for easy integration with any chart setup
Supports disciplined GMP Method execution by enforcing bias adherence
Best Use Case:
The GMP Method relies on structured top-down analysis:
✅ H1 – Directional bias and target mapping
✅ M15 – Dynamic POI Identification with OB/FVG mapping
✅ M5 – Sniper Entry Execution
When you’re on M5 for precision entries, this M15 Status Overlay ensures you remain aware of your M15 roadmap. It helps prevent counter-bias trades and reinforces confluence by keeping the higher timeframe plan always in sight.
Note:
This is not a signal or entry tool. It is a discipline aid to maintain alignment with your trading system and avoid emotional or impulsive entries against your mapped M15 strategy.

Smart MA Cross + Confluence FilterAnother MA Cross tool that combines confluence filtering with various oscillators.

Smart MTF Confluence OscillatorA very script heavy multi-timeframe oscillator with RSI, SMI, Fast and Slow Stochastics, and intelligent timeframe scripting to automatically adjust the HTF. Also the ability to reference HK candles if you prefer.

Fair Value Gap MTF [by Oberlunar]Fair Value Gap MTF is a multi-timeframe indicator designed to detect and display Fair Value Gaps (FVGs) across up to five customizable timeframes. Fair Value Gaps are price inefficiencies—zones where the market moved too quickly, leaving unfilled areas between candles. These gaps are often used by traders as reference points for future price retracements, as they tend to be revisited or “mitigated” over time.
This indicator extends the traditional FVG concept by introducing dynamic multi-timeframe tracking. Each timeframe has its own visual layer, with distinct user-defined colors for bullish and bearish gaps. The script not only highlights newly formed FVGs but also updates them visually when they are touched by price. Mitigated FVGs are recolored in real time, and an optional setting allows the size of these zones to shrink progressively, reflecting only the remaining untested portion.
Labels at the center of each box display the originating timeframe, offering clear visual context. All calculations are properly aligned with the display chart, ensuring that each FVG is correctly projected into the current view, regardless of its timeframe of origin.
Fair Value Gaps often act as support or resistance levels. Bullish FVGs can serve as areas where price may find support, while bearish FVGs can signal potential resistance. When these zones are mitigated repeatedly, it typically reflects areas of institutional interest, liquidity pools, or zones of accumulation and distribution. Such behavior makes them particularly significant in breakout and reversal strategies.
— Oberlunar 👁️★

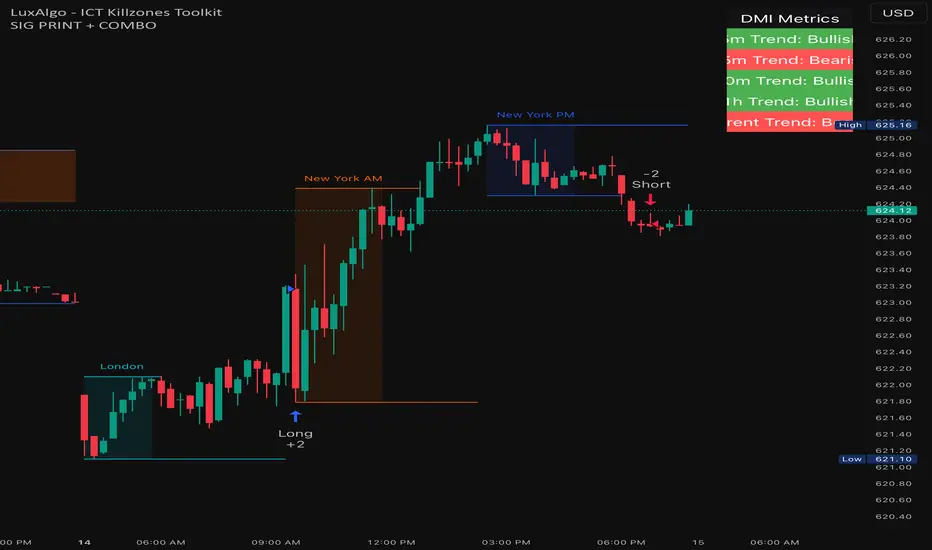
SIG PRINT + COMBO SIG PRINT + COMBO — Multi-Timeframe Trend & EMA Crossover Tool
This script combines EMA crossover logic with DMI-based trend analysis across multiple timeframes. It helps visualize directional trends (Bullish, Bearish, or No Clear Trend) on 5-minute, 15-minute, 30-minute, and 1-hour charts, displayed in a color-coded table overlay.
Key Components:
• EMA Strategy: Uses configurable short- and long-term EMAs to define crossover-based entry conditions.
• DMI Trend Detection: Implements ADX, +DI, and -DI to assess trend direction and strength.
• Multi-Timeframe Display: Shows trend signals for 5m, 15m, 30m, 1h, and current chart timeframe.
Built for users interested in aligning strategy entries with trend context across multiple timeframes.
⸻
@zaytradellc
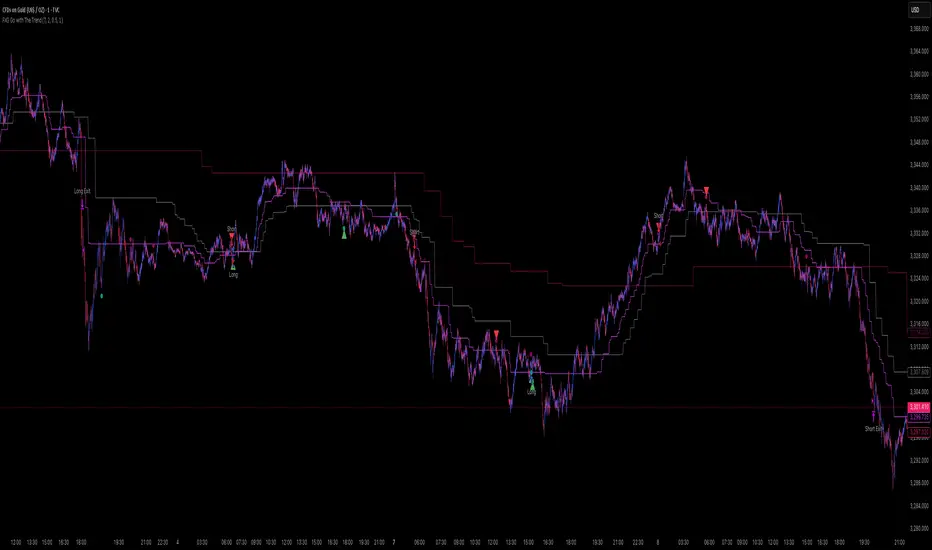
FXG Go with The TrendThis Strategy Includes Entry With Volume, porbably where banks buys
Enter When its aligned with trend, Specifically for GOLD, not tested for other
Supply/Demand Market Structure (SMA Multi-Timeframe)Supply/Demand Based Market Structure
Structure + Order Blocks from Synthetic SMA Candles
Overview:
The SMA Supply/Demand Market Structure indicator combines market structure analysis with supply/demand logic, powered by SMA-based synthetic candles . Instead of relying on raw candle data, this tool generates smoothed higher-timeframe candles using simple moving averages to identify more stable zones and cleaner structure shifts.
It detects bullish and bearish breaks of structure (BoS) , highlights swing points like HH, HL, LH, LL , and plots institutional-style supply and demand zones formed from aggressive rallies or drops. The result is a precise and noise-filtered view of market intent, perfect for trend-following or smart money strategies.
How It Works:
- Synthetic candles are created using SMA of OHLC values on your selected timeframe (HTF).
- A bullish break occurs when price closes above the high of the last bearish synthetic candle.
- A bearish break occurs when price closes below the low of the last bullish synthetic candle.
- Upon break confirmation:
- A demand zone is drawn using the last bearish candle.
- A supply zone is drawn using the last bullish candle.
- Each zone is extended forward for a user-defined number of bars and optionally deleted upon mitigation.
- Zigzag-based internal structure connects valid swing points and classifies them as HH, HL, LH, LL , including Liquidity Sweeps (LS) .
- BoS levels are highlighted with lines that automatically reset when new structure forms.
Key Features:
- Synthetic SMA Candles : Smooth and reliable structure from average-based HTF candles
- Break Modes : Choose between raw HTF closes or SMA closes for break logic
- Custom Timeframe Selection : Analyze structure across any HTF you choose
- Dynamic Supply/Demand Zones : Auto-plot boxes from valid rallies/drops
- Mitigation Detection : Optionally fade or delete zones when price trades through
- Zigzag Structure Mapping : Automatically connect structural highs/lows
- BoS Detection : Real-time breakout of swing points with visual confirmation
- Smart Labels : Marks HH, HL, LH, LL, and LS directly on the chart
- Multi-timeframe Alert System : Notify for all structural changes, BoS, and new zones
How to Use:
- Set your desired HTF and SMA Length for synthetic candle smoothing.
- Use SMA=1 for raw candles
- Select a Break Mode :
- Raw Close : Uses standard HTF close values
- SMA Close : Uses smoothed closes from SMA
- Watch for bullish or bearish breaks — zones are plotted when price confirms breakout structure.
- Use demand zones as long entry areas and supply zones as short setups on retests.
- Rely on internal shifts and zigzag swings to monitor structure continuity.
- Enable alerts for swing formations, BoS, and liquidity sweeps to trade hands-free.
Recommended Strategies:
- Smart Money & ICT Models : Use synthetic demand/supply + BoS for mitigation or continuation plays
- Swing Trading : Align with higher timeframe structure and use zones for entry triggers
- Trend Trading : Confirm structure alignment and wait for pullbacks into zones
- Reversal Entries : Trade structure breaks when zones fail and a BoS confirms the shift
Customization Options:
- Timeframe input for custom HTF control
- SMA Length to adjust candle smoothing
- Zone Style : Control zone color, transparency, and duration
- Structure Display : Toggle swing labels and zigzag visuals
- Alert Mode : Choose between LTF, MTF, or HTF alerts
Summary:
SMA Supply/Demand Market Structure provides a clean, flexible view of price structure and institutional intent by fusing market structure with SMA-based synthetic candles. It’s ideal for anyone seeking reduced noise, visually guided entries, and rule-based trading based on structural shifts and real-time demand/supply dynamics.

Rally/Drop Market Structure (Multi-Timeframe)Rally/Drop Market Structure
Supply and Demand Zones from Bullish/Bearish Breaks
Overview:
The Rally/Drop Market Structure indicator is a powerful price action tool that identifies key structural turning points in the market by detecting bullish and bearish breaks . After each confirmed break, it plots either a demand zone (following a bullish break or rally) or a supply zone (following a bearish break or drop). These zones represent institutional footprints — areas where price is likely to react due to imbalance or unfilled orders.
The indicator is based on synthetic higher timeframe (HTF) candles to provide a more stable and smoothed structural map, improving clarity and signal quality over raw candles.
How It Works:
- A bullish break is defined when price makes a higher high and a higher low (or closes above the previous high depending on your selected mode).
- A bearish break is defined when price makes a lower high and a lower low (or closes below the previous low).
- After a bullish break, the indicator plots a demand zone based on the low and high of the most recent bearish candle — representing where demand stepped in.
- After a bearish break, the indicator plots a supply zone from the most recent bullish candle — indicating where supply took control.
- Optional mitigation logic marks zones as mitigated (or deletes them) once price trades into the opposing side.
- Internal shift detection highlights swing highs and lows , labels structural points (HH, HL, LH, LL), and identifies potential liquidity sweeps .
Features:
- Dynamic plotting of rally-based demand zones and drop-based supply zones
- Toggle to use Highs/Lows or Close-based breaks for structure
- Support for LTF, MTF, and HTF analysis (with selectable timeframe)
- Zone mitigation logic with optional automatic cleanup
- Labeling of key swing points: HH , HL , LH , LL , and LS (Liquidity Sweep)
- Zigzag visualization for structure flow
- Alert-ready for internal shifts, BoS, and zone creation
- Separate styling options for BoS lines, internal shift shapes, and zone colors
How to Use:
- Set your desired HTF candle source (e.g., 1H or 4H) depending on your trading style.
- Use Highs/Lows mode for pure price action structure or Close mode for more conservative signals.
- Observe when a bullish break occurs — a demand zone will form where price previously dropped before rallying. Look for long opportunities if price revisits this zone.
- After a bearish break , a supply zone forms where the rally failed — use this to scout short entries on retests.
- Use BoS lines to confirm structure shifts and validate entry triggers or trend direction.
- Monitor mitigated zones for reduced reliability or avoid them completely by enabling automatic deletion.
- Use alerts to stay notified about key changes without watching the chart constantly.
Recommended Strategies:
- Smart money or ICT-style trading : identify institutional footprints and mitigation setups
- Reversal trading : catch price rejecting off unmitigated zones after structure break
- Trend continuation : enter in the direction of internal structure after pullbacks into zones
- Liquidity sweep confirmation : filter out false breaks using HH/LL with LS detection
Tips:
- Combine this indicator with a higher timeframe bias tool (e.g., moving average, higher timeframe market structure).
- For scalping, use tighter HTFs and reduce the zone duration.
- For swing trading, use larger HTFs (1H, 4H, Daily) and increase zone persistence.
Summary:
The Rally/Drop Market Structure indicator gives you an actionable framework for understanding price structure, market intent, and supply/demand imbalances. Whether you're looking for precision entries, trend confirmation, or smart money concepts, this tool helps simplify complex price behavior into clean, usable structure and zones.
