Absorption DetectorABSORPTION DETECTOR -
The Absorption Detector identifies institutional order flow by detecting "absorption" patterns where smart money quietly accumulates or distributes positions by absorbing retail order flow. This creates high-probability support and resistance zones for trading. This is an approximation only and does not read any footprint data.
WHAT IS ABSORPTION?
Absorption occurs when institutions take the opposite side of retail trades, creating specific candlestick patterns with high volume and significant wicks. The indicator identifies two main patterns:
SELLING ABSORPTION (P-Pattern): Red zones above candles where institutions sell into retail buying pressure, creating resistance levels. Look for high volume candles with large upper wicks that close in the lower half.
BUYING ABSORPTION (B-Pattern): Green zones below candles where institutions buy from retail selling pressure, creating support levels. Look for high volume candles with large lower wicks that close in the upper half.
KEY FEATURES
- Automatic detection of institutional absorption patterns
- Dynamic support and resistance zone creation
- Customizable styling for all visual elements
- Historic zone display for backtesting analysis
- Strength-based filtering to show only high-probability setups
- Real-time alerts for new absorption patterns
- Professional info panel with key statistics
- Multi-timeframe compatibility
MAIN SETTINGS
Volume Threshold (1.2): Minimum volume surge required compared to average. Higher values = fewer but stronger signals.
Minimum Volume (2500): Absolute volume floor to prevent signals during low-volume periods.
Min Wick Size (0.2): Minimum wick size as ATR multiple. Ensures significant rejection occurred.
Minimum Strength (1.5): Combined volume and wick strength filter. Higher values = higher quality signals.
Show Historic Zones (OFF): Enable to see all historical zones for backtesting. Disable for better performance.
Zone Extension (20): How many bars to project zones forward for anticipating future reactions.
TRADING APPROACH
ZONE REACTION STRATEGY: Wait for price to approach absorption zones and trade the bounce or rejection. Use the zones as dynamic support and resistance levels.
BREAKOUT STRATEGY: Trade decisive breaks of strong absorption zones with proper risk management. Failed zones often lead to strong moves.
CONFLUENCE TRADING: Combine absorption zones with other technical analysis for highest probability setups. Look for alignment with trend lines, Fibonacci levels, and key support/resistance.
RISK MANAGEMENT: Always use stop losses beyond the absorption zones. Target minimum 1:2 risk-reward ratios. Position size appropriately based on zone strength.
OPTIMIZATION GUIDE
For Conservative Trading (fewer, higher quality signals):
- Volume Threshold: 1.5
- Minimum Strength: 2.0
- Min Wick Size: 0.3
For Aggressive Trading (more signals, requires careful filtering):
- Volume Threshold: 1.1
- Minimum Strength: 1.0
- Min Wick Size: 0.15
BEST PRACTICES
Markets: Works best on liquid instruments with good volume - major forex pairs, popular stocks, liquid futures, and established cryptocurrencies.
Timeframes: Effective on all timeframes from 1-minute scalping to daily swing trading. Adjust settings based on your timeframe and trading style.
Confirmation: Never trade absorption signals in isolation. Always combine with trend analysis, market structure, and proper risk management.
Session Timing: Be aware of market sessions and avoid trading during low liquidity periods or major news events.
Backtesting: Use the historic zones feature to validate performance on your chosen market and timeframe before live trading.
CUSTOMIZATION
The indicator offers complete visual customization including zone colors, border styles, label appearances, and info panel positioning. All colors can be adapted to match your chart theme and personal preferences.
Alert system provides both basic and custom message alerts for real-time notifications of new absorption patterns.
PERFORMANCE NOTES
Default settings are optimized for most markets and timeframes. For best performance on older charts, keep "Show Historic Zones" disabled unless specifically backtesting.
The indicator maintains excellent performance even with extensive historical analysis enabled, handling up to 500 zones and 100 labels for comprehensive backtesting.
Multitimeframe

JXMJXRS - Mean Reversion Bands ToolThis indicator highlights when price is likely overextended and may revert back toward its average. It does this by plotting a central mean (EMA, SMA, or VWAP) with dynamic bands based on either standard deviation or ATR. These bands help show how far price has moved from normal levels.
When price moves beyond the outer bands, the background highlights in red or green to signal possible exhaustion. An optional setting allows the highlight to trigger only if the full candle body breaks beyond the band, helping reduce noise from small spikes or wicks.
The inner bands show more moderate overextensions, while the outer bands focus on stronger, less frequent moves. This makes the tool useful in both ranging and trending environments.
The indicator also includes a hidden oscillator that measures how far price is from the mean in standardized units. It stays off by default but can be enabled by advanced users if needed.
This tool works best on higher timeframes, such as the daily chart. It is not a buy or sell signal, but a way to add context and filter low-quality setups by focusing only on significant price extensions.
A red background appears when price closes significantly above the upper volatility band. This suggests that price is stretched far above its normal range and may be entering an overbought or exhausted state. A green background appears when price closes significantly below the lower volatility band, indicating a potential oversold condition. These zones highlight areas where a price reversion or slowdown may be more likely based on statistical extremes.

Multi-Timeframe Bands (Horizontal Table, Robust, No get_cols)Mulit-timeframe /Kelt Bands with Table Price tracker
This is a simple Kelt style Band indicator draws colored horizontal bands representing the high (top) and low (bottom) for each of the following timeframes:
4h: Blue (bottom), Red (top)
1D: Gold (bottom/top)
1W: Purple (bottom/top)
1M: Orange (bottom/top)
Quarterly: Light purple (bottom/top)
The script works on any chart timeframe, and the bands will update dynamically.
I've added a horizontal box to show the corresponding prices at the top.

Auto LevelsSimple auto level tracker that automatically detects and plots the high/low for the current week, day, and month, as well as the previous week/day/month.
Includes a built-in dashboard that shows how close or far price is from each level, along with directional guidance (above/below). The closest level to current price is automatically highlighted for quick awareness.
Everything is fully toggleable to only show the levels and info that is needed.

Ultra Supply & DemandUltra Supply and Demand fixed.
Order Block Detection: Identifies potential order blocks (demand/supply zones)

Multi-Timeframe Bands (final, with labels)This is a simple Kelt style Band indicator draws colored horizontal bands representing the high (top) and low (bottom) for each of the following timeframes:
4h: Blue (bottom), Red (top)
1D: Gold (bottom/top)
1W: Purple (bottom/top)
1M: Orange (bottom/top)
Quarterly: Light purple (bottom/top)
The script works on any chart timeframe, and the bands will update dynamically.

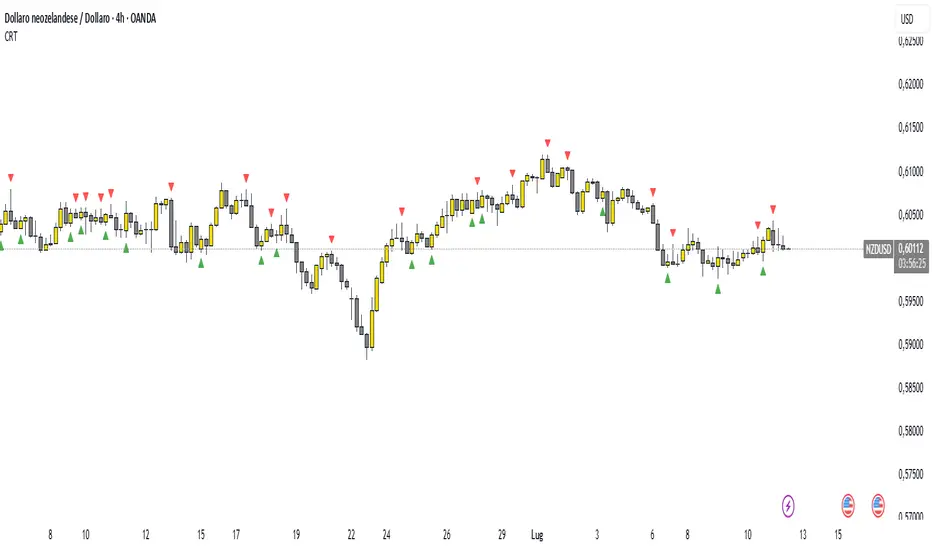
Candle Range Theory (CRT) indicator📌 Indicator Name: Candle Range Theory (CRT) indicator
This indicator detects potential bullish and bearish reversal setups based on specific candlestick price action behavior. It is designed to highlight moments when the market may be rejecting extremes and preparing to reverse direction — but only after confirmation with the closing price.
🔍 How It Works:
Bullish Setup (Long Signal):
The previous candle is bearish (closes lower than it opens).
The current candle makes a lower low than the previous one.
The current candle closes above the previous candle’s close.
Bearish Setup (Short Signal):
The previous candle is bullish (closes higher than it opens).
The current candle makes a higher high than the previous one.
The current candle closes below the previous candle’s close.
Signals are only triggered after the bar is fully closed, to avoid premature entries.
🔔 The script includes alert conditions for both long and short setups so you can receive notifications instantly.
🎥 Inspiration:
The idea for this indicator came from the excellent educational content presented in this video:
"How to Read Candlesticks Like a Pro"
We highly recommend watching it to better understand the price action principles behind this signal.
HTF Candle Extremes Zigzag (Drawn on LTF)HTF Candle Extremes Zigzag (Drawn on LTF)
This indicator plots zigzag lines connecting the extremes (highs and lows) of Higher Timeframe (HTF) candles directly on your lower timeframe (LTF) chart. It visually highlights trend changes and HTF candle structure by drawing colored lines representing uptrends and downtrends based on HTF candle extremes.
"Key Features"
Higher Timeframe Tracking: Select any HTF to track candle extremes using the built-in security function.
Zigzag Lines: Connects HTF candle lows to highs in an intuitive zigzag pattern.
Trend Indication: Uptrend lines are green, downtrend lines are red (customizable colors).
Customizable Line Width: Adjust the thickness of the zigzag lines for better visibility.
Drawn on Lower Timeframe: All lines appear on your active lower timeframe chart, allowing easy visual correlation.
"How It Works"
The script fetches the open, high, low, close, and time data of the specified HTF candle. It detects new HTF bars and identifies trend direction changes by comparing the highs and lows of consecutive HTF candles.
- When an uptrend is detected, vertical lines are drawn from low to high of the HTF candle, connected to the previous extreme low.
- When a downtrend is detected, vertical lines are drawn from high to low, connected to the previous extreme high.
- Transitions between trends are highlighted by connecting the last extreme of the previous trend to the current extreme, creating a clean zigzag pattern.
Usage Notes:
Ideal for traders who want to visualize HTF market structure and trend changes while analyzing price action on lower timeframes.
---
© The_Forex_Steward
(mozilla.org)

AlgoTradar MACD (Auto-Optimized)Description
This is the AlgoTradar MACD (8H Optimized) indicator, a finely-tuned tool based on the classic MACD crossover strategy.
The script is designed to provide clear, actionable signals for both manual and automated trading systems.
How to Use
Apply to Chart: For the best results, apply this indicator to your chart on the 8-hour (8H) timeframe. Using it on other timeframes may produce less reliable signals as the parameters are tailored for 8H.
Interpret the Signals:
🚀 BUY Signal: A green "BUY" label appears when the blue MACD line crosses above the orange Signal line. This indicates potential bullish momentum.
📉 SELL Signal: A red "SELL" label appears when the blue MACD line crosses below the orange Signal line. This indicates potential bearish momentum.
Confirmation is Key: This indicator should not be used in isolation. Always use it in conjunction with other analysis methods, such as trend lines, support and resistance levels, or other indicators, to confirm signals before entering a trade.

Multiple MAs for Daily and IntradayMultiple DMAs (5, 8, 10, 21, 50, 65, 200) and their equivalent in lower timeframes (3min, 30min, 65min) with the options to select from SMA or EMA.

JXMJXRS - Anchor Bias ToolThe Anchor Bias Tool is a precision-based market structure tool designed to help traders visually quantify bias from any significant market event. Rather than relying on subjective trendlines or reactive signals, this tool lets you define a specific candle. Typically tied to a news event, breakout, or key swing point and then monitor how price behaves from that point forward.
You set an anchor candle using a specific date and time (UTC). The tool draws a horizontal anchor line at the closing price of that candle, calculates real-time price deviation from that level as a percentage, and then identifies whether price is in a bullish, bearish, or neutral zone based on how far it has moved from the anchor. This creates a clear, objective method for assessing whether the market is following through on an event or fading it.
Anchor Time (UTC) -
Define the exact candle you want to anchor from typically a reaction to a news event, breakout, or structural shift. All bias calculations begin from this candle’s closing price.
Bias Threshold (%) -
Sets how far price must move away from the anchor to be considered a valid directional bias. For example, 2.0% means price must be at least 2% above or below the anchor to enter bullish or bearish territory.
Show Bias Zones -
Toggles visual background shading on the chart. Green represents bullish bias, red for bearish. Helping you quickly identify where the market stands relative to the anchor.
Show Bias Labels -
Enables or disables the live label showing current bias (Bullish, Bearish, or Neutral) along with the real-time % deviation from the anchor level

SEVEN THIRTY### 🕖 **Seven Thirty Strategy — Automated Trend Reversal System**
**Overview:**
The *Seven Thirty* strategy is a fully automated trend-following reversal system designed for TradingView and integrated with platforms like WunderTrading for hands-free execution. It enters trades on EMA crossovers with smart risk management and automatically reverses position when trends shift.
**Key Features:**
* 📈 **EMA Cross Entry:** Trades are opened immediately on confirmed EMA crossovers, no delay or buffer.
* 🛑 **Smart Stop Loss:** Stop is dynamically placed at the second most recent swing high/low (Gann F2 logic).
* 🎯 **Take Profit Targets:** Partial take profits (TP1/TP2/TP3) can be enabled based on user-defined percentages.
* 🔄 **Auto-Reverse Logic:** When a stop is hit, the strategy flips into a new position in the opposite direction.
* 📉 **2% Risk Per Trade:** Dynamic position sizing based on distance to stop ensures consistent portfolio risk.
* 🧠 **Optional Momentum Filter:** Adjustable trend/momentum filter to avoid choppy conditions.
* 🔁 **Works on Any Asset:** Designed to function across all markets and timeframes with minimal tweaking.
**Automation-Ready:**
This strategy is built for direct integration with automated bots like WunderTrading. Alerts include webhook-ready comments for:
* ENTER LONG
* EXIT LONG
* ENTER SHORT
* EXIT SHORT
**Best Timeframes:**
Optimized for 4H and Daily charts but works well on any timeframe when fine-tuned.

JXMJXRS - EMA Break VelocityEMA Breaks Velocity is a crypto-focused indicator that detects strong momentum breakouts using EMA crossover logic combined with a velocity filter. It is designed to help avoid fakeouts and only react to meaningful price action.
This tool calculates two EMAs (default 20 and 50) and identifies when they cross. However, a signal is only triggered if the price also moves a minimum percentage within the same candle. This ensures that breakouts are only flagged when accompanied by significant momentum.
A bullish breakout is detected when the fast EMA crosses above the slow EMA and the candle’s open-to-close percentage gain exceeds the velocity threshold. A bearish breakout is the opposite. The default velocity threshold is 1.5 percent, but this can be adjusted in the settings.
When a breakout condition is met, a triangle is plotted on the chart to indicate the entry signal. If an EMA crossover happens but the candle is too weak, a light warning label appears to signal a low-strength move that should be treated cautiously.
This indicator works well on 5-minute to 1-hour charts and is ideal for high-volatility altcoins and major pairs like BTC and ETH. Alerts are included for both bullish and bearish velocity-confirmed breakouts.
You can adjust the EMAs and velocity threshold to better suit different market conditions or pairs.
Labels will only remain when breakout strength is confirmed. Quick fades or fakeouts may cause labels to appear briefly and disappear, highlighting potential market indecision during the breakout.

Range Filter Buy & Sell 5min + Multi-TF DashboardElevate your edge with Range Filter Buy & Sell 5min + Multi-TF Dashboard—a precision-engineered trend companion that scans your favorite markets from the 5-minute tick to the higher-timeframe horizon. By harmonizing short-term signals with the broader trend, it delivers crystal-clear buy and sell cues—and the confidence to act on them. Whether you’re scalping, swing trading, or investing for the long haul, this all-in-one dashboard empowers you to ride only the strongest trends and step aside before the noise hits. Trade smarter. Trade with clarity. Trade with conviction.

Daily, Weekly, Monthly Current/Average RangeThe "Daily, Weekly, Monthly Current/Average Range" calculates and displays current and average price ranges (high - low) for daily, weekly, and monthly timeframes in a customizable table.
Users can adjust the lookback period, table size, and font color, with the table updating on the last bar for efficiency.
When the current range exceeds the average for a timeframe, the corresponding cell highlights green, signaling price possibly reaching maximum expansion and potential retracement or consolidation may follow.

KHAN ULTIMATEMost Versatile Indicator working on all assets and Time frames, with Two Buy entry Triggers when favorable conditions are met.
Just follow the Labels and exit Long when Sell appears or Price crosses below the Blue line, on the short side enter with Sell and exit when price crosses above the Fuchsia line.
Disclaimer : As everyone knows that indicators are lagging in Nature and always follows the Price action and Price never follows the indicators so a Buy/Sell triggers never guarantees a successful trade, market conditions and several other factors are also needs to be considered and always follow Risk management.
for any clarifications DM me.
I( author) have no responsibility for Profit/Loss booked by using this Indicator, User is solely responsible. for it,

َUSDJPY - 3min - One Trade Per Day - LA timezone📌 USDJPY - 3min - One Trade Per Day - LA TimeZone
**🔵 High-Confidence Strategy with Over 75% Win Rate**
A minimalistic and consistent breakout trading system designed around the **Los Angeles market open**.
This strategy provides one highly filtered trade signal per day, helping you avoid noise and overtrading.
---
## ✅ Key Benefits
- 🔁 Only **one trade per day** – clean and focused approach
- ⏱ Optimized for **3-minute, 5-minute, and 15-minute** charts
- 🎯 Default **Take-Profit / Stop-Loss: 0.35%** (fully customizable)
- 🌎 Works on charts set to **Los Angeles timezone**
- 🧘 Ideal for **calm, structured, and part-time trading routines**
- 💼 Designed especially for **USDJPY** but may be applied to other high-volume FX pairs
---
## ⚙️ Settings Overview
- Opening Session Start Time (in LA time)
- Opening Range Duration (in minutes)
- Take-Profit and Stop-Loss percentages
- Force Close Time
- Trade Direction (Buy Only / Sell Only / Both)
---
## 💡 Who Is It For?
- Traders looking to simplify their day
- Those seeking **low-risk, steady profits**
- Anyone tired of chasing every move in the market
- FX traders who prefer **precision over frequency**
---
> 📌 **Note:** To ensure correct performance, set your TradingView chart’s timezone to **Los Angeles**.
---
### 🔵 Simple. Calm. Reliable.

Signalgo MASignalgo MA
Signalgo MA is a next-generation indicator for TradingView that redefines moving average (MA) trading by combining multi-timeframe logic, trend strength filtering, and adaptive trade management. Here’s a deep dive into how it works, its unique features, and why it stands apart from traditional MA indicators.
How Signalgo MA Works
1. Multi-Timeframe Moving Average Analysis
Simultaneous EMA & SMA Tracking: Signalgo MA calculates exponential (EMA) and simple (SMA) moving averages across a wide range of timeframes—from 1 minute to 3 months.
Layered Cross Detection: It detects crossovers and crossunders on each timeframe, allowing for both micro and macro trend detection.
Synchronized Signal Mapping: Instead of acting on a single crossover, the indicator requires agreement across multiple timeframes to trigger meaningful signals, filtering out noise and false positives.
2. Trend Strength & Quality Filtering
ADX Trend Filter: Trades are only considered when the Average Directional Index (ADX) confirms a strong trend, ensuring signals are not triggered during choppy or directionless markets.
Volume & Momentum Confirmation: For the strongest signals, the system requires:
A significant volume spike
Price above/below a longer-term EMA (for buys/sells)
RSI momentum confirmation
One-Time Event Detection: Each crossover event is flagged only once per occurrence, preventing repeated signals from the same move.
Inputs & User Controls
Preset Parameters:
EMA & SMA Lengths: Optimized for both short-term and long-term analysis.
ADX Length & Minimum: Sets the threshold for what is considered a “strong” trend.
Show Labels/Table: Visual toggles for displaying signal and trade management information.
Trade Management:
Show TP/SL Logic: Toggle to display or hide take-profit (TP) and stop-loss (SL) levels.
ATR Length & Multipliers: Fine-tune how SL and TP levels adapt to market volatility.
Enable Trailing Stop: Option to activate dynamic stop movement after TP1.
Entry & Exit Strategy
Entry Logic
Long (Buy) Entry: Triggered when multiple timeframes confirm bullish EMA/SMA crossovers, ADX confirms trend strength, and all volume/momentum filters align.
Short (Sell) Entry: Triggered when multiple timeframes confirm bearish crossunders, with the same strict filtering.
Exit & Trade Management
Stop Loss (SL): Automatically set based on recent volatility (ATR), adapting to current market conditions.
Take Profits (TP1, TP2, TP3): Three profit targets at increasing reward multiples, allowing for flexible trade management.
Trailing Stop: After TP1 is hit, the stop loss moves to breakeven and a trailing stop is activated to lock in further gains.
Event Markers: Each time a TP or SL is hit, a visual label is placed on the chart for full transparency.
Strict Signal Quality Filters: Signals are only generated when volume spikes, momentum, and trend strength all align—dramatically reducing false positives.
Adaptive, Automated Trade Management: Built-in TP/SL and trailing logic mean you get not just signals, but a full trade management suite—rarely found in standard MA indicators.
Event-Driven, Not Static: Each signal is triggered only once per event, eliminating repetitive or redundant entries.
Visual & Alert Integration: Every signal and trade event is visually marked and can trigger TradingView alerts, keeping you informed in real time.
Trading Strategy Application
Versatility: Suitable for scalping, day trading, swing trading, and longer-term positions thanks to its multi-timeframe logic.
Systematic Execution: By automating entries, exits, and risk management, Signalgo MA helps you trade with discipline and confidence, minimizing emotional bias.
Noise Reduction: The advanced, layered filtering logic means you only see the highest-probability setups, helping you avoid common MA “fakeouts” and overtrading.

FLUID-TRADES SMC Indicator that works on All TF and assets Trade, source code is Hidden but other adjustments can be made

Signalgo S&DSignalgo S&D
Signalgo S&D is a next-generation indicator designed for traders who want to harness the true power of supply and demand (S&D) in their trading decisions. Unlike traditional S&D indicators, it leverages proprietary multi-timeframe net volume analysis, trend confirmation, and adaptive trade management.
How Signalgo S&D Works
Multi-Timeframe Net Volume Analysis
Net Volume Calculation: At the heart of Signalgo S&D is a unique net volume engine. It doesn’t just look at price or raw volume, but calculates a net volume value for each bar, factoring in both price movement and the true range of the candle. This is done across multiple timeframes—from 1 minute to 3 months—giving a layered, real-time view of market pressure.
Trend Measurement: The indicator tracks changes in net volume over a customizable trend length, identifying when buying or selling pressure is truly shifting.
Intelligent Signal Generation
Directional Shifts: Buy and sell signals are only considered when net volume flips from negative to positive (or vice versa) and the net volume trend confirms the move.
Multi-Timeframe Confirmation: Strong signals require agreement across several timeframes, filtering out noise and dramatically increasing reliability.
Volume & Momentum Filters: Each signal is further filtered using volume spikes, EMA alignment, and RSI momentum, ensuring that only high-quality, high-probability setups are flagged.
One-Time Event Detection: Signals are triggered only once per event, preventing repeated entries on the same move.
Adaptive Trade Management
Automated Entry/Exit Logic: Every trade signal is paired with a fully automated take-profit (TP), stop-loss (SL), and trailing stop system, all dynamically adjusted to current volatility.
Risk-Reward Scaling: Three profit targets (TP1, TP2, TP3) allow for scaling out or partial exits, while trailing stops lock in gains as the trade progresses.
Visual Feedback: All trade events—entries, exits, TPs, SLs—are clearly marked on the chart for transparency and review.
Inputs & User Controls
Preset Parameters:
Trend Length: Controls how sensitive net volume trend detection is.
Show Labels/Table: Visual toggles for displaying signal and trade management information.
Trade Management:
Show TP/SL Logic: Toggle to display or hide trade management levels.
ATR Length & Multipliers: Fine-tune how SL and TP levels adapt to market volatility.
Enable Trailing Stop: Activate or deactivate dynamic stop movement after TP1.
Entry & Exit Strategy
Entry Logic
Long (Buy) Entry: Triggered when net volume flips positive across multiple timeframes, the trend confirms, and all momentum/volume filters align.
Short (Sell) Entry: Triggered when net volume flips negative across multiple timeframes, with trend and momentum confirmation.
Exit & Trade Management
Stop Loss (SL): Automatically set based on recent volatility (ATR), adapting to the current market environment.
Take Profits (TP1, TP2, TP3): Three profit targets at increasing reward multiples, allowing for flexible trade management.
Trailing Stop: After TP1 is hit, the stop loss moves to breakeven and a trailing stop is activated to lock in further gains.
Event Markers: Each time a TP or SL is hit, a visual label is placed on the chart for full transparency.
Multi-Timeframe Synchronization: Instead of focusing on a single timeframe, this indicator requires confirmation across several, providing a market-wide perspective and filtering out false signals.
Dynamic, Adaptive Management: The built-in TP/SL and trailing logic is not static—it adapts to volatility and market conditions, providing a disciplined, automated approach to exits and risk.
Event-Driven, Not Static: Signals are only generated when all conditions align, and each event is marked only once, eliminating repetitive or redundant signals.
Advanced Filtering: Signals are filtered by volume spikes, EMA and RSI momentum, and trend alignment, ensuring only the highest-quality trades are considered.
Visual & Alert Integration: Every signal and trade event is visually marked and can trigger TradingView alerts, keeping you informed in real time.
Trading Strategy Application
Versatility: Suitable for scalping, day trading, swing trading, and even longer-term positions thanks to its multi-timeframe logic.
Systematic Execution: By automating entries, exits, and risk management, Signalgo S&D helps you trade with discipline and confidence, minimizing emotional bias.
Noise Reduction: The advanced, layered filtering logic means you only see the highest-probability setups, helping you avoid common S&D “fakeouts” and overtrading.

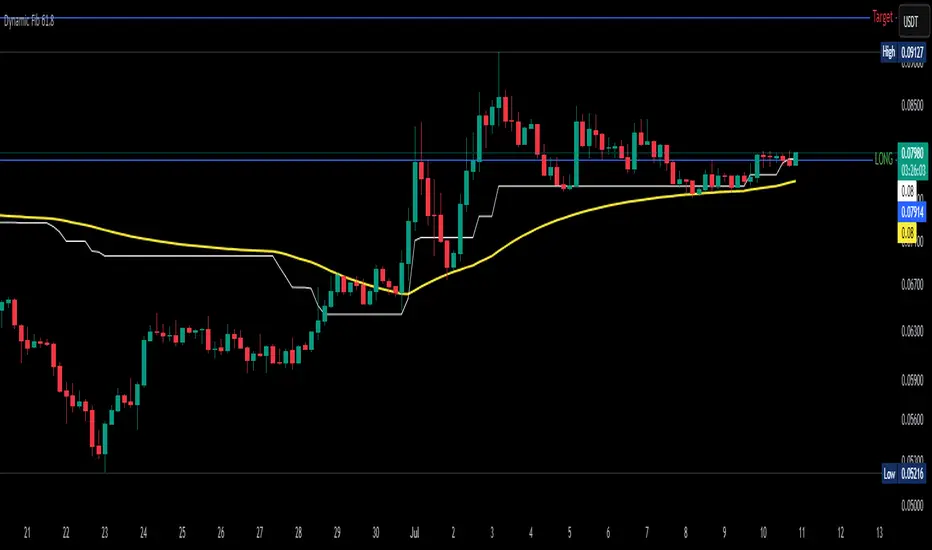
Dynamic Fib 61.8Dynamic Fib 61.8 Indicator – Full Guide
1. Overview
This indicator plots a dynamic 61.8% Fibonacci retracement level, adjusted for market volatility and smoothed using an EMA for cleaner signals. Unlike traditional static Fib levels, this version auto-adjusts based on recent price swings, making it more responsive to changing market conditions.
Key Features:
✅ Auto-Adjusting 61.8% Fib Level – Adapts to the highest high/lowest low over a user-defined period.
✅ EMA Smoothing – Reduces noise for more reliable support/resistance.
✅ Breakout Alerts – Built-in alerts for when price crosses the Fib level.
✅ Inverse Chart Support – Works on both regular and inverse price scales.
2. How to Use This Indicator
Primary Use Case:
Trend Retracement Entry: The 61.8% level often acts as a reversal zone in trending markets.
Breakout Confirmation: A decisive close above/below the smoothed Fib level suggests trend continuation.
Support/Resistance Flip: Watch for price reactions at this level for intraday/swing trades.
Input Parameters:
Input Default Description
Lookback Period 52 Determines how far back the highest high/lowest low is calculated. Higher = slower reaction, lower = more sensitive.
EMA Smoothing 3 Controls how much the Fib level is smoothed (higher = smoother but laggier).
Invert Price Scale Off Flips the calculation for inverse charts (e.g., for crypto perpetuals).
3. Interpretation & Trading Rules
Bullish Scenario (Buy Dips):
Price retraces to the smoothed Fib 61.8 level in an uptrend.
Confirmation: Wait for bullish candlestick patterns (hammer, engulfing) or RSI > 50.
Entry: Long on a bounce, stop-loss below recent swing low.
Bearish Scenario (Sell Rallies):
Price retraces to the smoothed Fib 61.8 level in a downtrend.
Confirmation: Bearish rejection (shooting star, bearish engulfing) or RSI < 50.
Entry: Short on rejection, stop-loss above recent swing high.
Breakout Trading:
If price closes decisively above/below the smoothed Fib level, it may signal trend continuation.
Volume & Momentum Confirmation: Use with MACD/RSI for stronger signals.
4. Best Confluence Indicators
This indicator works best when combined with:
A. Momentum Oscillators
RSI (14):
Look for oversold (RSI < 30) near Fib support in uptrends.
Look for overbought (RSI > 70) near Fib resistance in downtrends.
MACD:
Bullish: MACD crossing above signal line near Fib support.
Bearish: MACD crossing below signal line near Fib resistance.
B. Volume Analysis
Volume Spike + Fib Bounce = Strong Reversal Signal
Low Volume at Fib Retest = Potential Fakeout
C. Moving Averages
50 EMA/200 EMA Alignment:
If price is above 200 EMA and retests Fib 61.8, it’s a high-probability long.
If price is below 200 EMA and rejects Fib 61.8, it’s a high-probability short.
D. Price Action Patterns
Engulfing, Pin Bars, Inside Bars at the Fib level add confirmation.
5. Example Strategy
Setup:
Trend Identification – Price is above 200 EMA (uptrend).
Retracement to Smoothed Fib 61.8 – Price pulls back to the dynamic level.
Confirmation – Bullish hammer forms + RSI > 50.
Entry – Buy with stop below recent swing low.
Target – Previous high or 1.618 Fib extension.
6. Limitations & Adjustments
Choppy Markets: The Fib level may give false signals (use ATR filter).
Optimal Period Adjustment:
For day trading, reduce Lookback Period (e.g., 20-30).
For swing trading, increase (e.g., 50-100).
EMA Smoothing: If too slow, increase smoothing to 5-10.
Final Thoughts
This indicator is best used as a dynamic support/resistance tool rather than a standalone system. Combining it with momentum filters, volume, and price action significantly improves accuracy.
Signalgo S/RSignalgo S/R
Signalgo S/R is a cutting-edge TradingView indicator engineered for traders who want to leverage support and resistance (S/R) in a way that goes far beyond traditional methods. This overview will help you understand its unique approach, inputs, entry and exit strategies, and what truly sets it apart.
How Signalgo S/R Works
Multi-Timeframe S/R Detection
Layered Analysis: Signalgo S/R continuously scans price action across a wide spectrum of timeframes, from 1 minute up to 3 months. This multi-layered approach ensures that both short-term and long-term S/R levels are dynamically tracked and updated.
Advanced Pivot Recognition: Instead of simply plotting static lines, the indicator uses a sophisticated pivot recognition system to identify only the most relevant and recent S/R levels, adapting as the market evolves.
Synchronized Structure: By aligning S/R levels across timeframes, it builds a robust market structure that highlights truly significant zones—areas where price is most likely to react.
Intelligent Breakout & Reversal Signals
Close Confirmation: The indicator only triggers a breakout or breakdown signal when price not just touches, but closes beyond a key S/R level, dramatically reducing false signals.
Multi-Timeframe Confirmation: True buy or sell signals require agreement across several timeframes, filtering out noise and improving reliability.
One-Time Event Detection: Each breakout or breakdown is recognized only once per occurrence, eliminating repetitive signals from the same event.
Inputs & User Controls
Preset Parameters:
Pivot Length: Adjusts how sensitive the S/R detection is to price swings.
Label Offset: Fine-tunes the placement of visual labels for clarity.
Trade Management Controls:
Show TP/SL Logic: Toggle to display or hide take-profit (TP) and stop-loss (SL) levels.
ATR Length & Multipliers: Adapt SL and TP distances to current volatility.
Enable Trailing Stop: Option to activate dynamic stop movement after TP1 is reached.
Entry & Exit Strategy
Entry Logic
Long (Buy) Entry: Triggered when multiple timeframes confirm a breakout above resistance, signaling strong upward momentum.
Short (Sell) Entry: Triggered when multiple timeframes confirm a breakdown below support, indicating strong downward momentum.
Exit & Trade Management
Stop Loss (SL): Automatically set based on recent volatility, always adapting to current market conditions.
Take Profits (TP1, TP2, TP3): Three profit targets are set at increasing reward multiples, allowing for partial exits or scaling out.
Trailing Stop: After the first profit target is reached, the stop loss moves to breakeven and a trailing stop is activated, locking in gains as the trade continues.
Event Markers: Each time a TP or SL is hit, a visual label is placed on the chart for full transparency.
What Separates Signalgo S/R from Traditional S/R Indicators?
True Multi-Timeframe Synchronization: Most S/R tools only look at a single timeframe or plot static levels. Signalgo S/R dynamically aligns levels across all relevant timeframes, providing a comprehensive market map.
Event-Driven, Not Static: Instead of plotting every minor swing, it intelligently filters for only the most actionable S/R levels and signals—reducing chart clutter and focusing attention on what matters.
Breakout Confirmation Logic: Requires a close beyond S/R, not just a wick, to validate breakouts or breakdowns. This greatly reduces false positives.
Automated, Adaptive Trade Management: Built-in TP/SL and trailing logic mean you get not just signals, but a full trade management suite—something rarely found in standard S/R indicators.
Visual & Alert Integration: Every signal, TP/SL event, and trailing stop is visually marked and can trigger TradingView alerts, keeping you informed in real time.
Trading Strategy Application
Scalping to Swing Trading: The multi-timeframe logic makes it suitable for all trading styles, from fast intraday moves to longer-term position trades.
Systematic, Disciplined Execution: By automating entries, exits, and risk management, Signalgo S/R helps you trade with confidence and consistency, removing emotion from the process.
Noise Reduction: The advanced filtering logic means you only see the highest-probability setups, helping you avoid common S/R “fakeouts.”

Signalgo XSignalgo X
Signalgo X is a sophisticated indicator crafted for traders who demand a disciplined, multi-layered approach to market analysis and trade management. This overview will help you understand its capabilities, logic, and how it can elevate your trading.
Core Concept
Signalgo X is built to:
Scan multiple timeframes simultaneously for price, volume, and volatility patterns.
Filter out unreliable signals during periods of market hype or manipulation.
Automate trade management with dynamic take-profit (TP), stop-loss (SL), and trailing logic.
Deliver actionable, visual signals and alerts for timely, confident decisions.
Inputs & Controls
Preset System Parameters:
News Sensitivity: Determines how responsive the indicator is to price moves.
Hype Filter Strength: Sets how aggressively the system avoids volatile, manipulated, or news-driven periods.
User-Configurable:
Show TP/SL Logic: Turn on/off the display of take-profit and stop-loss levels directly on your chart.
How Signalgo X Works
1. Multi-Timeframe Market Analysis
Signalgo X continuously monitors:
Closing price
Trading volume
Volatility (ATR)
across six distinct timeframes, from 1 hour to 3 months. This layered approach ensures that signals are validated by both short-term momentum and long-term trends.
2. Price, Volume, and Volatility Synthesis
Price Change: The system tracks percentage changes over each timeframe to gauge momentum.
Volume Ratio: By comparing current volume to a moving average, it detects unusual spikes that may signal institutional activity or manipulation.
Volatility: Measures the intensity of price movements relative to average ranges, helping to identify breakout or exhaustion scenarios.
3. Proprietary Anti-Hype Filter
A unique scoring mechanism evaluates:
Volume spikes without corresponding price action
Sudden jumps in volatility
Conflicting signals across timeframes
Social hype proxies (e.g., sharp moves on low volume)
If the market is deemed “hyped,” all trading signals are suppressed and a clear warning is shown, keeping you out of unpredictable conditions.
4. Signal Classification & Mapping
Significant Moves: Only price actions that exceed a sensitivity threshold and are confirmed by volume/volatility are considered.
Bullish/Bearish Signals: Generated for each timeframe.
Signal Strength: Categorized as regular, or strong based on multi-timeframe agreement.
Entry & Exit Strategy
Entry Logic
Long (Buy) Entry: Triggered when bullish signals are detected (of any strength) and no hype is present.
Short (Sell) Entry: Triggered when bearish signals are detected and no hype is present.
Exit & Trade Management
Stop Loss (SL): Placed at a calculated distance from entry, adapting to recent volatility.
Take Profits (TP1, TP2, TP3): Three profit targets, each at a greater reward multiple.
Trailing Stop: After the first take-profit is hit, the stop-loss moves to breakeven and a trailing stop is activated to protect further gains.
Event Tracking: The indicator visually marks when each TP or SL is hit, providing real-time feedback.
Chart Plots: All relevant SL, TP, and trailing stop levels are clearly marked for both long and short trades.
Labels: Entry, exit, and signal strength events are color-coded and visually prominent.
Alerts: Built-in alert conditions allow you to set up TradingView notifications for strong/regular buy/sell signals and hype warnings.
Trading Strategy Application
Multi-Timeframe Confirmation: Only strong signals confirmed by several timeframes are acted upon, reducing false positives.
Volume & Volatility Awareness: The indicator avoids low-quality, “fakeout” signals by requiring confirmation from both price and volume/volatility.
Hype Avoidance: Keeps you out of the market during news-driven or manipulated periods, helping to protect your capital.
Automated Discipline: The TP/SL logic enforces a rules-based exit strategy, helping you lock in profits and limit losses without emotional interference.
Who Should Use Signalgo X?
Signalgo X is ideal for traders who want:
Systematic, high-confidence signals
Automated and disciplined trade management
Protection against unpredictable market events
Clear, actionable visuals and alerts
