Opening Lines (M15, H1 & H4) with Wickless Candle DetectorTailored for day traders, this technical analysis indicator serves as a multi-timeframe opening price visualization tool, displaying real-time and historical opening price levels across three distinct time intervals to enhance pattern identification and strategic decision-making. Additionally, the tool incorporates a ‘Wickless Candle Detector’ feature, which annotates candles that open without upper or lower wicks. Empirical observations suggest these wickless candles often act as future price magnets, particularly in index futures such as the Nasdaq and S&P500, making them critical reference points for market analysis.
Key Features:
1) Multi-Timeframe Opening Price Visualization:
◦ Plots horizontal reference lines for opening prices across:
✓ 15-minute (M15)
✓ 1-hour (H1)
✓ 4-hour (H4) timeframes
◦ Lines dynamically extend throughout their respective periods or can be configured to a fixed bar offset
2) Wickless Candle Detection:
◦ Automatically marks wickless candles with a discrete symbol at their opening price level
◦ Symbols are removed upon either:
✓ Price breaching the opening level by ≥1 tick
✓ A 24-hour expiration period (whichever occurs first)
3) Customization and Flexibility:
◦ Toggle visibility for individual timeframes, historical opening lines, and the Wickless Candle Detector
◦ Full customization of visual elements (colors, line styles, symbols) to align with user preferences or trading platform themes
Multitimeframe

cd_mtg_CxThis indicator is designed to show discount / premium zones and price gaps (fvg) on the screen within a rule.
Overview:
As it is known, the price continues its movement with swings and uses some zones to continue or reverse its movement. Commonly used of these zones are named by different traders such as supply / demand, order block, suport/ resistance zone. And again, many traders prefer to be involved in the entry when the price determined with the help of market structure reaches the premium / discount zones.
Expectation from the indicator and how it works:
Identify areas where the price is likely to react.
Zones to be determined for this purpose:
1- Discount / premium zones
2- Mitigation zones with price retesting
3- Price gaps (FVG's)
How is it determined?
1- Tracks the price in the higher timeframe it is alignment with, when the price violates the previous candle in the new candle (high/low), the previous candle's zones between top/bottom - middle levels.
high - middle => premium zone
low - middle => discount zone
and displays it on the screen.
2- Mitigation zones: When the price retests the discount/premium zones, those zones appear on the screen by extending to the last bar and are named as mitigation zones in the indicator.
3- Price gaps (FVG's): It is shown on the screen with known rules and higher time frame option.
Zones where the price does not respect are deleted from the display.
Settings:
- HTF for mitigation zones : Alignment high time frame selection
- HTF for FVG zones : Alignment high time frame selection
- Show HTF boxes : Show / hide
- Show Mitigation zones : Show / hide
- Show Discount/Premium zones: Show / hide
- Show FVG zones : Show / hide
And colors….
Screenshots and example :
The 15m chart is open on the screen and I select the alignment time zone H4. I select the higher time zone H1 in FVGs.
Screenshot with Show HTF boxes and Show FVG zones selected:
With show discount / premium zones selected :
With show mitigation zones selected :
Final Word : When the price comes to our zone, we take action together with other confirmations.
Our expectation from the zones is to send the price back to the region it came from.
If it is not successful, we should plan a reverse transaction.
Cheerful trades...
-- Türkçe Açıklama
Bu indikatör, bir kural dahilinde ucuzluk / pahalılık bölgelerini ve fiyat boşluklarını (fvg) ekranda göstermek ve traderlara en uygun yerde işlem fırsatı sunmak üzere tasarlanmıştır.
Genel Bakış :
Bilindiği gibi fiyat hareketine salınımlarla devam eder ve hareketine devam etmek ya da tersine dönmek için bazı bölgeleri kullanır. Bu bölgelerin yaygın şekilde kullanılanları supply / demand, order block , support /resistance zone gibi farklı ekollerce adlandırılmıştır. Ve yine birçok trader market yapısı yardımla belirlediği fiyatın ucuzluk / pahalılık bölgelerine gelmesiyle işleme dahil olmayı tercih eder.
İndikatörden beklenti ve nasıl çalışır:
Beklenti; Fiyatın tepki alması muhtemel bölgeleri belirlemesidir.
Bu amaçla belirleyeceği bölgeler:
1- Ucuzluk / pahalılık bölgeleri
2- Fiyatın tekrar test etmesiyle “mitigasyon bölgeleri/mitige”
3- Fiyat boşlukları (FVG ler)
Nasıl belirler ?
1- Fiyatı uyumlu olduğu üst zaman diliminde takip eder, fiyat yeni mumda bir önceki mumu ihlal ettiğinde (high/low), önceki mumun tepe/dip - orta seviyeleri arasında kalan bölgeleri
high - middle => premium zone
low - middle => discount zone
olarak belirler ve ekranda gösterir.
2- Mitigasyon bölgesi: Fiyat ucuzluk/ pahalılık bölgeleri yeniden test ettiğinde, o bölgeler son bara uzatılarak ekranda görünür ve indikatörde ismi “mitigation zone” olarak geçer.
3- Fiyat boşlukları (FVG) : Bilinen kurallarla ve üst zaman dilimi seçeneğiyle ekranda gösterilir.
Fiyatın saygı göstermediği bölgeler ekrandan silinir.
Ayarlar:
- HTF for mitigation zones : Uyumlu üst zaman dilimi seçimi
- HTF for FVG zones : Uyumlu üst zaman dilimi seçimi
Gösterim ve renk seçenekleri.
Ekran görüntüleri ve örnek : (İngilizce kısımda)
Son söz : Fiyat bölgemize geldiğinde diğer konfirmelerle birlikte işlem alıyoruz.
Bölgelerden beklentimiz fiyatı geldiği bölgeye tekrar göndermesidir.
Eğer başarılı olamazsa tersi yönde işlem planlamalıyız.
Neşeli tradeler...

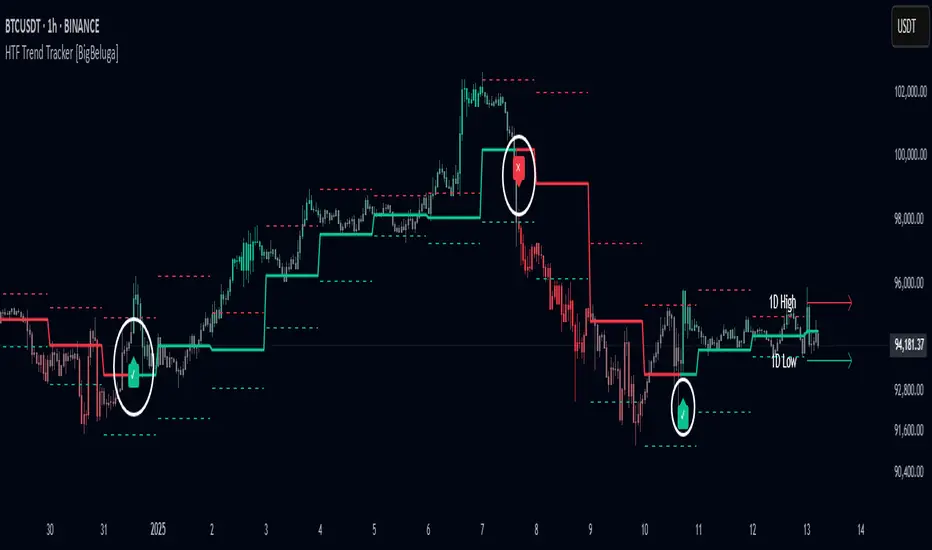
HTF Trend Tracker [BigBeluga]HTF Trend Tracker is a higher timeframe (HTF) trend tracking indicator designed to help traders identify significant trends, key levels, and market sentiment. The indicator dynamically adapts to the current price action, using HTF highs and lows to display trend direction and strength with detailed visuals.
🔵 Key Features:
Dynamic Trend Detection:
Uptrend is identified when the price closes above the HTF high.
Downtrend is detected when the price closes below the HTF low.
Midline changes color dynamically based on the trend direction:
Bullish Green: Indicates an uptrend.
Bearish Red: Indicates a downtrend.
Historical and Active HTF Levels:
Historic HTF highs and lows are displayed as dotted lines.
Current active HTF high and low levels are shown as solid lines.
Timeframe labels (e.g., "1D High" or "1D Low") mark the active levels for clarity.
Trend Change Signals:
A green checkmark (✓) is plotted when an uptrend starts.
A red cross (✕) appears when a downtrend begins.
Trend-Based Candle Coloring:
Candle colors change dynamically based on the trend and the price's distance from the midline:
Intense Bullish Green: Price is far above the midline during an uptrend.
Intense Bearish Red: Price is far below the midline during a downtrend.
Neutral Gray: Price is near the midline.
Users can customize the colors to suit their preferences.
🔵 Usage:
Identify uptrends and downtrends using the midline's color and the position of the close relative to the HTF levels.
Use solid lines and timeframe labels to track current HTF high and low levels.
Observe dotted lines for historical HTF levels to understand past price behavior.
Watch for checkmark (✓) and cross (✕) signals to spot trend changes and key market shifts.
Monitor candle colors to gauge trend intensity and proximity to the midline:
Intense colors signal strong trends, while neutral gray indicates consolidation near the midline.
HTF Trend Tracker is an essential tool for traders aiming to follow higher timeframe trends, identify key levels, and make data-driven decisions based on price dynamics and trend strength. Its customizable features allow for flexible integration into any trading strategy.
OrangeCandle 4EMA 55 + Fib Bands + SignalsThe script is a TradingView indicator that combines three popular technical analysis tools: Exponential Moving Averages (EMAs), Fibonacci bands, and buy/sell signals based on these indicators. Here’s a breakdown of its features:
1. EMA Settings and Calculation:
The script calculates and plots several Exponential Moving Averages (EMAs) on the chart with different lengths:
Short-term EMAs: EMA 9, EMA 13, EMA 21, and EMA 55 (used for tracking short-term price trends).
Long-term EMAs: EMA 100 and EMA 200 (used to analyze longer-term trends).
These EMAs are plotted with different colors to visually distinguish between the short-term and long-term trends.
2. Fibonacci Bands:
The script calculates Fibonacci Bands based on the Average True Range (ATR) and a Simple Moving Average (SMA).
Fibonacci factors (1.618, 2.618, 4.236, 6.854, and 11.090) are used to determine the upper and lower bounds of five Fibonacci bands.
Upper Fibonacci Bands (e.g., fib1u, fib2u) represent resistance levels.
Lower Fibonacci Bands (e.g., fib1l, fib2l) represent support levels.
These bands are plotted with different colors for each level, helping traders identify potential price reversal zones.
3. Buy and Sell Signals:
Long Condition: A buy signal occurs when the price crosses above the EMA 55 (long-term trend indicator) and is above the lower Fibonacci band (support zone).
Short Condition: A sell signal occurs when the price crosses below the EMA 55 and is below the upper Fibonacci band (resistance zone).
These conditions trigger visual signals on the chart (green arrow for long, red arrow for short).
4. Alerts:
The script includes alert conditions to notify the trader when a long or short signal is triggered based on the crossover of price and EMA 55 near the Fibonacci support or resistance levels.
Long Entry Alert: Triggers when the price crosses above the EMA 55 and is near a Fibonacci support level.
Short Entry Alert: Triggers when the price crosses below the EMA 55 and is near a Fibonacci resistance level.
5. Visualization:
EMAs are plotted with distinct colors:
EMA 9 is aqua,
EMA 13 is purple,
EMA 21 is orange,
EMA 55 is blue (with thicker line width for emphasis),
EMA 100 is gray,
EMA 200 is black.
Fibonacci bands are plotted with different colors for each level:
Fib Band 1 (upper and lower) in white,
Fib Band 2 in green (upper) and red (lower),
Fib Band 3 in green (upper) and red (lower),
Fib Band 4 in blue (upper) and orange (lower),
Fib Band 5 in purple (upper) and yellow (lower).
Summary:
This script provides a comprehensive strategy for analyzing the market with multiple EMAs for trend detection, Fibonacci bands for support/resistance, and signals based on price action in relation to these indicators. The combination of these tools can assist traders in making more informed decisions by providing potential entry and exit points on the chart.

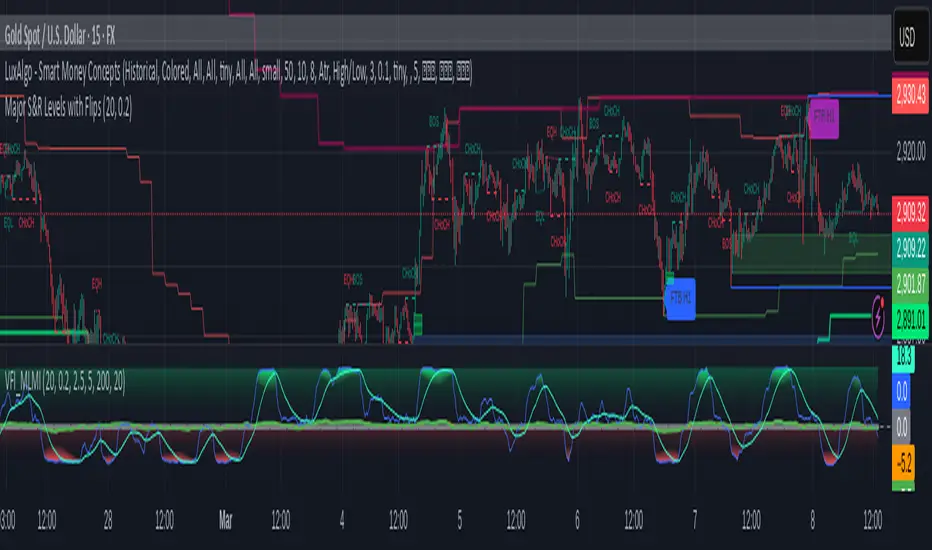
Major S&R Levels with Flips## **Major S&R Levels with Flips**
This script is designed to identify and visualize **Major Support and Resistance (S&R) Levels** across multiple timeframes (H1, H4, D1) and detect **S&R Flip** patterns (FTB, STB, FTR). It also includes customizable alerts for price-level crossings, flip patterns, and level approaches. Below is a detailed breakdown of the script's functionality, inputs, and outputs.
---
## **Script Overview**
The script calculates and plots **Support and Resistance (S&R) Levels** based on the highest highs and lowest lows over a user-defined lookback period. It also detects **S&R Flip Patterns** (First Time Back - FTB, Second Time Back - STB, Failed Test of Resistance/Support - FTR) and provides alerts for key events.
---
## **Key Features**
1. **Multi-Timeframe S&R Levels**:
- Displays S&R levels for **H1**, **H4**, and **D1** timeframes.
- Levels are calculated using the highest highs and lowest lows over a user-defined lookback period.
2. **S&R Flip Detection**:
- Detects and tracks **FTB (First Time Back)**, **STB (Second Time Back)**, and **FTR (Failed Test of Resistance/Support)** patterns.
- Alerts are generated for each flip event.
3. **Customizable Alerts**:
- **Price-Level Crossing Alerts**: Notifies when the price crosses above or below a level.
- **Flip Alerts**: Notifies when a flip pattern (FTB, STB, FTR) is detected.
- **Level Approach Alerts**: Notifies when the price approaches a level within a user-defined threshold.
4. **Efficient Level Updates**:
- Levels are updated periodically (every 10 bars by default) to optimize performance.
5. **Visualization**:
- Plots S&R levels on the chart with distinct colors for each timeframe.
- Displays labels for recent flip events.
---
## **User Inputs**
The script provides several customizable inputs:
### **Level Display**
- **Show H1 Levels**: Toggles visibility of H1 S&R levels.
- **Show H4 Levels**: Toggles visibility of H4 S&R levels.
- **Show D1 Levels**: Toggles visibility of D1 S&R levels.
- **Lookback Period**: Defines the number of bars used to calculate S&R levels (default: 20, range: 5–50).
### **Alerts**
- **Enable Price-Level Crossing Alerts**: Toggles alerts for price crossing above/below S&R levels.
- **Enable SR Flip Alerts**: Toggles alerts for S&R flip patterns (FTB, STB, FTR).
- **Enable Level Approach Alerts**: Toggles alerts for price approaching S&R levels.
- **Approach Threshold**: Defines the percentage threshold for level approach alerts (default: 0.2%, range: 0.05%–1%).
---
## **Script Logic**
### **1. Level Calculation**
- The script calculates S&R levels for each timeframe (H1, H4, D1) using the highest highs and lowest lows over the lookback period.
- Levels are updated periodically (every 10 bars by default) to optimize performance.
### **2. Flip Detection**
- The script detects **FTB**, **STB**, and **FTR** patterns:
- **FTB (First Time Back)**: Price crosses a level for the first time.
- **STB (Second Time Back)**: Price retests the level after FTB.
- **FTR (Failed Test of Resistance/Support)**: Price fails to break the level after STB.
- Flip events are tracked and stored in arrays for visualization and alerts.
### **3. Alerts**
- **Price-Level Crossing Alerts**: Triggered when the price crosses above/below a level.
- **Flip Alerts**: Triggered when a flip pattern (FTB, STB, FTR) is detected.
- **Level Approach Alerts**: Triggered when the price approaches a level within the defined threshold.
### **4. Visualization**
- S&R levels are plotted on the chart with distinct colors for each timeframe.
- Labels are displayed for recent flip events (up to 15 labels by default).
---
## **Outputs**
### **1. Plots**
- **H1 Levels**:
- Support: Green shaded area.
- Resistance: Red shaded area.
- **H4 Levels**:
- Support: Lime shaded area.
- Resistance: Maroon shaded area.
- **D1 Levels**:
- Support: Teal shaded area.
- Resistance: Purple shaded area.
### **2. Labels**
- Labels are displayed for recent flip events:
- **FTB**: Blue label.
- **STB**: Yellow label.
- **FTR**: Purple label.
### **3. Alerts**
- Alerts are generated for:
- Price-level crossings.
- Flip patterns (FTB, STB, FTR).
- Price approaching levels.
---
## **Usage Instructions**
1. **Add the Script**:
- Copy and paste the script into a new Pine Script editor in TradingView.
- Save and add the script to your chart.
2. **Customize Inputs**:
- Adjust the inputs (e.g., lookback period, alert settings) in the script settings panel.
3. **Interpret the Output**:
- Use the plotted levels and labels to identify key S&R zones and flip patterns.
- Monitor alerts for trading opportunities.
4. **Optimize for Your Strategy**:
- Adjust the lookback period and alert thresholds to suit your trading style.
---
## **Example Use Cases**
1. **Trend Identification**:
- Use the D1 levels to identify major S&R zones for long-term trend analysis.
- Combine with H4 and H1 levels for intraday trading opportunities.
2. **Flip Patterns**:
- Look for FTB and STB patterns to identify potential reversals.
- Use FTR patterns to confirm failed breakouts.
3. **Alerts for Trading**:
- Set up alerts for price-level crossings and flip patterns to stay informed of key market movements.
---
## **Notes**
- The script is optimized for performance by updating levels periodically and limiting the number of tracked flips.
- Alerts are designed to minimize noise by triggering only once per bar or bar close.
---
## **Disclaimer**
This script is for educational and informational purposes only. It should not be considered financial advice. Always conduct your own analysis and backtesting before using any trading strategy.
---
This documentation provides a comprehensive guide to using the **Major S&R Levels with Flips** script. If you have any questions or need further assistance, feel free to reach out!
Fibonacci-Only Strategy V2Fibonacci-Only Strategy V2
This strategy combines Fibonacci retracement levels with pattern recognition and statistical confirmation to identify high-probability trading opportunities across multiple timeframes.
Core Strategy Components:
Fibonacci Levels: Uses key Fibonacci retracement levels (19% and 82.56%) to identify potential reversal zones
Pattern Recognition: Analyzes recent price patterns to find similar historical formations
Statistical Confirmation: Incorporates statistical analysis to validate entry signals
Risk Management: Includes customizable stop loss (fixed or ATR-based) and trailing stop features
Entry Signals:
Long entries occur when price touches or breaks the 19% Fibonacci level with bullish confirmation
Short entries require Fibonacci level interaction, bearish confirmation, and statistical validation
All signals are visually displayed with color-coded markers and dashboard
Trading Method:
When a triangle signal appears, open a position on the next candle
Alternatively, after seeing a signal on a higher timeframe, you can switch to a lower timeframe to find a more precise entry point
Entry signals are clearly marked with visual indicators for easy identification
Risk Management Features:
Adjustable stop loss (percentage-based or ATR-based)
Optional trailing stops for protecting profits
Multiple take-profit levels for strategic position exit
Customization Options:
Timeframe selection (1m to Daily)
Pattern length and similarity threshold adjustment
Statistical period and weight configuration
Risk parameters including stop loss and trailing stop settings
This strategy is particularly well-suited for cryptocurrency markets due to their tendency to respect Fibonacci levels and technical patterns. Crypto's volatility is effectively managed through the customizable stop-loss and trailing-stop mechanisms, making it an ideal tool for traders in digital asset markets.
For optimal performance, this strategy works best on higher timeframes (30m, 1h and above) and is not recommended for low timeframe scalping. The Fibonacci pattern recognition requires sufficient price movement to generate reliable signals, which is more consistently available in medium to higher timeframes.
Users should avoid trading during sideways market conditions, as the strategy performs best during trending markets with clear directional movement. The statistical confirmation component helps filter out some sideways market signals, but it's recommended to manually avoid ranging markets for best results.

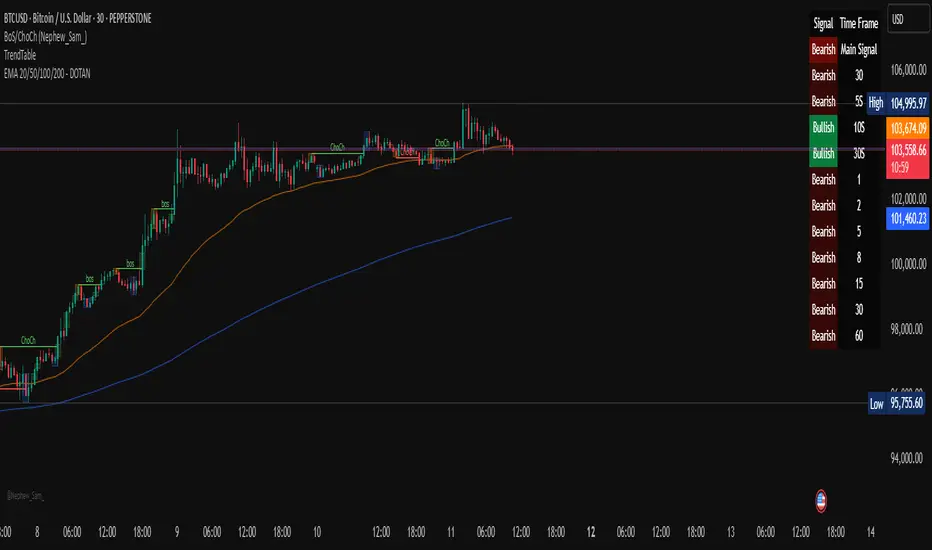
Multi-Timeframe Trend Table - DOTANMulti Timeframe Trend Signal table - Wizord_KS
"Multi-Timeframe Trend Table"
This Pine Script indicator displays a table on the TradingView chart that shows the trend direction (Bullish/Bearish) across multiple timeframes. The trend is determined using a Simple Moving Average (SMA).
🔹 Key Features of the Script
Calculates trend direction based on SMA for:
The current timeframe.
10 different user-defined timeframes.
Determines a "Main Signal" based on trend strength:
Counts the number of bullish and bearish trends across all timeframes.
Uses this count to generate an overall market sentiment (Bullish, Bearish, or Neutral).
The strength of the main signal determines its background transparency.
Displays a table in the top-right corner of the chart showing:
The main trend signal (aggregated from multiple timeframes).
The trend for the current timeframe.
The trend for each of the 10 selected timeframes.
MTF Fractals [RunRox]🔽 MTF Fractals is a powerful indicator designed to visualize fractals from multiple timeframes directly on your chart, highlight liquidity sweeps at these fractal levels, and provide several additional features we’ll cover in detail below.
We created this indicator because we couldn’t find a suitable tool that met our specific needs on TradingView. Therefore, we decided to develop a valuable indicator for the entire TradingView community, combining simplicity and versatility.
⁉️ WHAT IS A FRACTALS?
In trading, a fractal is a technical analysis pattern composed of five consecutive candles, typically highlighting local market turning points. Specifically, a fractal high is formed when a candle’s high is higher than the highs of the two candles on either side, whereas a fractal low occurs when a candle’s low is lower than the lows of the two adjacent candles on both sides.
Traders use fractals as reference points for identifying significant support and resistance levels, potential reversal areas, and liquidity zones within price action analysis. Below is a screenshot illustrating clearly formed fractals on the chart.
📙 FRACTAL FORMATION
Here’s how fractals form depending on your chosen setting (3, 5, 7, or 9):
▶️ 3-bar fractal – forms when the central candle is higher (for highs) or lower (for lows) than one candle on each side.
▶️ 5-bar fractal – forms when the central candle is higher or lower than two candles on both sides.
▶️ 7-bar fractal – forms when the central candle is higher or lower compared to the three candles on each side.
▶️ 9-bar fractal – forms similarly but requires four candles on each side, making the fractal significantly more reliable and robust.
A higher number of bars ensures stronger fractal levels, highlighting more significant potential reversal points on the chart.
Now that we’ve covered the theory behind fractal formation, let’s explore the indicator’s functionality in more detail.
Below, I’ll explain each feature clearly and illustrate how you can effectively utilize this indicator in your trading.
🕐 MULTI-TIMEFRAME FRACTALS
We realized that displaying fractals only from the current timeframe isn’t always convenient, so we’ve introduced Multi-Timeframe Fractals into this indicator.
Now you can easily display fractals from higher timeframes directly on your current chart, providing you with broader market context and clearer trading signals.
Fractals from Current Timeframe – Fractals identified directly on the chart’s current timeframe.
Fractals from Higher Timeframes – Fractals sourced from higher timeframes and displayed clearly on your current chart for enhanced market perspective.
📈 FRACTAL LINES
Since fractals represent areas of high liquidity, we’ve added an option to extend fractal levels horizontally as Fractal Lines across your chart.
This feature allows you to clearly visualize critical liquidity areas from higher timeframes, directly on your current timeframe chart, as demonstrated in the screenshot below.
With this approach, you can clearly visualize significant fractal levels from higher timeframes directly on your current chart - for example, projecting fractals from the 1-hour (1H) timeframe onto a 3-minute (3m) chart. ✅ This helps you easily identify critical liquidity areas and potential reversal zones without the need to switch between multiple timeframes.
💰 LIQUDITY SWEEP (LIQUDITY GRAB)
To enhance your trading experience, we’ve introduced a feature that clearly identifies liquidity sweeps of fractal levels.
A Liquidity Sweep occurs when a candle closes beyond a fractal line, leaving a wick that pierces through it, signaling that liquidity has been collected at this level.
Below, you’ll find two examples illustrating this functionality:
▶️ Fractal lines from the current timeframe
▶️ Fractal lines projected from higher timeframes
The first example illustrates liquidity being swept from fractals on the current timeframe .
Here, the candle clearly closes beyond the fractal line, leaving a wick through it. This indicates a liquidity sweep at the fractal level, visually highlighting a potential reversal or continuation opportunity directly on your chart.
In the second example, fractals from the higher timeframe are projected onto your current chart.
When a candle on your current timeframe closes beyond an HTF fractal line - leaving a wick through this level - the indicator highlights it clearly. This signals to traders a potential reversal zone, indicating that liquidity has been swept, and price may reverse or significantly react from this area.
You can also enable the display of additional labels on the chart. These labels clearly mark liquidity sweeps at fractal levels, making it easier to visually identify potential reversal points directly on your chart.
⚙️ SETTINGS
Below are the indicator settings with detailed explanations for each parameter.
🔷 Bars in Fractal – Number of candles to the right and left required to form a fractal.
🔷 Fractal Timeframe – Select the timeframe from which you want to display fractals on the current chart.
🔷 Max Age, bars – Number of bars during which the fractal will remain active.
🔷 Show Fractal Line – Display or hide fractal lines.
🔷 Line Style – Choose the style of the line displayed on the chart.
🔷 Line Width – Thickness of the fractal line.
🔷 High Fractal – Style and color of bearish fractals.
🔷 Low Fractal – Style and color of bullish fractals.
🔷 Fractal Label Size – Select the size of fractal labels.
🔷 Show Sweep Labels – Option to display labels when a liquidity sweep occurs.
🔷 Label Color – Color and transparency of the area marked on the chart during a sweep.
🔷 Shade Sweep Area – Show or hide the sweep area shading.
🔷 Area Color – Color and transparency settings for the sweep area.
🔶 We’d love to hear your feedback and any suggestions for additional features you’d like to see in this indicator. We’ll be happy to consider your ideas and continue improving the indicator!

Long-Only MTF EMA Cloud StrategyOverview:
The Long-Only EMA Cloud Strategy is a powerful trend-following strategy designed to help traders identify and capitalize on bullish market conditions. By utilizing an Exponential Moving Average (EMA) Cloud, this strategy provides clear and reliable signals for entering long positions when the market trend is favorable. The EMA cloud acts as a visual representation of the trend, making it easier for traders to make informed decisions. This strategy is ideal for traders who prefer to trade in the direction of the trend and focus exclusively on long positions.
Key Features:
EMA Cloud:
The strategy uses two EMAs (short and long) to create a dynamic cloud.
The cloud is bullish when the short EMA is above the long EMA, indicating a strong upward trend.
The cloud is bearish when the short EMA is below the long EMA, indicating a downward trend or consolidation.
Long Entry Signals:
A long position is opened when the EMA cloud turns bullish, which occurs when the short EMA crosses above the long EMA.
This crossover signals a potential shift in market sentiment from bearish to bullish, providing an opportunity to enter a long trade.
Adjustable Timeframe:
The EMA cloud can be calculated on the same timeframe as the chart or on a higher/lower timeframe for multi-timeframe analysis.
This flexibility allows traders to adapt the strategy to their preferred trading style and time horizon.
Risk Management:
The strategy includes adjustable stop loss and take profit levels to help traders manage risk and lock in profits.
Stop loss and take profit levels are calculated as a percentage of the entry price, ensuring consistency across different assets and market conditions.
Alerts:
Built-in alerts notify you when a long entry signal is generated, ensuring you never miss a trading opportunity.
Alerts can be customized to suit your preferences, providing real-time notifications for potential trades.
Visualization:
The EMA cloud is plotted on the chart, providing a clear visual representation of the trend.
Buy signals are marked with a green label below the price bar, making it easy to identify entry points.
How to Use:
Add the Script:
Add the script to your chart in TradingView.
Set EMA Lengths:
Adjust the Short EMA Length and Long EMA Length in the settings to suit your trading style.
For example, you might use a shorter EMA (e.g., 21) for more responsive signals or a longer EMA (e.g., 50) for smoother signals.
Choose EMA Cloud Resolution:
Select the EMA Cloud Resolution (timeframe) for the cloud calculation.
You can choose the same timeframe as the chart or a different timeframe (higher or lower) for multi-timeframe analysis.
Adjust Risk Management:
Set the Stop Loss (%) and Take Profit (%) levels according to your risk tolerance and trading goals.
For example, you might use a 1% stop loss and a 2% take profit for a 1:2 risk-reward ratio.
Enable Alerts:
Enable alerts to receive notifications for long entry signals.
Alerts can be configured to send notifications via email, SMS, or other preferred methods.
Monitor and Trade:
Monitor the chart for buy signals and execute trades accordingly.
Use the EMA cloud as a visual guide to confirm the trend direction before entering a trade.
Ideal For:
Trend-Following Traders: This strategy is perfect for traders who prefer to trade in the direction of the trend and capitalize on sustained price movements.
Long-Only Traders: If you prefer to focus exclusively on long positions, this strategy provides a clear and systematic approach to identifying bullish opportunities.
Multi-Timeframe Analysts: The adjustable EMA cloud resolution allows you to analyze trends across different timeframes, making it suitable for both short-term and long-term traders.
Risk-Averse Traders: The inclusion of stop loss and take profit levels helps manage risk and protect your capital.

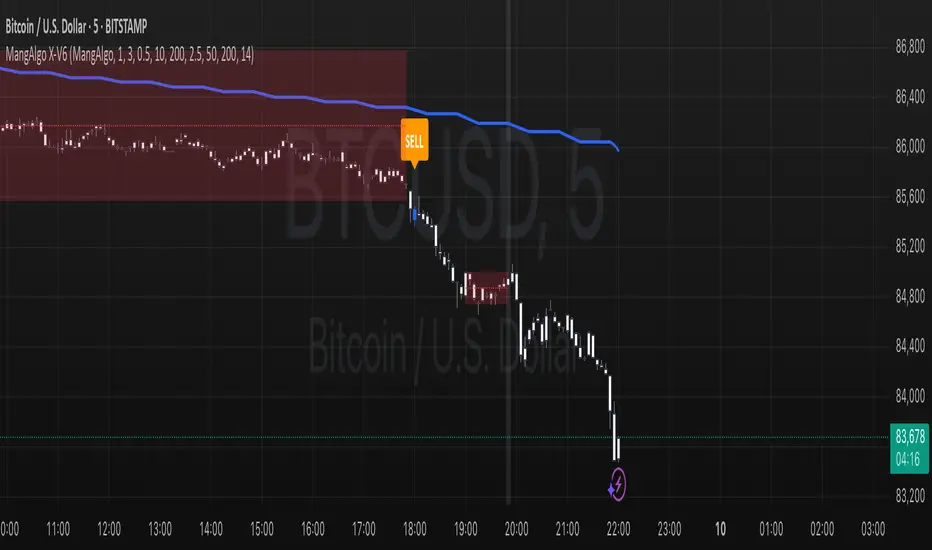
MangAlgo X-V61. Overview & Purpose
The MangAlgo X-V6 script is a multi-component indicator designed to generate buy and sell signals on TradingView charts by combining several technical analysis techniques. It is tailored for various trading styles – including Scalping, Day Trading, and the custom MangAlgo approach – by automatically adjusting parameters based on the selected preset. The primary goal of the script is to deliver more accurate signals by integrating additional filters and a robust trade management system.
⸻
2. Key Features
• Trading Style Presets
• Three preset options: Scalping, Day Trading, and MangAlgo.
• The selected preset automatically adjusts key parameters such as Moving Average (MA) lengths, additional MA filters, and other settings to suit the trading style.
• SL/TP Settings (Stop Loss / Take Profit)
• Adjustable ATR multiplier for calculating the stop loss (SL).
• Multi-level TP (up to 5 levels) based on a configurable risk-reward ratio.
• Multiple Moving Average Types
• Supports various MA types: SMA, EMA, WMA, or VWMA (default is based on conditions).
• Two sets of MAs:
• Fast and Slow MAs for detecting crossovers as primary signals.
• Additional MA Filters (three additional MAs) used as further confirmation.
• Higher Timeframe Filter (HTF)
• Incorporates a moving average from a higher timeframe to provide broader trend context.
• The HTF MA is smoothed using SMA to ensure a stable trend indication.
• SuperTrend Indicator
• Calculates the SuperTrend level using ATR and a configurable multiplier (“Magic Number Factor”).
• Displays a dynamic trend line that changes color: green for an uptrend and red for a downtrend.
• Momentum & Candle Size Filters
• The momentum filter measures price strength using a momentum function over a set period.
• Optional candle size filtering allows you to disregard signals based on minimum and maximum candle sizes to reduce market noise.
• Session Filters
• Optionally filter signals based on trading sessions (New York, London, Tokyo, Sydney) to avoid low-liquidity periods.
• Directional Movement Index (DI)
• Computes DI+ and DI– using a smoothed True Range.
• Acts as an additional filter: a buy signal is valid if DI+ is greater than DI–, and vice versa for sell signals.
• Trade Signal Execution & Management
• Entry Signals:
• Buy: Triggered when the fast MA crosses above the slow MA, supported by SuperTrend, HTF MA, additional MAs, momentum, and DI confirmation (DI+ > DI–).
• Sell: Triggered when the fast MA crosses below the slow MA with corresponding filter confirmations (DI– > DI+).
• SL and TP Setup:
• The stop loss is computed using ATR and adjusted with a trailing SL as take profit levels are reached.
• TP levels (up to 5) are calculated based on the initial risk and a configurable risk-reward ratio.
• Visual Signal & Trade Outcome Display:
• Displays “𝗕𝗨𝗬” and “𝗦𝗘𝗟𝗟” labels on the chart when signals are active.
• Additional labels indicate SL and TP levels and whether the trade outcome was a win or loss once the SL is hit.
• Logging & Trade Statistics (Optional)
• Internal logging records trade details for each confirmed candle, helping you review strategy performance.
• An optional table display shows a summary of trade counts, win/loss results, and win rate percentages.
• Custom Candle Plotting
• Instead of using the standard barcolor(), the script uses plotcandle() to color the candles based on the active trade status:
• Green: Indicates an active buy position.
• Blue: Indicates an active sell position.
• Default colors: When no trade is active.
⸻
3. How It Works & Component Interaction
1. Preset Trading Style Selection:
• Users choose a trading style preset via the input, which sets the values for key parameters such as the type and length of MAs, additional filters, and more.
2. Core Technical Calculations:
• ATR Calculation: Used for range detection and setting the stop loss.
• Moving Averages: Computed through a custom function (f_ma()) based on the chosen MA type.
• Range Detection: The script identifies price ranges by comparing the price to the MA, visualizing the range with boxes and lines.
3. Trend Filtering & Signal Confirmation:
• SuperTrend: Computed using ATR and a multiplier to dynamically generate support/resistance levels.
• Higher Timeframe MA: Provides macro trend context by analyzing a higher timeframe’s data.
• Additional MA & Momentum Filters: Ensure that the price movement is not mere noise, but confirmed by extra layers of filtering.
• DI (Directional Movement): Validates entry signals by ensuring that the directional momentum (DI+) dominates for buys and DI– for sells.
4. Signal Execution & Trade Management:
• When all conditions are met (including session filtering and non-range conditions), a buy or sell signal is activated.
• Upon signal activation, a trade is initiated with a calculated SL and multiple TP levels based on risk parameters.
• As the price reaches a TP level, the script adjusts the stop loss (trailing SL) to lock in gains.
• Trade outcomes (win or lose) are visually labeled on the chart after the SL is hit.
5. Visualization & Logging:
• Trading signals and SL/TP levels are plotted on the chart.
• Custom candle plotting highlights active trades by altering candle colors.
• Trade logging captures detailed information for each candle, which can be used for performance evaluation.
⸻
4. How to Use the Script
• Initial Setup:
• Select your preferred trading style preset (e.g., Scalping, Day Trading, or MangAlgo).
• Adjust additional input parameters if needed, such as the ATR multiplier, number of TPs, or session filters.
• Interpreting Signals:
• Look for “𝗕𝗨𝗬” and “𝗦𝗘𝗟𝗟” labels on the chart as indicators of entry points.
• Use the plotted SL and TP levels as guides for risk management.
• Utilizing Additional Filters:
• Optionally enable the candle size filter and session filters to reduce false signals.
• Regularly monitor the chart and remember that this indicator is a tool that combines multiple technical methods for better signal accuracy.
• Trade Management:
• Use the provided trade outcome labels and logging information to assess and refine your strategy over time.
• If activated, review the trade summary table to analyze overall performance statistics.
⸻
5. Risk Disclaimer
Trading involves significant risk and may not be suitable for all investors.
The MangAlgo X-V6 script is provided for educational and informational purposes only. Past performance is not indicative of future results. Trading decisions based on this script are at the sole discretion of the user, and the creator or distributor of the script is not responsible for any financial losses incurred. Always perform your own analysis, use proper risk management techniques, and consult with a professional financial advisor if necessary.
Crabs Multi-Timeframe Chaikin Money FlowThis indicator uses the classic Chaikin Money Flow formula, which consists of two main components:
Money Flow Multiplier: This determines whether money is flowing into or out of an asset during a period.
Money Flow Volume: This is the volume weighted by the multiplier.
This indicator adds to the basic CMF by using calculations for separate timeframes (1W, 1D, 4H, 1H). It will average the selected timeframes to create a composite line as well as a composite moving average. The indicator is completely customizable for colors/shading and will display a background shading change (when selected) indicating a change in direction of CMF. Each timeframe is selectable to display or not as desired - this will change the overall map of the CMF and the composites.
The indicator also ads user defined smoothing factors to reduce potential false signals.
A scaling feature is included which will allow for a very detailed numerical scale for the plot. If used in conjunction with the optional user defined upper and lower level lines, this can assist traders in identifying deeply overbought or oversold areas. These lines can also be selected to trigger alerts when hit.
It is also possible to use this indicator with traditional bullish/bearish divergence similar to how some might interpret the same with other popular indicators such as rsi/macd, etc.
This indicator can be used on larger timeframes to help identify possible swings and is a robust tool for visualization of potentially large market moves.

Essa - Yearly High, Low & MidYearly High, Low & Midpoint Indicator
This TradingView indicator helps traders track key yearly price levels by plotting the high, low, and midpoint values for each year within a user-specified range.
Features & Functionality:
Automatic Yearly Calculation: Determines the highest and lowest price for each year and computes the midpoint as their average.
Clear & Customisable Visuals:
The Yearly High is plotted as a solid green line.
The Yearly Low appears as a solid red line.
The Midpoint is displayed as a blue dashed line for easy distinction
Detailed Labels:
Each level is labeled at the far right of the chart, showing the year, level type (High, Low, or Mid), and price (e.g., 2016 High - 1.20000).
Labels are right-aligned in white, ensuring clear visibility against any background.
This indicator is perfect for traders who rely on long-term technical analysis, providing a quick and structured way to visualise significant yearly price levels.

Nimu Market on Paper
Multi-Timeframe Analysis Tool is a powerful visual aid for identifying trends, reversals, and key price movements across multiple timeframes — particularly useful for intraday traders and those using technical analysis strategies
Timeframes & Data Collection:
The script tracks multiple timeframes (1m, 5m, 15m, 30m, 1H, 2H, 4H, 8H), storing their open, high, low, and close prices in arrays (trdh, trdc, trdo, trdl).
It uses request.security() to fetch these values for the current symbol and specified timeframes
.
User Inputs:
Base Timeframe: Chooses the primary timeframe for analysis.
Bar Count: Determines how many bars to display.
Border Thickness: Sets the visual thickness of box borders.
Colors: Configurable for bullish, bearish, background, and borders
Visual Elements:
Dynamic Boxes: Drawn using box.new(), these illustrate the range between high and low prices with the percentage change displayed inside.
Candlestick Plots: Rendered for each tracked timeframe using plotcandle(), colored according to bullish or bearish price action and styled based on timeframe scaling.
Regression Line: A linear regression line plotted over the selected timeframe’s close prices to capture trend direction.
Logic & Presentation:
Determines the right timeframe index based on user input (base).
Calculates percentage change from high to low and visualizes it with shaded boxes.
Automatically deletes older boxes to maintain clarity.
Customizes candle appearance based on timeframe granularity.

Time Box Breakout IndicatorPlots Boxes with breakout signals on whatever timeframe the user selects.
Allows for users to see higher timeframe ranges on lower timeframes.
Useful for scalpers taking advantage of momentum, combined with support and resistance on higher timeframes.
Aids in visualizing risk, ranges and trends.

Wick Highlighter- Description
This script is a custom Multi-Wick Zone Highlighter that detects and highlights significant candle wicks on your chart. It is designed to work across multiple timeframes and uses time‑anchored boxes to “stick” to the original wick levels, ensuring that highlighted zones remain fixed even when panning or zooming the chart.
- Key Features
Wick Detection:
The script examines each candle to determine whether its upper or lower wick exceeds a user‑defined minimum size. Only wicks that meet or exceed this threshold are considered significant and trigger the creation of a highlight zone.
Zone Creation and Removal:
When a qualifying wick is detected, the script creates a colored zone (using anchored boxes) that spans from the wick tip to the candle’s body (top for upper wicks and bottom for lower wicks). Each zone remains visible until it is “filled” by subsequent price action. The fill condition is determined by a user‑adjustable fill percentage. For example, setting the fill percentage to 100% will remove the zone once the next candle’s high (for an upper wick) or low (for a lower wick) reaches the corresponding body level.
Multiple Zones:
This indicator supports multiple simultaneous zones. Each wick that qualifies is independently tracked and will not be overwritten by a later candle unless its fill condition is met. Separate flags ensure that if a candle fills an existing zone on one side, it does not create a new zone on that same side, maintaining clarity on your chart.
Time-Anchored Positioning:
To keep zones properly anchored even when you change timeframes or pan the chart, the script uses the bar’s time value rather than the bar index. This ensures that each zone remains fixed to the specific price levels where the wick was detected.
- Usage Notes
User-Adjustable Inputs:
Minimum Wick Size (Points): Set the minimum wick length to trigger a zone.
Wick Fill Percentage (%): Set the percentage into the wick at which the zone is considered filled and will be removed.
Zone Extend Bars: Control how far to the right (in terms of bars) each zone is extended.
Ideal For:
Traders who wish to visually identify key price zones based on significant candle wicks, and who require these zones to remain fixed and clear on the chart until they are actively filled by subsequent price movement.

ThePawnAlgoPROThe Pawn algo PRO is an automated strategy that is useful to trade retracements and expansions using any higher timeframe reference.
Why is useful?
This algorithm is helpful to trade with the higher timeframe Bias and to see the HTF manipulations of the highs or lows once the candle open, usually in a normal buy candle will be a manipulation lower to end up higher. In a normal sell candle will be a manipulation higher to close lower. Once the potential direction of the Higher time frame candle is clear the algo will just enter on a trade on the lower timeframe aligned with the higher timeframe trend.
You can select any HTF you want from 1-365Days, 1-12Months or 1-52W ranges. Making this algorithm very flexible to adapt to any trader specialized timeframe.
How it works and how it does it?
It works with a simple but powerful pattern a close above previous candle high means higher prices and a close below previous candle low means lower prices, Close inside previous candle range means price is going to consolidate do some kind of retracement or reversal. The algo plots the candles with different colors to identify each of these states. And it does this in the HTF range plot.
This algo is similar to the previously released Pawn algo with the additional features that is an automated strategy that can take trade using desired risk reward and different entry types and trade management options. When the simple pattern is detected.
Also this version allows to plot the current developing HTF levels meaning the high, low and the 50%, plus the first created FVG(fair value gap introduced by ICT) in the range allowing to easily track any change in the potential direction of the HTF candle.
How to use it?
First select a higher timeframe reference and then select a lower timeframe, to visualize it better is recommended that the LTF is at least 10 times lower. Default HTF is 1 Week and LTF is 60min for trading the weekly expansions intraday.
Then we configure the HTF visualization it can be configure to show different HTF levels the premium/discount, wicks midpoints, previous levels, actual developing range or both. The Shade of the HTF range can be the body or the whole HTF range.
After that we configure the automated entries we can chose between buys only ,sell only entries or both and minimum risk reward to take a trade. Default value is 1.8RR and both entries selected. We can choose the maximum Risk Reward to avoid unrealistic targets default is 10RR. The maximum trades per HTF candle is also possible to select around this section.
Then we got the option to select which type of trade you want to take a trade around the open, the 50% or 75-80% or around the previous High for shorts or Low for longs. And off course the breakout entry that is for taking expansions outside previous HTF range. The picture below showcase an option using only entries on previous candles High or lows and 1Day as a HTF. You can also see the actual and previous HTF levels plotted.
Is important to take into account that these default settings are optimized for the MNQ! the 1W and 1H timeframes, but traders can adjust these settings to their desire timeframes or market and find a profitable configuration adjusting the parameters as they prefer. Initial balance, order size and commissions might be needed to be configured properly depending of the market. The algo provides a dashboard that make it easy to find a profitable configuration. It specifies the total trades, ARR that is an approximate value of the accumulative risk reward assuming all loses are 1R. The profit factor(PF) and percent profitable trades(PP) values are also available plus consecutives take profits and consecutives loses experimented in the simulation.
Finally there is an option to allow the algo to just trade following the direction of the trend if you just want to use it for sentiment or potential trend detection, this will place a trade in the most probable direction using the HTF reference levels, first FVG and LTF price action.
In the picture below you can see it in action in the 1min chart using 1H as HTF. When its trending works pretty well but when is consolidating is better to avoid using this option. Configuration below uses a time filter with the macro times specified by ICT that is also an available filter for taking trades. And the risk reward is set to minimum 2RR.
The cyan dotted line is the stop loss and the blue one above is the take profit level. The algo allows for different ways to exit in this case is using exit on a reversal, but can also be when the take profit is hit, or in a retracement. For the stop loss we can chose to exit on a close, reversal or when price hit the level.
Strategy Results
The results are obtained using 2000usd in the MNQ! 1 contract per trade. Commission are set to 2USD,slippage to 1tick,
The backtesting range is from April 19 2021 to the present date that is march 2025 for a total of 180 trades, this Strategy default settings are designed to take trades on retracements only, in any of the available options meaning around 50% to the extreme HTF high or low following the HTF trend, but can only take 2 trades per HTF candle and the risk reward must be minimum 1.8RR and maximum 8RR. Break even is set when price reaches 2RR and the exit on profit is on a reversal, and for loses when the stop is hit. The HTF range is 1 Week and LTF is 1H. The strategy give decent results, makes around 2 times the money is lost with around 30% profitable. It experiments drawdown when the market makes quick market structure shifts or consolidates for long periods of time. So should be used with caution, remember entries constitute only a small component of a complete winning strategy. Other factors like risk management, position-sizing, trading frequency, trading fees, and many others must also be properly managed to achieve profitability. Past performance doesn’t guarantee future results.
Summary of features
-Take advantage of market fractality select HTF from 1-365Days, 1-12Months or 1-52W ranges
-Easily identify manipulations in the LTF using any HTF key levels, from previous or actual HTF range
-LTF Candles and shaded HTF boxes change color depending of previous candle close and price action
-Plot the first presented FVG of the selected HTF range plus 50% developing range of the HTF
-Configurable automated trades for retracements into the previous close, around 50%,75-80% or using the HTF high or low
-Option to enable automated breakout entries for expansions of the HTF range
-Trend follower algo that automatically place a trade where is likely to expand.
-Time filter to allow only entries around the times you trade or the macro times.
-Risk Reward filter to take the automated trades with visible stop and take profit levels
- Customizable trade management take profit, stop, breakeven level with standard deviations
-Option to exit on a close, retracement or reversal after hitting the take profit level
-Option to exit on a close or reversal after hitting stop loss
-Dashboard with instant statistics about the strategy current settings

Candle Close CountdownA simple indicator that counts down major candle closes.
This is especially useful if you're trading on low time frames but want to know when higher time frame candles close for volatility / reversal points.
It can also be useful to use it as a visual reminder to actually go check how a candle has closed.
- There are alerts for when a candle is going to close you can enable
- The text turns red 15% of the time BEFORE the candle closes

Daily separator, Open, HTF candlesScript Overview
This TradingView script is designed to enhance market structure analysis by providing a clear visual representation of key trading elements. It integrates multiple technical features that help traders assess price action, trend direction, and potential trade setups efficiently.
Main Features & Functionality
1. Daily Separator
• A vertical line is plotted to clearly mark the start of each trading day.
• Helps traders visually differentiate daily sessions, making it easier to analyze price action over different periods.
2. Exponential Moving Average (EMA) with EMA Continuity Table
• The script calculates an EMA of choice and displays whether the price is above or below it across five customizable timeframes.
• Use Case:
• Identifies if the price is in a retracement or a trend continuation phase.
• Helps determine trend strength—if price is consistently above the EMA across multiple timeframes, the trend is bullish; if below, it’s bearish.
• Aids in making trading decisions such as whether to go long or short.
3. Higher Timeframe (HTF) Candles
• Plots candles from a higher timeframe (HTF) onto the current chart.
• Use Case:
• Provides a macro view of price action while trading on a lower timeframe.
• Helps traders see if the price is interacting with HTF support/resistance levels.
• Useful for confirming entries/exits based on the HTF trend.
4. Opening Line
• Draws a daily opening price level, allowing traders to track price movement relative to the open.
• Use Case:
• Useful for intraday traders who analyze whether price is holding above or below the daily open.
• Helps in identifying key price behaviors, such as breakouts, fakeouts, or potential reversals.
Additional Considerations
• Customization: The script allows traders to adjust key parameters such as the EMA length, timeframes for EMA continuity, and HTF candle settings.
• Market Structure & Decision Making: By combining EMAs, HTF analysis, and the daily open, the script assists traders in determining whether price action aligns with their trade thesis.
• Potential Enhancements:
• Adding alerts for EMA crossovers or when price crosses the daily open.
• Incorporating color coding for the EMA table to improve readability.
Use Case Summary
This script is particularly beneficial for trend-following traders, intraday traders, and swing traders who want to:
1. Confirm market direction with EMA-based trend analysis.
2. Monitor HTF price action while trading on lower timeframes.
3. Track intraday price movement relative to the daily open.
4. Differentiate trading sessions for better structure analysis.

Date Display with Bar Counter and EMA===== ENGLISH DESCRIPTION =====
OVERVIEW:
This is a multi-function indicator that combines three useful tools in one script:
1. Date Display - Shows current date and symbol information in a customizable table
2. Bar Counter - Displays sequential bar numbers at specified intervals
3. EMA (Exponential Moving Average) - Plots an EMA line with customizable settings
FEATURES:
1. DATE DISPLAY:
- Shows date in full format (e.g., "Mon ∙ January 1, 2023") or short format (e.g., "Mon ∙ 01.01.23")
- Option to show/hide day of week
- Option to show/hide symbol and timeframe information
- Customizable table position (top/middle/bottom, left/center/right)
- Automatic color adjustment based on chart background
2. BAR COUNTER:
- Displays sequential bar numbers below price bars
- Customizable display frequency (every X bars)
- Special handling for Hong Kong futures (resets at market open)
- Different reset logic based on timeframe (daily, weekly, monthly)
- Customizable text size and color
3. EMA INDICATOR:
- Customizable period length (default: 20)
- Option to use different timeframe for calculation
- Option to wait for timeframe close for more stable signals
- Customizable line color
USAGE INSTRUCTIONS:
- After adding the indicator to your chart, customize settings in the "Format" panel
- The Date Display table will appear at your chosen position on the chart
- Bar numbers will appear below price bars at your specified frequency
- The EMA line will be plotted on the chart with your chosen settings
- Colors automatically adjust to light/dark chart themes
===== 中文说明 =====
概述:
这是一个多功能指标,将三个实用工具合并为一个脚本:
1. 日期显示 - 在可自定义的表格中显示当前日期和交易品种信息
2. K线计数器 - 按指定间隔显示K线序号
3. EMA指数移动平均线 - 绘制可自定义设置的EMA线
功能特点:
1. 日期显示:
- 支持完整格式(如"Mon ∙ January 1, 2023")或简短格式(如"Mon ∙ 01.01.23")
- 可选择显示/隐藏星期几
- 可选择显示/隐藏交易品种和时间周期信息
- 可自定义表格位置(顶部/中部/底部,左侧/中间/右侧)
- 根据图表背景自动调整颜色
2. K线计数器:
- 在价格K线下方显示序号
- 可自定义显示频率(每X根K线)
- 对香港期货有特殊处理(在开市时重置)
- 根据时间周期(日线、周线、月线)使用不同的重置逻辑
- 可自定义文字大小和颜色
3. EMA指标:
- 可自定义周期长度(默认:20)
- 可选择使用不同的时间周期进行计算
- 可选择等待时间周期结束以获得更稳定的信号
- 可自定义线条颜色
使用说明:
- 将指标添加到图表后,在"格式"面板中自定义设置
- 日期显示表格将出现在您选择的图表位置
- K线序号将按您指定的频率显示在价格K线下方
- EMA线将根据您选择的设置绘制在图表上
- 颜色会根据浅色/深色图表主题自动调整
*/

DXA JOKERThis custom indicator is designed to provide traders with a comprehensive toolkit for identifying potential entry and exit points in the market, while incorporating dynamic risk management features. The script integrates multiple analytical components to generate actionable signals, trend direction insights, and volatility-based adjustments for stop-loss and take-profit levels.
Key Features:
Signal Generation:
The indicator employs a sophisticated algorithm to generate precise trading signals. These signals are derived from a combination of trend-following and momentum-based calculations, ensuring adaptability to various market conditions. The signals are designed to highlight potential entry points for both long and short positions, providing clear visual cues on the chart.
Trend Identification:
A robust trend-detection mechanism is embedded within the indicator to assess the overall market direction. This component evaluates price action and momentum to determine whether the market is in a bullish, bearish, or neutral phase. The trend analysis is visually represented on the chart, allowing traders to align their strategies with the prevailing market conditions.
Volatility-Based Adjustments:
The script incorporates a dynamic volatility assessment tool to adjust stop-loss and take-profit levels according to current market conditions. By measuring market volatility, the indicator ensures that risk parameters are scaled appropriately, reducing the likelihood of premature stop-outs during periods of high volatility and optimizing profit potential during stable market phases.
Fibonacci-Based Levels:
The indicator includes a proprietary method for calculating and plotting Fibonacci-derived levels on the chart. These levels are used to identify potential support and resistance zones, which serve as strategic take-profit and stop-loss targets. The Fibonacci levels are dynamically updated based on recent price action, ensuring relevance to the current market structure.
Risk Management Integration:
The script seamlessly integrates risk management principles by combining volatility-adjusted stop-loss levels with Fibonacci-based take-profit targets. This approach allows traders to maintain a disciplined risk-reward ratio, enhancing the overall consistency of their trading strategy.
Visual Clarity:
The indicator is designed with a user-friendly interface, featuring clear visual markers for signals, trend direction, and key levels. Customizable colors and styles ensure that the indicator can be tailored to individual preferences, making it suitable for traders of all experience levels.
Usage Guidelines:
Entry Signals: Traders can use the generated signals to identify potential entry points in alignment with the prevailing trend.
Trend Confirmation: The trend-detection component provides additional confirmation, helping traders avoid counter-trend positions.
Stop-Loss and Take-Profit Levels: The dynamically calculated levels offer precise risk management guidelines, ensuring trades are executed with predefined risk parameters.
Volatility Awareness: The volatility assessment tool helps traders remain aware of changing market conditions, allowing for adjustments to position sizing and risk tolerance.
Conclusion:
This custom indicator is a versatile and powerful tool for traders seeking to enhance their decision-making process. By combining signal generation, trend analysis, volatility adjustments, and Fibonacci-based levels, the script provides a holistic approach to trading. Its intuitive design and dynamic calculations make it suitable for a wide range of trading styles and timeframes, empowering traders to navigate the markets with confidence and precision.

Order Blocks-[B.Balaei]Order Blocks -
**Description:**
The Order Blocks - indicator is a powerful tool designed to identify and visualize Order Blocks on your chart. Order Blocks are key levels where significant buying or selling activity has occurred, often acting as support or resistance zones. This indicator supports multiple timeframes (MTF), allowing you to analyze Order Blocks from higher timeframes directly on your current chart.
**Key Features:**
1. **Multi-Timeframe Support**: Choose any timeframe (e.g., Daily, Weekly) to display Order Blocks from higher timeframes.
2. **Customizable Sensitivity**: Adjust the sensitivity to detect more or fewer Order Blocks based on market conditions.
3. **Bullish & Bearish Order Blocks**: Clearly distinguishes between bullish (green) and bearish (red) Order Blocks.
4. **Alerts**: Get notified when price enters a Bullish or Bearish Order Block zone.
5. **Customizable Colors**: Personalize the appearance of Order Blocks to match your chart style.
**How to Use:**
1. Add the indicator to your chart.
2. Select your desired timeframe from the "Multi-Timeframe" settings.
3. Adjust the sensitivity and colors as needed.
4. Watch for Order Blocks to form and use them as potential support/resistance levels.
**Ideal For:**
- Swing traders and position traders looking for key levels.
- Traders who use multi-timeframe analysis.
- Anyone interested in understanding market structure through Order Blocks.
**Note:**
This indicator is for educational and informational purposes only. Always conduct your own analysis before making trading decisions.
**Enjoy trading with Order Blocks - !**

Price AltimeterThis indicator should help visualize the price, inspired by a Digital Altimeter in a Pilots HUD.
It's by default calibrated to Bitcoin, with the small levels showing every $100 and the larger levels setup to display on every $1000. But you can change this to whatever you want by changing the settings for: Small and Large Level Increments.
The default colors are grey, but can be changed to whatever you want, and there are two cause if you want they work as a gradient.
There are options to fade as the values go away from the current price action.
There are options for Forward and Backward Offsets, 0 is the current price and each value represents a candle on whatever time frame your currently on.
Other Options include the Fade Ratio, the Line Width and Style, which are all self explanatory.
Hope you Enjoy!
Backtest it in fast mode to see it in action a little better...
Known Issues:
For some reason it bug's out when either or are displaying more than 19 lines, unsure why so its limited to that for now.
Extra Note on what this may be useful for: I always wanted to make this, but didn't realize how to put things in front of the price action... Offset! Duh! Anyways, I thought of this one because I often it's hard on these charts to really get an idea for absolute price amounts across different time frames, this in an intuitive, at a glance way to see it because the regular price thing on the right always adds values between values when you zoom in and you can sometimes get lost figuring out the proportions of things.
Could also be useful for Scalping?
Weekly MA SuiteThe Weekly MA Suite is a multi-layered moving average indicator designed for traders and investors who analyze market trends across weekly and long-term timeframes. It combines three critical trend layers—short-term (1W EMA/VWMA), mid-term (30W EMA/VWMA), and long-term (200W HMA)—providing clear insights into market momentum, structure, and cycle trends.
This indicator is ideal for:
✅ Swing traders looking for weekly momentum shifts
✅ Position traders tracking multi-week to multi-month trends
✅ Long-term investors monitoring macro market cycles
Each layer has customizable colors, transparency, and visibility toggles, ensuring traders can tailor the indicator to their specific needs.
📊 Breakdown of Components
🔹 Short-Term Trend (1W EMA/VWMA Ribbon – Top Layer)
Purpose: Captures weekly momentum and volume dynamics
• 1W EMA (Exponential Moving Average) reacts quickly to price changes
• 1W VWMA (Volume-Weighted Moving Average) accounts for volume to confirm trend strength
• Ribbon fill highlights the divergence between price-based momentum (EMA) and volume-weighted trends (VWMA), making trend shifts easier to spot
Usage:
• If the 1W EMA is above the 1W VWMA, momentum is strong and price is trending higher with support from volume
• If the EMA crosses below the VWMA, it may indicate weakening trend strength or distribution
• A widening ribbon suggests increasing momentum, while a narrowing ribbon signals potential consolidation or reversal
🔸 Mid-Term Trend (30W EMA/VWMA Ribbon – Middle Layer)
Purpose: Provides insight into the broader market structure over multiple months
• 30W EMA represents the dominant trend direction over roughly half a year
• 30W VWMA smooths this trend while weighting price by trading volume
• Ribbon fill allows for a visual representation of how volume impacts trend direction
Usage:
• A bullish trend is confirmed when price remains above the 30W EMA, with the ribbon widening in an uptrend
• A bearish shift occurs when the 30W EMA crosses below the 30W VWMA, signaling weakening demand
• If the ribbon narrows or twists frequently, the market may be in a choppy, range-bound phase
🔻 Long-Term Trend (200W HMA – Background Layer)
Purpose: Identifies major market cycles and deep trend shifts
• The 200W Hull Moving Average (HMA) is a long-term smoothing tool that reduces lag while maintaining trend clarity
• Unlike traditional moving averages, the HMA reacts faster to trend changes without excessive noise
Usage:
• When price is above the 200W HMA, the broader trend remains bullish, even during short-term corrections
• A cross below the 200W HMA may indicate a macro downtrend or deep market cycle shift
• Long-term investors can use this as a dynamic support or resistance zone
🎯 How to Use the Weekly MA Suite for Trading
📅 Identifying Market Phases
• In strong uptrends, the 1W EMA and 30W EMA will be aligned above their VWMA counterparts, with price well above the 200W HMA
• In sideways markets, the ribbons will frequently narrow or cross, signaling indecision
• In bear markets, price will typically trade below the 30W EMA, with the 200W HMA acting as a long-term resistance
📈 Entry and Exit Strategies
• A bullish trade setup occurs when the 1W EMA crosses above the 1W VWMA while the 30W EMA holds above the 30W VWMA, confirming multi-timeframe momentum
• A bearish setup is confirmed when the 1W EMA crosses below the 1W VWMA and price is also trending below the 30W EMA
• The 200W HMA can be used as a trend filter—staying long when price is above it and avoiding longs when price is below
🚦 Customizing for Your Trading Style
• Scalpers can focus on the 1W ribbon for faster trend shifts
• Swing traders can use the 30W ribbon for trend-following entries and exits
• Long-term investors should watch price action relative to the 200W HMA for market cycle positioning
🔧 Final Thoughts
The Weekly MA Suite simplifies multi-timeframe analysis by layering key moving averages in an intuitive and structured format. By combining short, medium, and long-term trend indicators, traders can confidently navigate market conditions and improve decision-making. Whether trading weekly trends or monitoring multi-year cycles, this tool provides a clear visual framework to enhance market insights.
