FeraTrading Breakout Indicator v2🧠 Overview:
The FeraTrading Breakout Indicator v2 is a momentum-based opening range breakout (ORB) tool built around a fixed intraday structure. It captures price behavior shortly after the market opens and then projects custom breakout levels above and below a calculated midpoint.
Signals are only generated when price breaks one of these projected zones with confirmation from multiple aligned indicators, including RSI momentum, candle body strength, and volatility acceleration.
Unlike traditional ORB tools that plot breakout lines directly on the high and low of the session, this script does not use session highs/lows for its breakout levels. Instead, it creates a central zone based on internal range logic and projects breakout bands dynamically from that midpoint.
⚙️ How It Works:
🔹 Session Zone Setup:
After the first part of the New York session, the script captures the initial price structure.
From this structure, a midpoint zone is established.
Using this midpoint, the script projects upper and lower breakout bands that remain fixed for the rest of the day.
🔹 Breakout Signal Conditions:
To trigger a signal, all of the following must be met:
Price Engagement with Projected Zones:
The prior candle must break through the upper or lower projected level, showing clean directional intent.
Directional Candle Structure:
The breakout candle must have a clear and strong body (not dominated by wicks), confirming that the move had conviction.
RSI-Based Momentum Alignment:
A short-term RSI is calculated and smoothed.
Bullish signals require RSI to be above its average.
Bearish signals require RSI to be below its average.
This ensures breakouts occur with momentum support.
Volatility Spike Filter (Optional):
Checks if the breakout candle is significantly larger than recent candles to eliminate soft or passive breakouts.
All filters must align to print a signal, avoiding noisy or conflicting trades.
🎨 Visuals:
Midpoint Line: Central anchor for the breakout zone (drawn after the session range is complete).
Upper/Lower Breakout Bands: Custom levels projected from midpoint—not drawn on session highs/lows.
Signal Arrows:
Green triangle below the candle = bullish breakout
Red triangle above the candle = bearish breakout
🔒 What Makes It Original:
Uses a fixed custom range derived from structural behavior—not highs/lows—to define breakout levels
Integrates RSI and trend-following behavior with raw price structure for more precise entries
Requires candle anatomy, directional momentum, and volatility conditions to all confirm
Universally applicable across instruments and timeframes—no tuning required
Fixed levels provide a consistent reference point for traders throughout the session
This multi-layered, confirmation-based approach is unique to this script and justifies closed-source protection.
✅ How to Use:
Add to any intraday chart (3m–15m ideal)
After the session range is set, custom zones will appear and remain unchanged for the day
Watch for triangle signals and enter at the open of the signal candle
Use your own stop loss/take profit or trailing exit logic
Best used during high-volume, active market hours
💎 Why It’s Worth Paying For
The FeraTrading Breakout Indicator v2 elevates traditional ORB logic by blending a fixed, midpoint-based breakout structure with live confirmation from RSI, candle anatomy, and volatility filters.
Unlike generic mashups or open-source breakouts, this system:
Filters breakouts using real momentum alignment, not just price movement
Applies structural logic with consistent visual zones that don’t recalculate intraday
Eliminates noise by only triggering when force, structure, and trend all agree
Delivers repeatable, high-clarity signals that adapt to market tempo without parameter tweaking
This type of structured, confluence-validated breakout logic is not available in public indicators or simple ORB clones. It reflects custom engineering and real-world trader experience, resulting in a premium-grade breakout tool.
✅ Compliance & Originality
This script was built fully from scratch using original logic and structure. All visual zones, signal filters, and confirmation layers were designed and implemented internally. No open-source components or cloned calculations are used. RSI is used as a filter, although the thresholds should remain confidential.
All inputs, filters, and breakout mechanics were developed to be asset-agnostic and do not rely on any third-party libraries, code reuse, or recycled logic.
⚠️ Risk Disclaimer & Access Policy
This tool is not financial advice and does not predict future price direction. It visualizes structural and momentum conditions that have historically preceded breakouts. Use in combination with your own trade management system.
All trades carry risk. Past performance does not guarantee future results.
🔒 Why This Script Is Invite-Only and Closed-Source
This script contains proprietary logic that combines structural breakout detection with multi-layered signal validation. Releasing the source would expose the system to replication and diminish its uniqueness and value.
Access is restricted to protect:
The original breakout zone generation logic
The combined RSI-candle-volatility signal filter
The pattern structure and visual consistency framework
Keeping the script closed-source ensures the integrity of the design and preserves the edge for serious users.
We plan on implementing our Pattern Recognition Engine (PRE) into this indicator in the future to add more reliability to the signals.
Multitimeframe

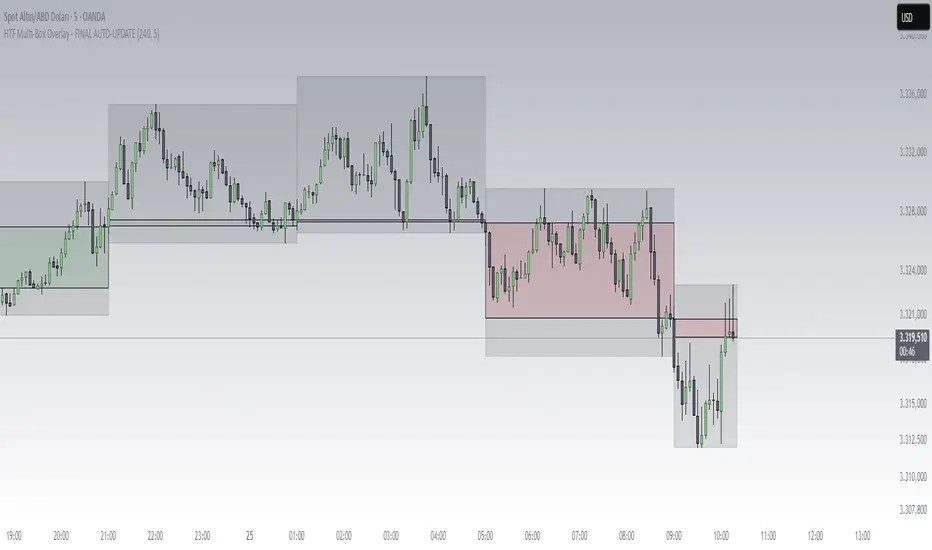
HTF Box Range Overlay - FIXEDThis script overlays higher timeframe candles (e.g. 4H) onto lower timeframe charts (e.g. 5min), showing both the body and wick ranges of the last N HTF candles.
Features:
✔ Displays both candle body and wick as separate shaded boxes
✔ Fully customizable for bullish/bearish colors and wick appearance
✔ Supports any higher timeframe (15m, 1H, 4H, 1D, etc.)
✔ Clean overlay with no performance lag
✔ Automatically adjusts in real-time as new candles form
Great for traders using HTF zones, supply/demand, or structure-based confluence. Works best when used on intraday charts.
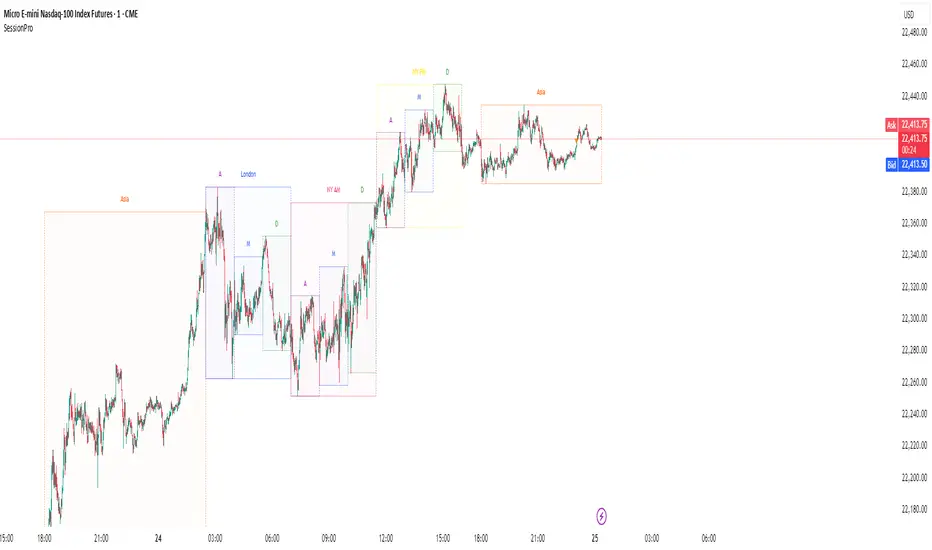
Session [PRO]Session Pro is a powerful and highly customizable indicator designed to visualize key trading sessions and their internal phases directly on your chart. It's built for traders who base their strategies on time-of-day dynamics, market opens, and specific session profiles.
This tool moves beyond simple session boxes by allowing you to map out detailed sub-sessions (e.g., Accumulation, Manipulation, Distribution phases) within the main trading windows, giving you a clearer view of the market's structure throughout the day.
Key Features
Customizable Main Sessions: Visualize Asia, London, and New York (AM/PM) sessions with distinct high/low ranges.
Detailed Sub-Sessions: Break down the London and New York sessions into three distinct profiles (A, M, D) to analyze intraday market movements.
Advanced Display Control: For every single session and sub-session, use a dropdown menu to choose your preferred display style:
Outline & Fill: The default view with a transparent colored background.
Outline Only: A minimalist view showing only the session's high/low border.
Off: Hide any session completely to declutter your chart.
Granular Color Customization: Every session and sub-session has its own individual color picker, giving you full control over your chart's aesthetics.
Custom Alerts: Never miss a session start again. Enable alerts for any specific main or sub-session you want to track.
Full Timezone Support: Easily sync the indicator to your local time using a UTC offset (defaulting to NY time, UTC-4) or your exchange's timezone.
How to Use
Go into the indicator Settings.
For each session, configure the Time, Color, and Display Style to your preference.
Check the Alert box for any session you wish to receive a notification for when it begins.
Adjust the global UTC Timezone Offset in the final settings tab to match your trading clock.
How to Set Alerts
First, go into the indicator's Settings and check the "Alert" box for each session you want to be notified about.
Click the "Alert" button on the TradingView toolbar (the alarm clock icon).
In the Condition dropdown, select "Session Pro".
In the dropdown directly below it, choose the option "Any alert() function call".
Select your preferred notification method (e.g., Pop-up, Email, App Notification) and click "Create".
Hope this tool helps you better visualize market structure and time your trades more effectively. Happy trading!
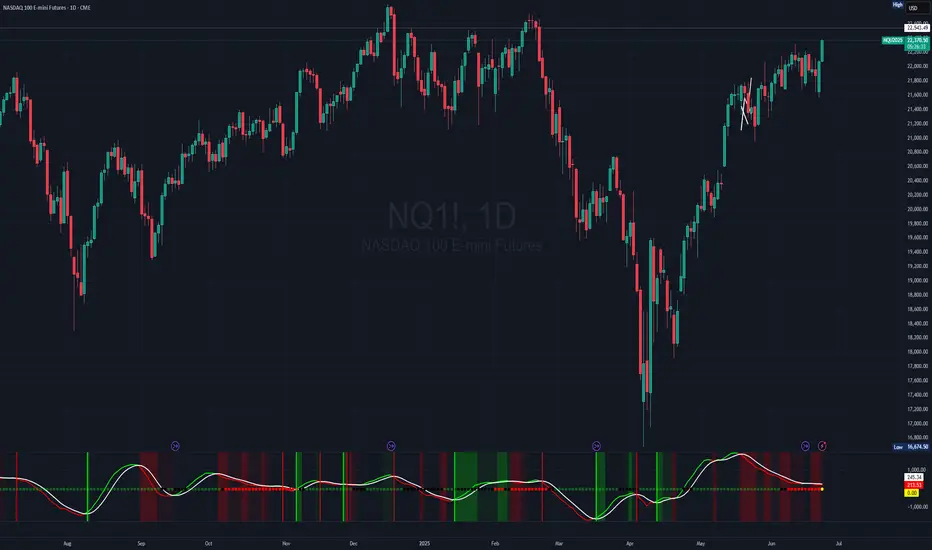
Aqua MTF Trend Oscillator——————————————————————————————————————————————————————————
The Aqua Multi-Timeframe (MTF) Trend Oscillator is a comprehensive momentum and trend analysis tool designed to synthesize
complex market dynamics into a single, intuitive oscillator. It moves beyond single-timeframe analysis by aggregating
trend information from up to five distinct, user-configurable sources—spanning different timeframes, symbols, and
moving average types.
--- CORE CONCEPT ---
The strength and direction of a trend are rarely uniform across all market perspectives. This indicator's core
principle is to quantify and weigh the trend's character from multiple angles simultaneously. By blending these
perspectives, it generates a composite score that reflects the overall "consensus" of trend momentum, providing
a more robust view than any single moving average could offer alone.
--- METHODOLOGY ---
The indicator's power lies in its sophisticated, multi-step normalization process for each analysis slot:
1. **MA Calculation:** A standard moving average (e.g., EMA, SMA) is calculated for the specified source, symbol, and timeframe.
2. **Volatility-Normalized Distance:** It first measures the deviation of price from its moving average in terms
of Average True Range (ATR) units. This volatility-normalization step is crucial for comparing trend strength
across different timeframes or instruments, as it measures distance in a context-aware manner.
3. **Magnitude Squashing:** This ATR-based distance is then passed through a hyperbolic tangent (`tanh`) squashing
function. This elegantly transforms the potentially unbounded measurement into a standardized score oscillating
between -1 (maximum bearish magnitude) and +1 (maximum bullish magnitude). This prevents extreme outliers in one
timeframe from disproportionately skewing the final result.
4. **Weighted Aggregation:** Each of these normalized (-1 to +1) scores is then combined based on a user-defined
weight. The weighted average of all enabled slots produces the final composite score.
5. **Final Scaling & Smoothing:** The composite score is scaled to oscillate between -100 and +100. An optional
final smoothing pass can be applied to this master line to reduce noise and clarify the overall trend.
All higher-timeframe calculations are performed correctly within their native context to ensure the indicator is
non-repainting and provides a stable, reliable output on the chart.
--- KEY FEATURES ---
• **Five Independent Analysis Slots:** Fully customize up to five sources, each with its own symbol, timeframe, MA type, period, and weight.
• **Advanced Normalization:** Utilizes ATR and the hyperbolic tangent function for robust, comparable trend magnitude scores.
• **Correct MTF Calculation:** Employs best practices for non-repainting data requests, ensuring historical and real-time results are consistent.
• **Weighted Composite Score:** Assign importance to different timeframes to tailor the oscillator to your specific analytical needs.
• **Optional Master Smoothing:** Apply a final MA to the composite score line for enhanced clarity and signal filtering.
• **Clear Visualization:** A simple, color-coded oscillator line shows the final trend score, while individual component trends can also be plotted.
--- HOW TO INTERPRET ---
• **Zero Line Cross:** A cross above 0 indicates that the weighted balance of trend components has shifted to bullish. A cross below 0 signals a shift to bearish.
• **Oscillator Magnitude:** Values approaching +100 suggest a strong, broad-based uptrend consensus. Values nearing -100 indicate a strong downtrend consensus.
• **Slope:** The slope of the oscillator line indicates the accelerating or decelerating nature of the aggregate trend momentum.
• **Divergence:** As with any oscillator, watch for divergences between price action and the oscillator, which can signal a potential exhaustion of the prevailing trend.
Author: Aquaritek
——————————————————————————————————————————————————————————

[JHF] SQZMOMPRO SQZMOMPRO is a sophisticated, momentum-based technical indicator designed for traders seeking to identify potential trend reversals, momentum shifts, and periods of market consolidation (squeezes) across multiple timeframes. By combining a momentum oscillator, Bollinger Bands, Keltner Channels, and a Percentage Volume Oscillator (PVO), it provides a comprehensive view of price momentum and volume dynamics.
Overview
The SQZMOMPRO indicator is a powerful tool that integrates momentum analysis, volatility-based squeeze detection, and volume confirmation to help traders identify high-probability trading opportunities. It combines:
A momentum oscillator based on price deviations from a linear regression and moving average.
Bollinger Bands and Keltner Channels to detect periods of low volatility (squeezes), signaling potential breakouts.
A Percentage Volume Oscillator (PVO) to confirm momentum signals with volume trends.
A Rate of Change (ROC) line to highlight the speed of momentum shifts.
Visual cues like reversal signals and confluence backgrounds for actionable insights.
This indicator is ideal for swing traders, day traders, and those analyzing trends across multiple timeframes (hourly, 4-hour, daily, weekly, monthly). It is plotted below the price chart (non-overlay) and includes customizable alerts for key conditions.
Key Features
Multi-Timeframe Support: Automatically adjusts parameters for hourly, 4-hour, daily, weekly, and monthly charts, ensuring optimal settings for each timeframe.
Squeeze Detection: Identifies periods of low volatility (squeezes) using Bollinger Bands and Keltner Channels, categorized as Wide, Normal, Narrow, or Very Narrow.
Momentum Oscillator: Tracks price momentum relative to a baseline, with a signal line to highlight trend reversals.
PVO Confluence: Optionally integrates the Percentage Volume Oscillator to confirm momentum signals with volume trends.
Rate of Change (ROC): Displays the smoothed rate of change of momentum for enhanced readability.
Visual Cues: Includes color-coded squeeze dots, momentum/signal lines, reversal markers, and optional confluence backgrounds.
Alerts: Configurable alerts for squeeze conditions, trend reversals, and volume-confirmed signals.
How It Works
1. Momentum Oscillator
The momentum oscillator is calculated as follows:
Source: Closing price.
Baseline: A combination of the midpoint of the highest high and lowest low over a specified period, adjusted by a simple moving average (SMA).
Momentum: Linear regression of the price deviation from this baseline over a timeframe-specific period (shorter for smaller timeframes to be more responsive).
Signal Line: A 5-period SMA of the momentum value, used to identify crossovers.
Interpretation:
Momentum > Signal: Bullish momentum (plotted in green by default).
Momentum < Signal: Bearish momentum (plotted in red by default).
Crossovers: Momentum crossing above the signal line suggests a bullish reversal; crossing below suggests a bearish reversal.
2. Squeeze Detection
Squeezes occur when volatility contracts, often preceding significant price moves. The indicator compares:
Bollinger Bands: Calculated using an SMA and 2 standard deviations of the closing price.
Keltner Channels: Calculated using an SMA and multiples of the Average True Range (ATR) for different squeeze thresholds (Wide, Normal, Narrow, Very Narrow). This method steers away from the likes of classical SQZPRO which only uses an approximation of the Average True Range and heavily affects the squeeze sensitivity due to the way they calculate their Keltner Channel (our Keltner Channel are true to the way they are supposed to be calculated).
Squeeze Conditions:
Wide Squeeze: Bollinger Bands are inside Keltner Channels with a high ATR multiplier.
Normal Squeeze: Bollinger Bands are inside Keltner Channels with a moderate ATR multiplier.
Narrow Squeeze: Bollinger Bands are inside Keltner Channels with a low ATR multiplier.
Very Narrow Squeeze: Bollinger Bands are inside Keltner Channels with a very low ATR.
No Squeeze: Bollinger Bands are outside Keltner Channels, indicating higher volatility.
Depending on the timeframe, each squeeze level has been manually tweaked to gain an edge, whether you're scalping, in swings or in Leaps.
Visuals: Squeeze conditions are plotted as colored dots on the zero line:
Green: No Squeeze
Black: Wide Squeeze
Red: Normal Squeeze
Yellow: Narrow Squeeze
Purple: Very Narrow Squeeze
3. Percentage Volume Oscillator (PVO)
The PVO measures volume momentum, similar to the MACD but applied to volume through a 14 and 28 ema with volume as the srouce.
Interpretation:
PVO > 0: Increasing volume momentum (bullish).
PVO < 0: Decreasing volume momentum (bearish).
When enabled (Show PVO Confluence), the indicator highlights periods where momentum and PVO align (e.g., bullish momentum with PVO > 0).
4. Rate of Change (ROC)
Formula: Smoothed difference between momentum and signal line, multiplied by a user-defined factor (ROC Multiplier).
Purpose: Enhances readability of momentum shifts, plotted as a blue (positive) or orange (negative) line when enabled.
5. Reversal Signals
Bullish Reversal: Momentum crosses above the signal line, optionally confirmed by PVO > 0. Marked with a green vertical line.
Bearish Reversal: Momentum crosses below the signal line, optionally confirmed by PVO < 0. Marked with a red vertical line.
6. Confluence Background
When Show PVO Confluence is enabled, the background is colored to highlight alignment:
Bullish Confluence: Momentum > Signal and PVO > 0 (green background, darker if ROC is positive).
Bearish Confluence: Momentum < Signal and PVO < 0 (red background, darker if ROC is negative).
Inputs
Basic Configuration:
Display Reversals: Show/hide reversal markers for momentum/signal crossovers (default: true).
Show PVO Confluence: Enable/disable background coloring for momentum and PVO alignment (default: false).
Rate of Change:
Show Rate of Change Line: Display the ROC line (default: false).
ROC Smoothing Length: Smoothing period for ROC (default: 1, min: 1).
ROC Multiplier: Scales ROC for readability (default: 1, min: 1).
Plotline Colors:
Bullish Momentum: Green (default: RGB(0, 255, 0)).
Bearish Momentum: Red (default: RGB(255, 0, 0)).
Signal Line: White (default: RGB(255, 255, 255)).
Squeeze Colors:
No Squeeze: Green.
Wide Squeeze: Black.
Normal Squeeze: Red.
Narrow Squeeze: Yellow.
Very Narrow Squeeze: Purple.
Timeframe-Specific Parameters
The indicator adapts to the chart’s timeframe, using predefined settings.
Hourly, 4-Hour, Daily, Weekly and Monthly (and everything in between) all have custom, tweaked momentum length, ATR length, and squeeze multiplier threshold to suit the sensitivity needed for the current timeframe.
Trading Applications
Squeeze Breakouts:
A transition from a Very Narrow or Narrow Squeeze to No Squeeze often signals a breakout. Combine with momentum crossovers for confirmation.
Example: Enter a long position when a Narrow Squeeze (yellow dots) turns to No Squeeze (green dots) and momentum crosses above the signal line.
Trend Reversals:
Bullish reversal (green line) with PVO > 0 confirms strong buying volume, increasing the likelihood of a sustained uptrend.
Bearish reversal (red line) with PVO < 0 suggests strong selling pressure.
Confluence Trading:
Use confluence backgrounds to trade only when momentum and volume align, reducing false signals.
Example: A bullish confluence (green background) with positive ROC indicates a high-probability long setup.
Divergences:
Look for divergences between price and momentum or PVO. For instance, a higher low in momentum/PVO with a lower low in price suggests a bullish reversal.
Trend Confirmation:
Use the momentum oscillator and ROC to confirm price trends. A rising momentum and positive ROC validate an uptrend.
Alerts
Squeeze Alerts:
🟢 No Squeeze: Volatility is expanding.
⚫ Low Squeeze: Wide squeeze detected.
🔴 Normal Squeeze: Moderate squeeze detected.
🟡 Tight Squeeze: Narrow squeeze detected.
🟣 Very Tight Squeeze: Very narrow squeeze detected.
Reversal Alerts:
🐂 Bullish Trend Reversal: Momentum crosses above signal.
🐻 Bearish Trend Reversal: Momentum crosses below signal.
🐂 Bullish Trend Reversal + 📊 PVO Confluence: Momentum crossover with PVO > 0.
🐻 Bearish Trend Reversal + 📊 PVO Confluence: Momentum crossover with PVO < 0.
Limitations
Lagging Nature: The momentum oscillator and PVO rely on moving averages, which may lag sudden price or volume spikes.
False Signals: Squeezes and crossovers can occur in choppy markets, leading to whipsaws. Confirm with price action or other indicators.
Timeframe Sensitivity: Results vary by timeframe; test settings for your trading style (e.g., shorter lengths for day trading).
How to Use
Add to Chart: Apply the indicator to any TradingView chart (non-overlay).
Customize Settings:
Enable Display Reversals for crossover markers.
Enable Show PVO Confluence for volume confirmation.
Adjust ROC Smoothing and ROC Multiplier for clearer ROC visuals.
Customize colors for better visibility.
Interpret Signals:
Monitor squeeze dots for volatility changes.
Watch for momentum/signal crossovers and confluence backgrounds.
Use ROC to gauge momentum strength.
Set Alerts: Configure alerts for squeezes, reversals, or confluence signals to stay informed.
Example Scenario
Setup: A stock in a Very Narrow Squeeze (purple dots) on the daily chart, with momentum below the signal line and PVO < 0.
Signal: Momentum crosses above the signal line, PVO turns positive, and the squeeze transitions to No Squeeze (green dots).
Action: Enter a long position, targeting the next resistance level, with a stop-loss below recent support. The green confluence background and positive ROC confirm the trade.
Conclusion
The SQZMOMPRO indicator is a versatile tool for traders seeking to capitalize on momentum, volatility, and volume trends. Its multi-timeframe adaptability, visual clarity, and robust alert system make it suitable for various trading strategies. Combine with price action, support/resistance, or other indicators for optimal results. For feedback or suggestions, feel free to leave a comment.
Liquidity Zones (JTS)Title: Liquidity Zones (JTS)
Description:
This script marks out key liquidity zones using pivot highs and lows. It includes:
Buy-Side Liquidity (Highs): Shown in red lines
Sell-Side Liquidity (Lows): Shown in green lines
Sweep Protection: Zones will only be removed after a defined number of bars AND a true sweep beyond the level
Toggle Controls: Enable/disable highs or lows individually
Adjustable Settings: Pivot length, sweep delay, max lines, and colors
Perfect for traders looking to track untapped or recently swept liquidity.
Created by JTS
For educational and strategic use

Sell to Buy / Buy to SellSell to Buy / Buy to Sell — Momentum Shift Detector
The Sell to Buy / Buy to Sell indicator detects simple but powerful two-bar momentum shift patterns directly on your chart, offering early insights into potential reversals or strong breakout continuation.
🔎 How it works:
Sell to Buy (StB):
Previous candle (bar -1) is bearish
Current candle (bar 0) is bullish
The bullish candle closes above the high of the previous bearish candle
Confirmed only after bar close
Buy to Sell (BtS):
Previous candle (bar -1) is bullish
Current candle (bar 0) is bearish
The bearish candle closes below the low of the previous bullish candle
Confirmed only after bar close
🎯 Key Features:
✅ Pure price action logic — no indicators, no oscillators
✅ Immediate visual markers:
Green "StB" label for bullish momentum shifts
Red "BtS" label for bearish momentum shifts
✅ Full alert system to notify you in real-time when either pattern occurs
⚙ Who is this for?
Scalpers looking for short-term momentum shifts
Swing traders identifying potential reversals or breakout confirmations
Price action traders who want clean and objective setup detection
The Sell to Buy / Buy to Sell indicator is designed to give you clear and simple signals whenever the market shows decisive strength after a short-term opposite move — potentially marking the start of a new impulse.

Aqua MTF Stochastic Oscillator——————————————————————————————————————————————————————————
The Aqua Multi-Timeframe (MTF) Stochastic Oscillator is a comprehensive momentum analysis tool that synthesizes
stochastic data from up to five distinct, user-configurable sources and timeframes into a single, unified view.
--- CORE CONCEPT ---
Traditional oscillators provide insight into one specific timeframe. This indicator overcomes that limitation by
aggregating momentum readings from multiple timeframes. The core principle is to gauge the confluence of momentum
across different market cycles. A strong trend is often characterized by aligned momentum across short-term,
medium-term, and long-term perspectives. This tool visualizes that alignment in a clear, intuitive oscillator.
--- METHODOLOGY ---
For each of the five analysis slots, the script calculates the Stochastic %K line and its corresponding %D signal line.
To allow for direct comparison and weighting, each of these standard 0-100 oscillator values is then normalized
to a bipolar scale of -100 to +100, where 0 represents the neutral midline.
These normalized scores are then blended, according to user-defined weights, into two master composite lines:
1. A master "Score Line" representing the weighted average of the raw %K momentum values.
2. A master "Signal Line" representing the weighted average of the smoothed %D signal values.
--- KEY FEATURES ---
• Multi-Timeframe & Multi-Symbol Analysis: Configure up to five slots, each with its own symbol, timeframe, price source, and stochastic settings.
• Normalized Momentum Scale: All stochastic values are re-scaled to a -100 to +100 range, providing a standardized measure of momentum. Values above 0 indicate bullish momentum, while values below 0 indicate bearish momentum.
• Weighted Composite Score: User-defined weights allow for prioritizing certain timeframes, creating a custom-tailored final momentum reading.
• Dynamic Color-Coding: The color of the master Score Line and each individual timeframe's line instantly changes based on its position relative to its signal line (%K vs. %D). This provides immediate visual feedback on momentum acceleration (bullish) or deceleration (bearish).
--- HOW TO INTERPRET ---
• Crossovers: The interaction between the master Score Line and the Signal Line can be used to identify potential shifts in momentum, similar to a traditional MACD.
• Line Color: The color of the master Score Line itself serves as a primary signal. A bullish color indicates that overall raw momentum is leading smoothed momentum, and vice-versa.
• Overbought/Oversold Levels: Extreme readings near the +100 or -100 levels suggest that the aggregated momentum may be overextended and due for a reversion.
• Zero Line Crosses: When the oscillator crosses above the zero line, it signals that the balance of momentum has shifted to positive territory. A cross below zero signals a shift to negative territory.
• Divergence: Look for divergences where price makes a new high or low, but the oscillator fails to confirm it. This can often signal a pending reversal.
Author: Aquaritek
——————————————————————————————————————————————————————————

HyperFlowIntroduction
HyperFlow is a premium market structure and liquidity rotation model built around the principles of internal inefficiencies, tested imbalances, and delivery shifts. Drawing inspiration from ICT concepts, it provides a high-level framework for identifying smart money footprints and timing entries with precision.
Rather than forecasting direction, HyperFlow focuses on recognizing repeatable delivery behaviors — helping traders visually track liquidity shifts from internal ranges to external objectives with consistency.
Core Philosophy
Markets are governed by the logic of liquidity engineering — the search and destruction of internal inefficiencies (Fair Value Gaps), followed by continuations toward external liquidity.
Timeframes to use:
HTF -> LTF
5m -> 15s
15m -> 1m
1h -> 5m
4h -> 15m
Daily -> 1h
Weekly -> 4h
Monthly -> 1D
HyperFlow identifies these transitions by:
Detecting High Timeframe Fair Value Gaps (HTF FVGs) — structural imbalances created by displacement
Tracking Valid Tests of those FVGs — signaling willingness to respect internal structure
Filtering for Delivery Confirmations — only acting when price delivers with intent through reclaimed imbalances
Mapping Risk and Objective Zones — using recent swing structures to define stop and target logic rooted in market logic
All components are reactive, visual, and non-repainting — designed to highlight structure after it forms, not anticipate it prematurely.
Key Features
Internal Range Liquidity Zones: Cleanly marked HTF imbalances show where price may seek efficiency
Tested FVG Filtering: Signals only form on valid rebalances — we wait for proof, not potential
Shift in Delivery Conditions: Price must show intent to reclaim imbalance before any rotation is considered
Automatic Objective Mapping: Recent structural highs/lows are used to project stop and target zones automatically
Session Filters + Time Alignment: Restrict signals to high-probability hours or defined killzones
Minimal, High-Impact Visuals: Tested/untested FVGs are differentiated by transparency and tone, keeping your chart clean and focused
HyperFlow is built for:
Traders who understand price delivery theory
Analysts studying displacement → reversion → continuation
Those seeking higher timeframe bias alignment through tested structure
Users of ICT-based concepts who want a visual, rules-based companion
This is not a beginner's tool. It’s for those seeking repeatable execution through structure and refinement, not guesswork.
Terms and Conditions
Our charting tools are products provided for informational and educational purposes only and do not constitute financial, investment, or trading advice. Our charting tools are not designed to predict market movements or provide specific recommendations. Users should be aware that past performance is not indicative of future results and should not be relied upon for making financial decisions. By using our charting tools, the purchaser agrees that the seller and the creator are not responsible for any decisions made based on the information provided by these charting tools. The purchaser assumes full responsibility and liability for any actions taken and the consequences thereof, including any loss of money or investments that may occur as a result of using these products. Hence, by purchasing these charting tools, the customer accepts and acknowledges that the seller and the creator are not liable nor responsible for any unwanted outcome that arises from the development, the sale, or the use of these products. Finally, the purchaser indemnifies the seller from any and all liability. If the purchaser was invited through the Friends and Family Program, they acknowledge that the provided discount code only applies to the first initial purchase of any SMCapital product. The purchaser is therefore responsible for cancelling – or requesting to cancel – their subscription in the event that they do not wish to continue using the product at full retail price. If the purchaser no longer wishes to use the products, they must unsubscribe from the membership service, if applicable. We hold no reimbursement, refund, or chargeback policy. Once these Terms and Conditions are accepted by the Customer, before purchase, no reimbursements, refunds or chargebacks will be provided under any circumstances.
By continuing to use these charting tools, the user acknowledges and agrees to the Terms and Conditions outlined in this legal disclaimer.

10x HTF Candles Dynamic with LTF FVG and Key LevelsPurpose
The 10x HTF Candles Dynamic Pine Script is a versatile, all-in-one trading tool designed for TradingView to empower traders with actionable insights across multiple timeframes. It combines advanced price action analysis, Fair Value Gap (FVG) detection, market structure evaluation, and key level visualization into a single, highly customizable interface. Built for day traders, swing traders, and scalpers, this script enhances decision-making by providing a clear, multi-dimensional view of market dynamics, liquidity zones, and trend biases. Its purpose is to streamline technical analysis, reduce chart clutter, and deliver real-time, visually intuitive data to support precise trading strategies.
What the Script Does
How the Script Works:
The script leverages Pine Script v5’s advanced features to deliver a robust and efficient trading tool. Below is a step-by-step explanation of its functionality:
1. Initialization and Configuration:
- Initializes with @version=5, enabling dynamic requests, and sets limits for bars (500), lines, labels, boxes, and polylines to manage resources.
- Defines user inputs for candle settings, timeframe selection, FVG parameters, DWM levels, market structure table, and visual preferences.
- Dynamically calculates 10 higher timeframes based on the current chart timeframe (e.g., 1m chart → 5m, 15m, 60m, etc.) or allows custom timeframes.
2. Data Acquisition:
- Fetches OHLC data for up to 10 timeframes using request.security, storing it in optimized TfData objects (arrays for open, high, low, close).
- Loops through enabled timeframes to minimize redundant code, improving processing speed.
3. Candlestick Rendering:
- Draws HTF candlesticks at user-defined offsets, with customizable bullish/bearish colors, wick colors, and widths.
- Calculates bar types (Inside, Normal, Outside) and optionally labels them above candles for pattern analysis.
4. FVG Detection and Visualization:
- Scans for FVGs by comparing candle highs and lows across three bars (e.g., low of candle 1 > high of candle 3 for bullish FVG).
- Detects IFVGs based on user-selected methods (wick, close, or midpoint) and highlights them with distinct colors.
- Draws FVG boxes with configurable borders, midpoint lines, and labels, tracking mitigation status.
- Limits FVG display to a user-defined maximum (1–200) to maintain chart clarity.
5. Horizontal Levels and DWM Lines:
- Computes Highs, Lows, Midpoints, and Quarter Points for each timeframe, drawing lines with customizable styles and extensions.
- Plots DWM open, close, high, low, and control point lines, with optional alerts for high/low breaks.
- Supports session-based opening price lines (e.g., 09:30 Market Open) with similar customization.
6. Market Structure and Bias:
Calculates trend bias by comparing the current close to the midpoint of the timeframe’s range (highest high to lowest low).
Updates a market structure table with timeframe, bias, and premium/discount status, using color-coded cells for quick interpretation.
7. Countdown Timers:
- Converts timeframe strings to seconds and calculates the time remaining until the next candle using timenow.
- Renders countdown labels with timeframe names (e.g., “1h (00:45)”) at user-defined positions.
8. Optimization and Cleanup:
- Uses VisualElements UDTs to manage lines, wicks, and labels, reducing memory usage.
- Deletes outdated drawings when limits are exceeded, ensuring a clean and responsive chart.
- Employs loops and arrays to streamline repetitive tasks, enhancing performance.
How to Use the Script:
This script is user-friendly yet powerful, suitable for traders of all experience levels. Follow these steps to maximize its potential:
1. Add to TradingView:
- Copy the script into TradingView’s Pine Editor.
- Click “Add to Chart” to apply it to your active chart.
2. Customize Settings:
- Candle Settings: Adjust the number of candles (1–10), starting position, group spacing, bullish/bearish colors, wick colors, and candle width.
- Timeframe Settings: Enable/disable up to 10 timeframes, choosing dynamic (auto-selected) or custom timeframes (e.g., 3m, 60m, D).
- FVG Settings: Toggle FVG detection, set detection methods (wick/close/midpoint), adjust thresholds, and customize colors, borders, and midpoint lines.
- DWM Settings: Enable daily/weekly/monthly lines (open, close, high, low, midpoint), set colors, and configure alerts for high/low breaks.
- Market Structure Table: Show/hide columns for timeframe, trend bias, and premium/discount, and adjust table position (top-left, bottom-right, etc.).
- Countdown Timers: Enable timers, adjust offsets, and customize text/background colors.
- Label Settings: Configure price label precision, transparency, and offsets for clarity.
3.Interpret Visuals:
- Candlesticks: Analyze HTF candles to gauge trend direction and momentum across timeframes.
- FVGs: Look for unmitigated FVGs (colored boxes) as potential support/resistance zones or trade setups.
- Key Levels: Use Highs, Lows, Midpoints, and Quarter Points to identify breakout or reversal areas.
4. Market Structure Table: Check trend bias and premium/discount status to align trades with market conditions.
- DWM Lines: Monitor daily/weekly/monthly levels for institutional reference points.
- Countdown Timers: Time entries/exits based on upcoming candle formations.
5. Integrate with Strategy:
- Combine script insights with your trading plan (e.g., use FVGs for entries, key levels for stops/targets).
- Set alerts for high/low breaks or liquidity zone approaches to stay proactive.
- Export table data or screenshot visuals for documentation and analysis.
6. Optimize Performance:
Limit the number of candles, FVGs, and lines to match your device’s capabilities.
Regularly review settings to focus on the most relevant timeframes and features.
Why the Script is Original
The 10x HTF Candles Dynamic script stands out in the TradingView community due to its innovative design, comprehensive functionality, and trader-centric approach. Here’s what makes it unique:
1. Seamless Multi-Timeframe Integration:
- Unlike single-timeframe indicators, this script synthesizes data from up to 10 timeframes, offering a holistic view of market structure.
- Dynamic timeframe selection adapts to the chart’s timeframe, ensuring relevance across all trading styles.
2 . Advanced FVG and IFVG Detection:
- Provides granular control over FVG detection with three IFVG methods (wick, close, midpoint), a rarity in most scripts.
- Tracks mitigation status and highlights unmitigated FVGs, enabling traders to capitalize on high-probability setups.
- Visualizes FVGs with boxes, midpoint lines, and labels, enhancing clarity and usability.
3. Sophisticated Market Structure Analysis:
-The bias calculation, introduced in recent updates (2 days ago), uses a robust algorithm to assess trend direction based on range midpoints.
- The market structure table, with premium/discount zones (added 20 hours ago), offers a unique summary of market conditions, unmatched by standard indicators.
4. Comprehensive DWM and Session Support:
- Integrates daily, weekly, and monthly levels alongside session-based opening prices, catering to institutional and retail traders alike.
- Customizable alerts for high/low breaks add actionable functionality.
5. Visual Hierarchy and Clarity:
- Scales line widths and transparency by timeframe, prioritizing higher timeframes for strategic focus.
- Countdown timers provide real-time context, a feature rarely seen in multi-timeframe scripts.
6.Performance Optimization:
- Recent updates introduced loops and UDTs to reduce code redundancy and boost processing speed.
- Automated cleanup mechanisms prevent chart clutter, ensuring smooth operation even on low-resource devices.
7. High Customizability:
- Offers extensive settings for visuals, timeframes, FVGs, DWM lines, and alerts, accommodating diverse trading preferences.
- Balances complexity with accessibility, making it approachable for beginners and powerful for advanced users.
8.Continuous Evolution:
- Regular updates (e.g., bias filter table, premium/discount feature, code optimization) demonstrate ongoing commitment to improvement.
- Closed-source protection (noted 20 hours ago) ensures intellectual integrity while allowing free use, fostering trust in the TradingView community.
Conclusion
The 10x HTF Candles Dynamic Pine Script is a groundbreaking tool that redefines multi-timeframe analysis on TradingView. By combining candlestick visualization, FVG detection, market structure insights, DWM levels, and countdown timers, it provides traders with a comprehensive, real-time view of market dynamics. Its advanced optimization, customization options, and continuous updates make it a standout choice for traders seeking precision, clarity, and efficiency. Whether you’re scalping intraday moves or swing trading weekly trends, this script equips you with the tools to master the markets with confidence.

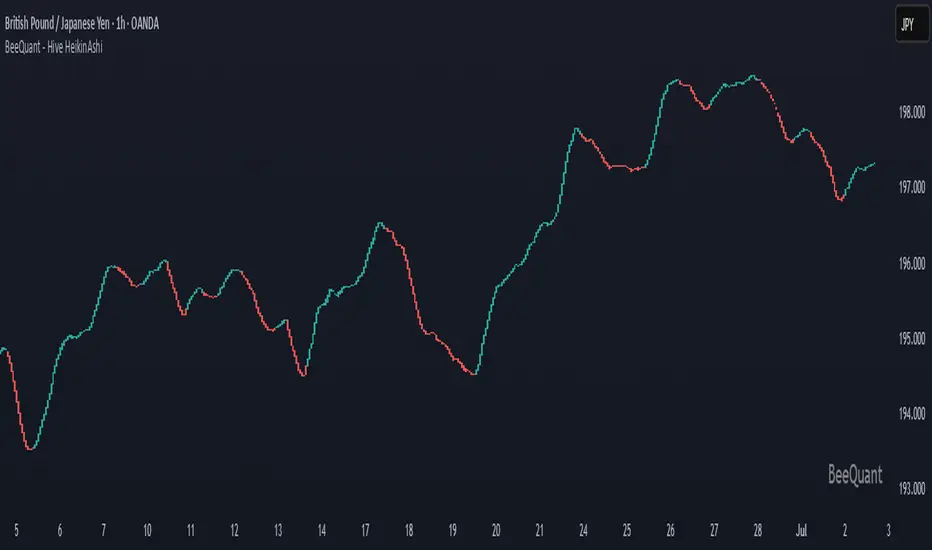
BeeQuant - Hive HeikinAshi💠 OVERVIEW
The "Hive HeikinAshi" is your ultimate tool for simplifying the chaotic world of price charts. Imagine a specialized lens that cuts through all the market "noise" – those tiny, confusing movements – and reveals the clear, underlying current of price action. This indicator transforms standard, sometimes choppy, candlestick charts into a powerful, trend-focused visualization. It’s designed to help every trader, whether you're a discretionary trader seeking cleaner structures or a quant enthusiast looking for visual cues to complement models, Hive HeikinAshi provides a simplified yet highly informative lens through which to read price action.
Its main advantage lies in its seamless compatibility with external indicators — offering a next-level smoothing foundation that enhances the clarity and reliability of any existing trend, momentum, or signal-based system layered on top of it.
__________________________________________________________________________
🧠 CONCEPTS
At its core, the "Hive HeikinAshi" isn't just another way to look at candles; it's a profound re-interpretation of price dynamics. It employs a sophisticated internal process to distill raw market movements into a more coherent, trend-identifying display, making the market's story incredibly easy to read.
The "Hive" Transformation: Unlike traditional candlesticks that show every small price fluctuation, the "Hive HeikinAshi" candles are intelligently constructed to smooth out the data. They are derived from a multi-point calculation process, creating a new, more consistent visual representation of price. This transformation helps to reduce the "visual clutter" and make trend following a much more intuitive experience. You'll see the forest, not just the trees.
⬜ Highlights dominant price direction by filtering reactive fluctuations
⬜ Visually separates impulsive vs corrective behavior with clear color transitions
⬜ Enables quicker discretionary recognition of trend shifts without complex overlays
⬜ Ideal for confirming momentum zones and stable trending phases
⬜ The Intelligent Filter. An optional yet powerful "Filter" mechanism has been integrated, providing an additional layer of analytical discernment.
⬜ Designed to integrate natively with trend-following, oscillator, or signal indicators — enabling amplified precision across diverse trading systems
A significant advantage of the "Hive HeikinAshi" is its inherent ability to minimize distracting "noise" from typical candle wicks. While standard candles can often show long, confusing wicks that obscure the true body direction, our specialized candles are engineered to emphasize the core directional move. This intelligent design allows you to focus on the momentum generated by the candle's body, rather than getting sidetracked by fleeting price extremes, thereby providing a cleaner, more reliable visual of trend strength.
__________________________________________________________________________
✨ FEATURES
Hive HeikinAshi includes several key features designed for both clarity and functionality:
🔹Multi-Bar Averaging
Generates a visually balanced candle structure using averaged pricing across configurable recent bars.
🔹 Wickless Visualization
Candles are rendered without upper/lower shadows, enhancing trend detection and reducing signal confusion.
🔹 Signal Filter
Adaptive color filter using a dynamic high/low lookback logic
🔹 Directional Color Coding
Clean green/red coloring helps instantly interpret bullish or bearish pressure.
🔹 Adjustable History Depth
Customize how many bars are considered in the smoothing process to match your style and timeframe.
🔹 Invisible Price Feed Outputs
Underlying smoothed OHLC values are available for custom strategies or overlays.
🔹Non-Repainting Logic for Historical Reliability
Each "Hive HeikinAshi" is plotted only when its internal reconstruction conditions are fully met and confirmed. This ensures that the historical display of HeikinAshi does not repaint, providing a high degree of reliability and trust in past signals and visualizations.
🔹Cross-Market Versatility
This indicator is engineered to perform with precision across all major markets—whether you're trading forex, commodities, stocks, or indices. Its adaptive logic automatically aligns with the unique volatility and structure of each asset class, delivering consistently reliable insights no matter where you trade.
__________________________________________________________________________
⚙️ USAGE
Using Hive HeikinAshi is simple and effective:
📥 Add to Chart
Once access is granted, apply the indicator to any timeframe or asset directly from your TradingView invite-only indicators list.
⚙️ Tweak “No. of Bars”
This setting controls how far back the smoothing engine looks.
• Lower values = more responsive, shorter-term smoothing
• Higher values = steadier candles, better for macro trends
🎚️ Next, consider the "Filter" option:
Turn this on to activate the advanced filtering mechanism. Then, adjust the "lookback bars" (from 1 to 10). A smaller number here will make the filter more responsive to immediate "Hive HeikinAshi" candle extremes, while a larger number will require a more sustained breakout from the recent filtered range. Experiment to discover the optimal "sweet spot" that best reveals the underlying market flow for your specific strategy. The tooltip guides you to this optimal setting.
Disable "Filter": If turned off, the candles will revert to a more direct HeikinAshi coloration based purely on their calculated open and close, without the additional layer of range filtering.
🔍 Interpreting Candles
• 🟢 Green Candle: Bullish continuation zone
• 🔴 Red Candle: Bearish pressure dominates
• Lack of wick = strong directional conviction
Combine with your favorite indicators — Hive HeikinAshi acts as a foundation to reduce noise and enhance clarity across tools like EMAs, MACD, VWAP, and more.
__________________________________________________________________________
⚠️ LIMITATIONS
While Hive HeikinAshi provides clear visual advantages, it is important to understand its scope:
👉 Not a Signal Generator: This indicator excels at identifying and confirming trends, making it less suitable for pinpointing exact, high-frequency entry and exit points that require unadulterated real-time price. It prioritizes overall directional clarity.
👉 Lag by Design: Due to multi-bar data smoothing, candles reflect stable price behavior but not ultra-short-term fluctuations.
👉 No Volume or Macro Inputs: Hive HeikinAshi focuses purely on price structure — it does not include volume, news, or external conditions.
👉 Filter Calibration: While the "Filter" enhances clarity, its effectiveness is dependent on appropriate "lookback bars" calibration. Users should understand that adding filtering inherently balances responsiveness with a more refined signal, and finding the optimal setting is part of the analytical process.
█ ▒▒▒▒▒▒▒▒▒▒▒▒▒▒▒▒▒▒▒▒▒▒▒ 『•••• ✎ ••••』 ▒▒▒▒▒▒▒▒▒▒▒▒▒▒▒▒▒▒▒▒▒▒▒▒ █
🎯 CONCLUSION
Hive HeikinAshi is a powerful visual companion for modern traders seeking smoother, clearer price trends. By combining directional clarity with reduced chart clutter, it allows you to interpret the market with less noise and more confidence. Seamlessly integrate this advanced visual tool within your analytical framework to gain a sharper, more confident perspective, and elevate your strategic decision-making in the markets. It's about seeing the unseen, with clarity.
▣▣▣▣▣▣▣▣▣▣▣▣▣▣▣▣▣▣▣▣▣▣▣▣▣▣▣▣▣▣▣▣▣▣▣▣▣▣▣▣▣▣▣▣▣▣▣▣▣▣▣
🚨 RISK DISCLAIMER
Engagement in financial market speculation inherently carries a substantial degree of inherent risk, and the potential for capital diminution, potentially exceeding initial deposits, is a pervasive and non-trivial consideration. All content, algorithmic tools, scripts, articles, and educational materials disseminated by "Hive HeikinAshi" are exclusively purposed for informational and pedagogical objectives, strictly for reference. Historical performance data, whether explicitly demonstrated or implicitly suggested, offers no infallible assurance or guarantee of future outcomes. Users bear sole and ultimate accountability for their individual trading decisions and are emphatically urged to meticulously assess their financial disposition, risk tolerance parameters, and conduct independent due diligence prior to engaging in any speculative market activity.
BeeQuant - Hive Visualizer💠 OVERVIEW
The " Hive Visualizer " is a game-changing, invite-only tool, expertly designed to give every trader, from beginner to experienced, instant and clear visual clues about what price is doing. Its main job is to easily show you the highest and lowest points price has reached recently. Think of it as a smart, automated helper that colors your candles to reveal powerful market moves. This helps you quickly see if prices are getting stronger or weaker right on your chart. It's a groundbreaking, high-quality tool that cuts through the noise, making it simple to spot key moments when the market is about to make a big move up or down, giving you an edge.
__________________________________________________________________________
🧠 CONCEPTS
The core philosophy behind Hive Visualizer is rooted in contextual volatility exposure and directional bias reinforcement. Through a sophisticated internal mechanism that evaluates local maxima/minima behavior within a compact temporal field, the indicator provides adaptive color‑based candle transitions that align with latent directional pressure.
1. Uses localized equilibrium breach detection to monitor directional intent and exhaustion points.
2. Embeds a dynamically updating framework that reacts to both trend continuation and structural reversals.
3. Avoids false positives by disregarding noisy fluctuations below system‑defined relevance thresholds.
4. Provides non‑repainting, fully forward‑confirmed visual outputs for reliable retrospective analysis.
Hive Visualizer is not designed to be predictive. Instead, it allows traders to observe the evolution of price structure in a cleaner and more digestible format, supporting high-confidence discretionary execution or automated model overlays.
__________________________________________________________________________
✨ FEATURES
The "Hive Visualizer" comes with a suite of smart features, all designed for amazing clarity, quick reactions, and deeper understanding, making your charting experience truly effortless:
🔹 Easy Range Customization
A super easy "Smoother" setting lets you perfectly adjust how the indicator reacts to recent price changes. This means you can fine-tune it to match exactly how you like to trade
🔹 Instant, Clear Signals
The simple Green and Red candles give you immediate, unmistakable visual cues about strong upward or downward moves, providing insights you can grasp in a heartbeat.
🔹 Smart Continuity in Quiet Times
The clever way it keeps the same color for candles that aren't breaking out offers valuable, subtle insights into those periods when the market is just moving sideways or finding its balance, helping you see the hidden dynamics.
🔹 Seamless Chart Integration
This indicator works like a transparent overlay, appearing directly on your price chart without getting in the way or changing your original candles. It fits perfectly, making your analysis smooth and uninterrupted.
🔹 Clean and Focused Visuals
The indicator’s simple design focuses only on coloring the main candle body and border to clearly highlight important breakouts. This keeps your chart clean and effective, showing you only what truly matters.
🔹 Cross-Market Versatility
This indicator is engineered to perform with precision across all major markets—whether you're trading forex, commodities, stocks, or indices. Its adaptive logic automatically aligns with the unique volatility and structure of each asset class, delivering consistently reliable insights no matter where you trade.
__________________________________________________________________________
⚙️ USAGE
Using and making the "Hive Visualizer" a part of your trading routine is incredibly simple and designed to significantly boost how you understand the market:
Getting Started: Once you have access, just add the "Hive Visualizer" indicator to any chart and timeframe you want on TradingView. It's that easy.
Tuning the "Smoother" Setting: Go into the indicator's settings and play with the "Smoother" number. This is a crucial step to make it react just right for you.
Smaller numbers (like 1-3 bars) will make the indicator very quick to react to the most recent, short-term ups and downs, perfect for fast trading.
Larger numbers (like 5-10+ bars) will give you a wider view, smoothing out small changes and highlighting bigger, more important breakouts, ideal for longer-term analysis. Spend a little time trying different settings to find what works best for your chosen asset and your trading style – it's like finding the perfect lens for your market view.
Understanding the Colors: Once you've set it up, here's how to quickly understand what the "Hive Visualizer" is telling you: New Green Candle: This means a strong sign that buyers are in control and prices are likely to keep moving up, giving you confidence in bullish moves.
New Red Candle: This indicates as a strong signal that sellers are dominating and prices are likely to keep moving down, preparing you for bearish shifts.
__________________________________________________________________________
⚠️ LIMITATIONS
👉 Visual Guide, Not a Bot: Use as part of a broader strategy—it won’t auto‑trade for you
👉 Retroactive Insight: It reflects past price action; it doesn’t predict the future.
👉 Setting‑Dependent: Effectiveness relies on your “Smoother” choice—too low = noise; too high = lag.
👉 Price‑Range Focused: Highlights trends and range only — doesn’t analyze volume, news, or other complex factors.
👉 This tool enhances trend validation but isn’t a standalone signal generator.
█ ▒▒▒▒▒▒▒▒▒▒▒▒▒▒▒▒▒▒▒▒▒▒▒ 『•••• ✎ ••••』 ▒▒▒▒▒▒▒▒▒▒▒▒▒▒▒▒▒▒▒▒▒▒▒▒ █
🎯 CONCLUSION
The "Hive Visualizer" offers an incredibly easy-to-use and adaptable way to see price strength and weakness with crystal clarity on your charts. By giving you instant, clear feedback on whether prices are powerfully breaking out or falling below a recent historical range, it truly empowers you to quickly understand market momentum and spot key turning points. Seamlessly add this smart visual tool into your current trading methods to gain a sharper, more insightful view, and elevate your trading decisions. It's about seeing the market with new eyes.
▣▣▣▣▣▣▣▣▣▣▣▣▣▣▣▣▣▣▣▣▣▣▣▣▣▣▣▣▣▣▣▣▣▣▣▣▣▣▣▣▣▣▣▣▣▣▣▣▣▣▣
🚨 RISK DISCLAIMER
Engagement in financial market speculation inherently carries a substantial degree of inherent risk, and the potential for capital diminution, potentially exceeding initial deposits, is a pervasive and non-trivial consideration. All content, algorithmic tools, scripts, articles, and educational materials disseminated by "Hive Visualizer" are exclusively purposed for informational and pedagogical objectives, strictly for reference. Historical performance data, whether explicitly demonstrated or implicitly suggested, offers no infallible assurance or guarantee of future outcomes. Users bear sole and ultimate accountability for their individual trading decisions and are emphatically urged to meticulously assess their financial disposition, risk tolerance parameters, and conduct independent due diligence prior to engaging in any speculative market activity.

LilSpecCodes1. Killzone Background Highlighting:
It highlights 4 key market sessions:
Killzone Time (EST) Color
Silver Bullet 9:30 AM – 12:00 PM Light Blue
London Killzone 2:00 AM – 5:00 AM Light Green
NY PM Killzone 1:30 PM – 4:00 PM Light Purple
Asia Open 7:00 PM – 11:00 PM Light Red
These are meant to help you focus during high-probability trading times.
__________________________________________________
2. Previous Day High/Low (PDH/PDL):
Plots green line = PDH
Plots red line = PDL
Tracks the current day’s session high/low and sets it as PDH/PDL on a new trading day
CHANGES WITH ETH/RTH
3. Inside Bar Marker:
Plots a small black triangle under bars where the high is lower than the previous bar’s high and the low is higher than the previous bar’s low (inside bars)
Useful for spotting potential breakout or continuation setups
4. Vertical Time Markers (White Dashed Lines)
Time (EST) Label
4:00 AM End of London Silver Bullet
9:30 AM NYSE Open
10:00 AM Start of NY Silver Bullet
11:00 AM End of NY Silver Bullet
11:30 AM (Customizable Input)
3:00 PM PM Killzone Ends
3:15 PM Futures Market Close
7:15 PM Asia Session Watch

Rapid ICT Suite - MTF Concepts & iFVGTitle: Rapid ICT Suite - MTF Concepts & iFVG
Overview
Unlock a new level of market analysis with the Rapid ICT Suite, a comprehensive, all-in-one indicator designed for the discerning price action trader. This powerful tool merges two distinct analytical engines into one seamless experience, allowing you to overlay critical Higher Timeframe (HTF) market structure onto your current chart while simultaneously tracking real-time Fair Value Gaps (FVGs) and their inversions (iFVGs).
Whether you are a scalper needing to respect 1H structure, a day trader aligning with the 4H bias, or a swing trader mapping the daily trend, this indicator provides the clarity and context you need to make higher-probability trading decisions. It was built from the ground up to solve common issues traders face, delivering stable, precise, and flexible analysis.
The Strategy: Targeting IRL with iFVG Entries
The Destination (The "Why"): Internal Range Liquidity (IRL)
On a Higher Timeframe (HTF), we will identify major Internal Range Liquidity (IRL) zones. In the context of ICT, IRL simply refers to unmitigated Fair Value Gaps (FVGs) that exist within a broader trading range.
These HTF FVGs act as powerful magnets for price. The market will often seek out these zones to rebalance before continuing its next major move. By plotting these on our chart, we establish a clear directional bias and a high-probability target. Our indicator will now label these HTF FVG boxes as "IRL".
The Entry Signal (The "How"): Inverted Fair Value Gaps (iFVG)
Once we have our HTF IRL target, we drop down to our Lower Timeframe (LTF) for execution.
We wait for price to create an Inverted Fair Value Gap (iFVG). An iFVG is a regular FVG that has failed and been traded through, signifying a shift in momentum.
An iFVG appearing on the LTF provides a high-precision entry signal to take a trade in the direction of the HTF IRL zone. It's our confirmation that the market is likely now making its move towards that destination.
Key Features
Multi-Timeframe Order Blocks (Boxes): Automatically identify and plot key HTF demand and supply zones (Order Blocks) onto your chart.
Multi-Timeframe Fair Value Gaps (Boxes): See where HTF imbalances exist, giving you a clear map of institutional reference points and potential targets.
Multi-Timeframe Liquidity Pools (Boxes): Pinpoint where buy-side and sell-side liquidity is likely resting, based on clusters of old highs and lows.
Current Timeframe FVG & iFVG (Lines/Labels): A second, independent engine tracks FVGs on your chosen timeframe, monitors them for mitigation, and automatically identifies when an FVG has been inverted (iFVG), a crucial shift in market dynamics.
The "Rapid" Advantage: Solving Trader Frustrations
This indicator was engineered to overcome three of the most common problems with technical indicators:
1. ✅ No More Flickering or "Ghost" Signals
The Problem: Many indicators show signals on the live, forming candle. This causes zones or signals to appear and disappear ("flicker"), leading to confusion and false entries.
The Solution: The Rapid ICT Suite uses 100% confirmed, closed-candle data for all its calculations (OB, FVG, and Liquidity). A zone will only appear on your chart after the price action that confirms it is complete. This means every signal is stable, reliable, and non-repainting.
2. ✅ Frame-Perfect, Precise Placement
The Problem: Indicators that use lookback logic often draw their signals one candle too late, causing a visual disconnect between the price pattern and the signal itself.
The Solution: We have corrected this common flaw. Every box and line is drawn starting from the exact confirmation candle of the pattern. This frame-perfect precision is critical for accurate analysis and planning your entries.
3. ✅ The Dual Analysis Engine: Uncluttered & Flexible
The Problem: Trying to analyze multiple timeframes at once can lead to cluttered charts and mental overload .
The Solution: This suite contains two independent parts that you can control separately.
Part 1 gives you the macro context—the HTF structure where big moves originate.
Part 2 gives you the micro details—the real-time FVG and iFVG story on your trading timeframe.
Use them together for a complete picture, or toggle one off to focus on a specific aspect of your strategy. This flexibility keeps your workspace clean and your analysis sharp.
How to Use & Settings Explained
The indicator settings are neatly organized into two main parts.
Part 1: MTF Concepts (OB, FVG, Liq)
This section controls the Higher Timeframe boxes that are overlaid onto your current chart.
Higher-TF for OB/FVG/Liq: This is the most important setting. Select the higher timeframe you want to analyze. For example, if you are trading on the 15-minute chart, you might set this to 240 (4-Hour) to see the key 4H zones.
Show Order-Blocks / FVGs / Liquidity: Simple toggles to turn each type of HTF zone on or off.
Max... Count: Controls how many of the most recent zones are displayed on the chart, preventing clutter from old, irrelevant zones.
Part 2: FVG & iFVG (Lines/Labels)
This section controls the second engine, which analyzes FVGs and iFVGs on its own selected timeframe.
Timeframe for FVG/iFVG: Choose the timeframe for this analysis. You can leave it blank to use your current chart's timeframe, or set it to a specific one.
Mitigation Type & Mitigation %: A powerful feature to define when an FVG is considered "used up."
Type: Choose if mitigation is counted from the candle's Wick or Close.
Percent: Set how far price must retrace into an FVG (e.g., 50%) before it is considered mitigated and the lines are removed from your chart.
FVG/iFVG Count: Controls how many of the most recent FVG/iFVG zones are displayed.
Style & Color Settings: Fully customize the appearance of the lines and labels to match your chart theme.
Final Words
This indicator was built to provide actionable clarity. By understanding the interplay between higher-timeframe structure and current price action, you can significantly enhance your trading edge. Thank you for choosing the Rapid ICT Suite.
Happy trading!

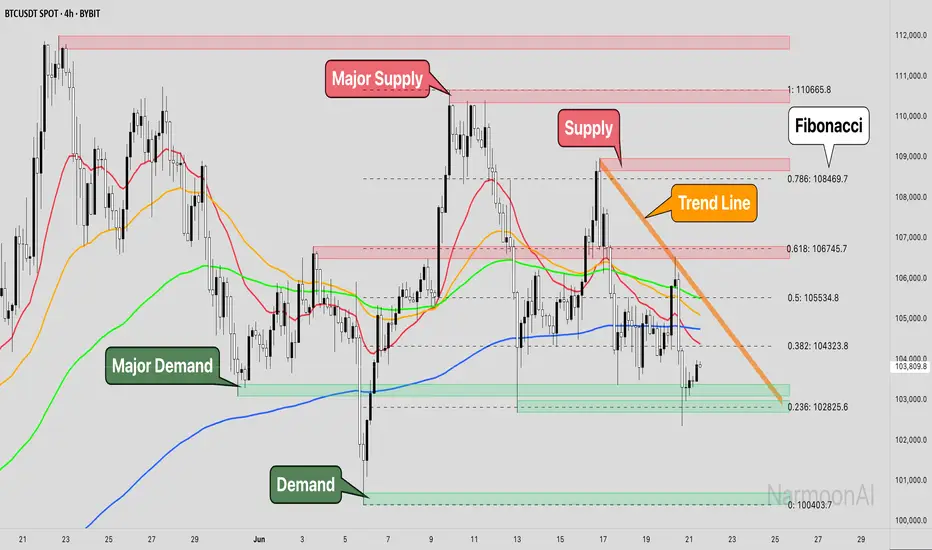
Smart Money Concepts + Fibonacci + EMA - AI Enhanced Analysis### █ OVERVIEW
This indicator is not just another "all-in-one" tool; it's a **specialized data visualization layer designed for the new era of AI-driven chart analysis**. The primary purpose of the **"NarmoonAI"** indicator is to structure and display key market information in a clean, consistent, and machine-readable format.
Standard charts can be noisy and ambiguous for AI Vision models (like Google's Gemini or OpenAI's GPT-4). This script solves that problem by consolidating the most crucial technical analysis concepts—Smart Money Concepts, Trend Analysis, and Key Levels—into a clear visual language that an AI can easily interpret from a single screenshot.
This approach allows traders to leverage the power of artificial intelligence for faster, more objective, and deeper market analysis. It's designed to work seamlessly with our custom AI assistant, the **NarmoonAI Telegram Bot**, but can be used with any modern AI vision tool.
---
### █ CORE COMPONENTS & LOGIC
This indicator is a "mashup" with a clear purpose: to create a comprehensive yet clean analytical framework. Here is how each component contributes to the overall goal of AI-enhanced analysis:
**1. Smart Money Concepts (Supply & Demand Zones):**
* **How it works:** The script automatically identifies significant market turning points by detecting swing highs and lows using `ta.pivothigh` and `ta.pivotlow` over a user-defined `Swing Length`. These pivots form the basis of our Supply (resistance) and Demand (support) zones.
* **The "Smart" Edge:** To filter out weaker zones, the indicator analyzes the volume profile. Zones that are formed during periods of high volume (defined as >1.5x the 20-period simple moving average of volume) are highlighted in a stronger, more vibrant color. This signals areas of high institutional interest, a key concept in Smart Money analysis.
**2. Multi-Layered Trend Analysis (Exponential Moving Averages - EMAs):**
* **How it works:** We've included a customizable suite of four essential EMAs (20, 50, 100, and 200). These are not just random lines; they provide an instant visual reference for short, medium, and long-term trend direction and dynamic support/resistance.
* **Why it's useful for AI:** An AI can instantly parse the order and slope of these EMAs. For example, it can identify a strong uptrend when the price is above the 20 EMA, which is above the 50 EMA, and so on.
**3. Automatic Fibonacci Retracement:**
* **How it works:** Manually drawing Fibonacci levels is subjective and time-consuming. This script automates the process by identifying the highest high and lowest low over a `Fibonacci Lookback Period` (defaulting to 100 bars) and automatically plots the key retracement levels (0.236, 0.382, 0.5, 0.618, 0.786).
* **Why it's useful for AI:** It provides objective, universally recognized potential support and resistance levels without any manual drawing, ensuring a clean and consistent chart for analysis.
**4. Dynamic Trend Channels:**
* **How it works:** The indicator automatically draws trend channels by connecting the two most recent significant pivot highs (for a downtrend channel) or pivot lows (for an uptrend channel).
* **The "Dynamic" Edge:** The width of the channel is not fixed. It's dynamically calculated using the Average True Range (ATR), allowing the channel to expand and contract based on the market's current volatility. This provides a much more adaptive and realistic view of the trend's boundaries.
---
### █ HOW TO USE THIS INDICATOR
There are two primary ways to use the NarmoonAI indicator:
**A) For AI-Powered Analysis (Recommended):**
1. Apply the **NarmoonAI** indicator to any chart.
2. Take a clean screenshot of your chart.
3. Upload the image to your preferred AI Vision model (e.g., Gemini, ChatGPT) or, for the best results, use our specialized **NarmoonAI Telegram bot**.
4. Ask the AI for a detailed analysis. **Example Prompts:**
* *"Based on this chart, what is the current market structure? Identify key support and resistance levels."*
* *"Is there a potential long setup forming according to the information from the NarmoonAI indicator?"*
* *"Summarize the trend direction and strength using the EMAs and trend channels shown."*
**B) For Manual Trading:**
Traders can use the confluence of signals for high-probability setups:
* **High-Probability Long:** Look for the price to enter a **Strong Demand Zone** that aligns with a key **Fibonacci level** (e.g., 0.618) and is respected by a major **EMA** (e.g., the 50 or 100 EMA).
* **High-Probability Short:** Look for the price to test a **Strong Supply Zone** near the top of a **descending trend channel**, with EMAs confirming the bearish momentum.
---
*This script was created by NarmoonAI to bridge the gap between traditional technical analysis and the powerful capabilities of modern artificial intelligence. We believe this is the future of trading analysis.*
Multi-Session MarkerMulti-Session Marker is a flexible visual tool for traders who want to highlight up to 10 custom trading sessions directly on their chart’s background.
Custom Sessions: Enter up to 10 time ranges (in HHMM-HHMM format) to mark any market session, news window, or personal focus period.
Visual Clarity: For each session, toggle the highlight on or off and select a unique background color and opacity, making it easy to distinguish active trading windows at a glance.
Universal Time Handling: Session times automatically follow your chart’s time zone—no manual adjustment required.
Efficient and Fast: Utilizes TradingView’s bgcolor() for smooth performance, even on fast timeframes like 1-second charts.
Clean Interface: All session controls are grouped for easy editing in the indicator’s settings panel.
How to use:
In the indicator settings, enter your desired session times (e.g., 0930-1130) for each session you want to highlight.
Toggle “Show Session” and pick a color for each session.
The background will automatically highlight those periods on your chart.
This indicator is ideal for day traders, futures traders, or anyone who wants to visually segment their trading day for better focus and analysis.

Intermarket Correlation Oscillator (ICO)The Intermarket Correlation Oscillator (ICO) is a TradingView indicator that helps traders analyze the relationship between two assets, such as stocks, indices, or cryptocurrencies, by measuring their price correlation. It displays this correlation as an oscillator ranging from -1 to +1, making it easy to spot whether the assets move together, oppositely, or independently. A value near +1 indicates strong positive correlation (assets move in the same direction), near -1 shows strong negative correlation (opposite movements), and near 0 suggests no correlation. This tool is ideal for confirming trends, spotting divergences, or identifying hedging opportunities across markets.
How It Works?
The ICO calculates the Pearson correlation coefficient between the chart’s primary asset (e.g., Apple stock) and a secondary asset you choose (e.g., SPY for the S&P 500) over a specified number of bars (default: 20). The oscillator is plotted in a separate pane below the chart, with key levels at +0.8 (overbought, strong positive correlation) and -0.8 (oversold, strong negative correlation). A midline at 0 helps gauge neutral correlation. When the oscillator crosses these levels or the midline, labels ("OB" for overbought, "OS" for oversold) and alerts notify you of significant shifts. Shaded zones highlight extreme correlations (red for overbought, green for oversold) if enabled.
Why Use the ICO?
Trend Confirmation: High positive correlation (e.g., SPY and QQQ both rising) confirms market trends.
Divergence Detection: Negative correlation (e.g., DXY rising while stocks fall) signals potential reversals.
Hedging: Identify negatively correlated assets to balance your portfolio.
Market Insights: Understand how assets like stocks, bonds, or crypto interact.
Easy Steps to Use the ICO in TradingView
Add the Indicator:
Open TradingView and load your chart (e.g., AAPL on a daily timeframe).
Go to the Pine Editor at the bottom of the TradingView window.
Copy and paste the ICO script provided earlier.
Click "Add to Chart" to display the oscillator below your price chart.
Configure Settings:
Click the gear icon next to the indicator’s name in the chart pane to open settings.
Secondary Symbol: Choose an asset to compare with your chart’s symbol (e.g., "SPY" for S&P 500, "DXY" for USD Index, or "BTCUSD" for Bitcoin). Default is SPY.
Correlation Lookback Period: Set the number of bars for calculation (default: 20). Use 10-14 for short-term trading or 50 for longer-term analysis.
Overbought/Oversold Levels: Adjust thresholds (default: +0.8 for overbought, -0.8 for oversold) to suit your strategy. Lower values (e.g., ±0.7) give more signals.
Show Midline/Zones: Check boxes to display the zero line and shaded overbought/oversold zones for visual clarity.
Interpret the Oscillator:
Above +0.8: Strong positive correlation (red zone). Assets move together.
Below -0.8: Strong negative correlation (green zone). Assets move oppositely.
Near 0: No clear relationship (midline reference).
Labels: "OB" or "OS" appears when crossing overbought/oversold levels, signaling potential correlation shifts.
Set Up Alerts:
Right-click the indicator, select "Add Alert."
Choose conditions like "Overbought Alert" (crossing above +0.8), "Oversold Alert" (crossing below -0.8), or zero-line crossings for bullish/bearish correlation shifts.
Configure notifications (e.g., email, SMS) to stay informed.
Apply to Trading:
Use positive correlation to confirm trades (e.g., buy AAPL if SPY is rising and correlation is high).
Spot divergences for reversals (e.g., stocks dropping while DXY rises with negative correlation).
Combine with other indicators like RSI or moving averages for stronger signals.
Tips for New Users
Start with related assets (e.g., SPY and QQQ for tech stocks) to see clear correlations.
Test on a demo account to understand signals before trading live.
Be aware that correlation is a lagging indicator; confirm signals with price action.
If the secondary symbol doesn’t load, ensure it’s valid on TradingView (e.g., use correct ticker format).
The ICO is a powerful, beginner-friendly tool to explore intermarket relationships, enhancing your trading decisions with clear visual cues and alerts.

Timeshifter Triple Timeframe Strategy w/ SessionsOverview
The "Enhanced Timeshifter Triple Timeframe Strategy with Session Filtering" is a sophisticated trading strategy designed for the TradingView platform. It integrates multiple technical indicators across three different timeframes and allows traders to customize their trading Sessions. This strategy is ideal for traders who wish to leverage multi-timeframe analysis and session-based trading to enhance their trading decisions.
Features
Multi-Timeframe Analysis and direction:
Higher Timeframe: Set to a daily timeframe by default, providing a broader view of market trends.
Trading Timeframe: Automatically set to the current chart timeframe, ensuring alignment with the trader's primary analysis period.
Lower Timeframe: Set to a 15-minute timeframe by default, offering a granular view for precise entry and exit points.
Indicator Selection:
RMI (Relative Momentum Index): Combines RSI and MFI to gauge market momentum.
TWAP (Time Weighted Average Price): Provides an average price over a specified period, useful for identifying trends.
TEMA (Triple Exponential Moving Average): Reduces lag and smooths price data for trend identification.
DEMA (Double Exponential Moving Average): Similar to TEMA, it reduces lag and provides a smoother trend line.
MA (Moving Average): A simple moving average for basic trend analysis.
MFI (Money Flow Index): Measures the flow of money into and out of a security, useful for identifying overbought or oversold conditions.
VWMA (Volume Weighted Moving Average): Incorporates volume data into the moving average calculation.
PSAR (Parabolic SAR): Identifies potential reversals in price movement.
Session Filtering:
London Session: Trade during the London market hours (0800-1700 GMT+1).
New York Session: Trade during the New York market hours (0800-1700 GMT-5).
Tokyo Session: Trade during the Tokyo market hours (0900-1800 GMT+9).
Users can select one or multiple sessions to align trading with specific market hours.
Trade Direction:
Long: Only long trades are permitted.
Short: Only short trades are permitted.
Both: Both long and short trades are permitted, providing flexibility based on market conditions.
ADX Confirmation:
ADX (Average Directional Index): An optional filter to confirm the strength of a trend before entering a trade.
How to Use the Script
Setup:
Add the script to your TradingView chart.
Customize the input parameters according to your trading preferences and strategy requirements.
Indicator Selection:
Choose the primary indicator you wish to use for generating trading signals from the dropdown menu.
Enable or disable the ADX confirmation based on your preference for trend strength analysis.
Session Filtering:
Select the trading sessions you wish to trade in. You can choose one or multiple Sessions based on your trading strategy and market focus.
Trade Direction:
Set your preferred trade direction (Long, Short, or Both) to align with your market outlook and risk tolerance. You can use this feature to gauge the market and understand the possible directions.
Tips for Profitable and Safe Trading:
Recommended Timeframes Combination:
LT: 1m , CT: 5m, HT: 1H
LT: 1-5m , CT: 15m, HT: 4H
LT: 5-15m , CT: 4H, HT: 1W
Backtesting:
Always backtest the strategy on historical data to understand its performance under various market conditions.
Adjust the parameters based on backtesting results to optimize the strategy for your specific trading style.
Risk Management:
Use appropriate risk management techniques, such as setting stop-loss and take-profit levels, to protect your capital.
Avoid over-leveraging and ensure that you are trading within your risk tolerance.
Market Analysis:
Combine the script with other forms of market analysis, such as fundamental analysis or market sentiment, to make well-rounded trading decisions.
Stay informed about major economic events and news that could impact market volatility and trading sessions.
Continuous Monitoring:
Regularly monitor the strategy's performance and make adjustments as necessary.
Keep an eye on the results and settings for real-time statistics and ensure that the strategy aligns with current market conditions.
Education and Practice:
Continuously educate yourself on trading strategies and market dynamics.
Practice using the strategy in a demo account before applying it to live trading to gain confidence and understanding.

SHYY-TFC-Horizontal V2SHYY-TFC-Horizontal V2 – Multi-Timeframe Clarity for The Strat Traders
SHYY-TFC-Horizontal V2 is a powerful, clean, and efficient overlay designed for serious traders who use Rob Smith’s The Strat.
This real-time table gives you instant visual insight across all key timeframes – from 5 minutes to monthly – with:
Candle direction (bullish, bearish, neutral)
Strat bar type (1, 2U, 2D, 3)
Live countdown to bar close
Compact horizontal layout that saves space and enhances clarity
Fully customizable table position to fit any chart setup
Built with no lookahead bias, this version meets TradingView’s script publishing standards and is optimized for actionable, real-time decisions.
Ideal for:
Scalpers who need fast confirmation
Swing traders aligning entries with time frame continuity
Price action traders following The Strat methodology
Trade with confidence. See the full picture. React faster.
SHYY-TFC-Horizontal V2 – built to make you faster, sharper, and more in control.

Modified Fractal Open/CloseModified Fractal (Open/Close Based) - Indicator
The Modified Fractal (Open/Close Based) indicator offers a new way to detect fractal patterns on your chart by analyzing the open and close prices instead of the traditional high and low values.
🧮 How it works:
The indicator evaluates a group of 5 consecutive candles.
The central candle (2 bars ago) is analyzed.
For a Bullish Fractal:
The open or close of the central candle must be lower than the open and close of the other 4 surrounding candles.
For a Bearish Fractal:
The open or close of the central candle must be higher than the open and close of the other 4 surrounding candles.
Once a valid pattern is detected, a visual symbol (triangle) is plotted directly on the chart and an alert can be triggered.
✅ Key Features:
Non-repainting signals (evaluated after candle close)
Fully mechanical detection logic
Easy-to-use visual signals
Alert conditions ready to be integrated into TradingView’s alert system
Suitable for multiple timeframes (can be used from M1 to Daily and beyond)
🎯 Use case:
This modified fractal approach can help traders:
Spot potential swing points
Identify possible reversals
Confirm price exhaustion zones
Support breakout or mean reversion strategies
⚠ Note:
This indicator does not provide trade signals by itself. It is recommended to be combined with additional tools, price action analysis, or risk management rules.
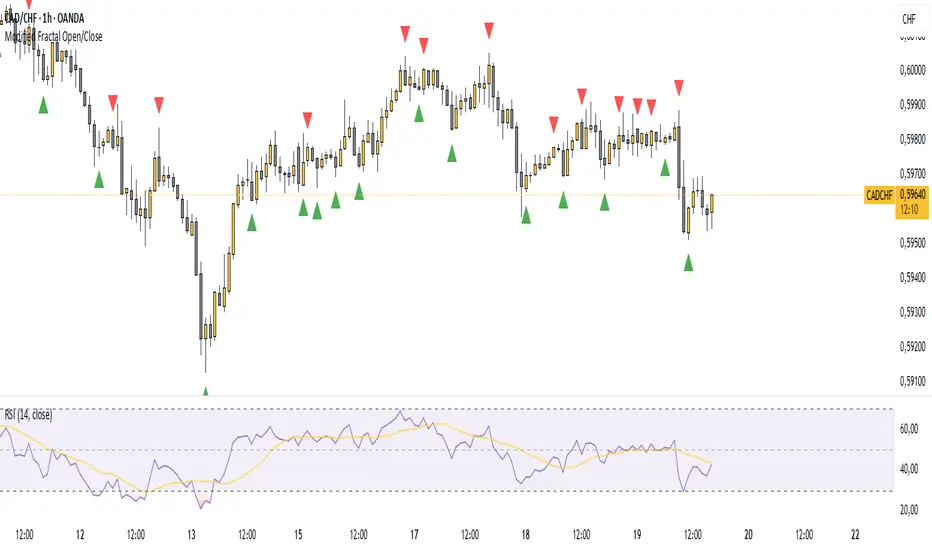
CandelaCharts - 1st Presented FVG 📝 Overview
The ICT 1st Presented Fair Value Gap refers to the first FVG that forms after the market opens at 9:30 AM New York local time. In a sideways market, it often acts as a catalyst for price movement in either direction, while in trending conditions, it tends to support and reinforce the prevailing trend.
This indicator automatically identifies the first Fair Value Gap (FVG) that forms after the New York session opens at 9:30 AM local time. Based on concepts taught by Inner Circle Trader (ICT), the 1st Presented FVG is a key institutional price imbalance that often sets the tone for the trading day.
📦 Features
Customize FVG session time (e.g. 09:30 – 10:00)
Show/hide session dividers
FVG visibility filter (e.g. Bullish / Bearish)
Advanced styling
Hide overlapping FVGs
Extend FVGs
Opening prices
⚙️ Settings
Show: Controls whether all, bullish only, or bearish only FVGs are displayed on the chart.
Session: Sets a specific time window (e.g. 09:30–10:00) to filter which FVGs are displayed.
Dividers: Toggles vertical session divider on the chart for visual separation.
Midline: Displays a midpoint (CE) line through the FVG; customizable color and thickness.
Border: Adds a border around each FVG zone.
Labels: Toggles label display for FVGs.
Hide Overlap: Hides overlapping FVGs to reduce visual clutter.
Extend: Extends each FVG forward in time.
Alerts: Enables alerts when price interacts with an FVG zone.
Opening Prices: Allows defining custom time-based levels (e.g. 00:00–00:01 and 18:00–18:01) with color and style options.
⚡️ Showcase
Simple
Labels
Bordered
Consequent Encroachment
Extended
Dividers
📒 Usage
How to Use the ICT 1st Presented Fair Value Gap in Trading
To apply the ICT 1st Presented Fair Value Gap (FVG), identify the first fair value gap of the day and extend it across the chart until 3:45 PM New York time.
You’ll often notice that some of the best trade setups form around this level. It tends to act as a key reference point for price action during the day—especially on trending days, where price frequently returns to this gap before continuing in its direction.
This level can also serve as an inverse fair value gap, offering opportunities in the opposite direction under the right conditions.
How to Disqualify the 1st Presented Fair Value Gap?
When the first fair value gap forms after 9:30 AM New York time, check the candles that came just before it.
If the candlestick that creates the FVG doesn’t break above or below the range of those previous candles, then it’s not a true inefficiency. In that case, it’s considered a disqualified 1st Presented Fair Value Gap—meaning it shouldn’t be used as a key reference level.
Refer to the example below to see what this looks like on the chart.
🚨 Alerts
This script provides alert options for all signals.
Bearish Signal
A bearish signal is triggered when the bearish 1st P.FVG is formed in interval 09:30 - 10:00.
Bullish Signal
A bullish signal is triggered when the bullish 1st P.FVG is formed in interval 09:30 - 10:00.
⚠️ Disclaimer
Trading involves significant risk, and many participants may incur losses. The content on this site is not intended as financial advice and should not be interpreted as such. Decisions to buy, sell, hold, or trade securities, commodities, or other financial instruments carry inherent risks and are best made with guidance from qualified financial professionals. Past performance is not indicative of future results.

VWAP/VOL [Extension] | FractalystWhat's the indicator's purpose and functionality?
The VWAP/VOL Extension is designed specifically as a bias identification system for the Quantify Trading Model.
This extension uses volume-weighted average price analysis combined with institutional volume classification to automatically detect market bias without requiring optimization periods that lead to overfitting.
The system provides real-time bias signals (bullish/bearish/neutral) that integrate directly with Quantify's machine learning algorithms, enabling institutional-level backtesting and automated entry/exit identification based on genuine market structure rather than curve-fitted parameters.
How does this extension work with the Quantify Trading Model?
The VWAP/VOL Extension serves as the bias detection engine for Quantify's automated trading system.
Instead of manually selecting bias direction, this extension automatically identifies market bias using:
- Volume-weighted VWAP analysis with three-state detection (bullish/bearish/neutral)
- Institutional volume classification using relative volume thresholds without optimization
- Non-repainting architecture ensuring consistent bias signals for Quantify's machine learning
The extension outputs bias signals that Quantify uses as input through the `input.source()` function, allowing the Trading Model to focus on optimal entry/exit timing while the extension handles bias identification.
Why doesn't this use optimization periods like other indicators?
The VWAP/VOL Extension deliberately avoids optimization periods to prevent overfitting bias that destroys out-of-sample performance. The system uses:
- Fixed mathematical thresholds based on market structure principles rather than optimized parameters
- Relative volume analysis using standard 2.0x/0.5x ratios that work across all market conditions
- VWAP distance calculations based on percentage thresholds without curve-fitting
- Gap enforcement using fixed 5-bar minimums for disciplined bias detection
This approach ensures the bias signals remain robust across different market regimes without the performance degradation typical of over-optimized systems.
Can this extension be used independently for discretionary trading?
No, the VWAP/VOL Extension is specifically engineered to work as a component within the Quantify ecosystem. The extension is designed to:
- Provide bias input for Quantify's machine learning algorithms
- Enable automated backtesting through systematic bias identification
- Support institutional-level analysis when combined with Quantify's ML entry model
Using this extension independently would miss the primary value proposition of systematic entry/exit optimization that Quantify provides.
The extension handles bias detection so Quantify can focus on probability-based trade timing and risk management.
How does this enable institutional-level backtesting?
The extension transforms discretionary bias identification into systematic institutional analysis by:
- Eliminating subjective bias selection through automated VWAP/volume analysis
- Providing consistent historical signals with non-repainting architecture for accurate backtesting
- Integrating with Quantify's algorithms to identify optimal entry patterns based on objective bias states
- Enabling performance analysis across multiple market regimes without optimization bias
This combination allows Quantify to run institutional-grade backtests with consistent bias identification, generating reliable performance statistics and risk metrics that reflect genuine market edge rather than curve-fitted results.
How do I integrate this with the Quantify Trading Model?
Integration enables institutional-grade systematic trading through advanced machine learning and statistical validation:
- Add both VWAP/VOL Extension and Quantify Trading Model to your chart
- Select VWAP/VOL Extension as the bias source using input.source()
- Quantify automatically uses the extension's bias signals for entry/exit analysis
- The built-in machine learning algorithms score optimal entry and exit levels based on trend intensity, volume conviction, and market structure patterns identified by the extension
The extension handles all bias detection complexity while Quantify focuses on optimal trade timing, position sizing, and risk management along with PineConnector automation
What markets and assets does the VWAP/VOL Extension work best on?
The VWAP/VOL Extension performs optimally on markets with consistent, high-volume participation since the system relies on institutional volume analysis for bias detection. Futures markets provide the most reliable performance due to their centralized volume data and continuous institutional participation.
Recommended Futures Markets:
- ES (S&P 500 E-mini) - Over 2 million contracts daily volume, excellent liquidity depth
- NQ (NASDAQ-100 E-mini) - Around 600,000 contracts daily, strong tech sector representation
- YM (Dow Jones E-mini) - Consistent institutional flow and volume patterns
- RTY (Russell 2000 E-mini) - Small-cap exposure with reliable volume data
- GC (Gold Futures) - High volume commodity with institutional participation
- CL (Crude Oil Futures) - Energy sector representation with strong volume consistency
Why Futures Markets Excel:
- Futures markets provide centralized volume reporting, ensuring the extension's volume classification system receives accurate institutional participation data. The standardized contract specifications and continuous trading hours create consistent volume patterns that the extension's algorithms can analyze effectively.
Acceptable Timeframes and Portfolio Integration:
- Any timeframe that can be evaluated within Quantify Trading Model's backtesting engine is acceptable for live trading implementation.
The extension is specifically designed to integrate with Quantify's portfolio management system, allowing multiple strategies across different timeframes and assets to operate simultaneously while maintaining consistent bias identification methodology across the entire automated trading portfolio.
Legal Disclaimers and Risk Acknowledgments
Trading Risk Disclosure
The VWAP/VOL Extension is provided for informational, educational, and systematic bias detection purposes only and should not be construed as financial, investment, or trading advice. The extension provides volume-weighted institutional analysis but does not guarantee profitable outcomes, accurate bias predictions, or positive investment returns.
Trading systems utilizing bias detection algorithms carry substantial risks including but not limited to total capital loss, incorrect bias identification, market regime changes, and adverse conditions that may invalidate volume-based analysis. The extension's performance depends on accurate volume data, TradingView infrastructure stability, and proper integration with Quantify Trading Model, any of which may experience data errors, technical failures, or service interruptions that could affect bias detection accuracy.
System Dependency Acknowledgment
The extension requires continuous operation of multiple interconnected systems: TradingView charts and real-time data feeds, accurate volume reporting from exchanges, Quantify Trading Model integration, and stable platform connectivity. Any interruption or malfunction in these systems may result in incorrect bias signals, missed transitions, or unexpected analytical behavior.
Users acknowledge that neither Fractalyst nor the creator has control over third-party data providers, exchange volume reporting accuracy, or TradingView platform stability, and cannot guarantee data accuracy, service availability, or analytical performance. Market microstructure changes, volume reporting delays, exchange outages, and technical factors may significantly affect bias detection accuracy compared to theoretical or backtested performance.
Intellectual Property Protection
The VWAP/VOL Extension, including all proprietary algorithms, volume classification methodologies, three-state bias detection systems, and integration protocols, constitutes the exclusive intellectual property of Fractalyst. Unauthorized reproduction, reverse engineering, modification, or commercial exploitation of these proprietary technologies is strictly prohibited and may result in legal action.
Liability Limitation
By utilizing this extension, users acknowledge and agree that they assume full responsibility and liability for all trading decisions, financial outcomes, and potential losses resulting from reliance on the extension's bias detection signals. Fractalyst shall not be liable for any unfavorable outcomes, financial losses, missed opportunities, or damages resulting from the development, use, malfunction, or performance of this extension.
Past performance of bias detection accuracy, volume classification effectiveness, or integration with Quantify Trading Model does not guarantee future results. Trading outcomes depend on numerous factors including market regime changes, volume pattern evolution, institutional behavior shifts, and proper system configuration, all of which are beyond the control of Fractalyst.
User Responsibility Statement
Users are solely responsible for understanding the risks associated with algorithmic bias detection, properly configuring system parameters, maintaining appropriate risk management protocols, and regularly monitoring extension performance. Users should thoroughly validate the extension's bias signals through comprehensive backtesting before live implementation and should never base trading decisions solely on automated bias detection.
This extension is designed to provide systematic institutional flow analysis but does not replace the need for proper market understanding, risk management discipline, and comprehensive trading methodology. Users should maintain active oversight of bias detection accuracy and be prepared to implement manual overrides when market conditions invalidate volume-based analysis assumptions.
Terms of Service Acceptance
Continued use of the VWAP/VOL Extension constitutes acceptance of these terms, acknowledgment of associated risks, and agreement to respect all intellectual property protections. Users assume full responsibility for compliance with applicable laws and regulations governing automated trading system usage in their jurisdiction.

Bias Bar Coloring + Multi-Timeframe Bias Table + AlertsMulti-Timeframe Bias Bar Coloring with Alerts & Table
This indicator provides a powerful, visual way to assess price action bias across multiple timeframes—Monthly, Weekly, and Daily—while also coloring each bar based on the current chart’s bias.
Features:
Persistent Bar Coloring: Bars are colored green for bullish bias (close above previous high), red for bearish bias (close below previous low), and persist the last color if neither condition is met. This makes trend shifts and momentum easy to spot at a glance.
Bias Change Alerts: Get notified instantly when the bias flips from bullish to bearish or vice versa, helping you stay on top of potential trade setups or risk management decisions.
Multi-Timeframe Bias Table: A table anchored in the top right corner displays the current bias for the Monthly, Weekly, and Daily charts, color-coded for quick reference. This gives you a clear view of higher timeframe context while trading any chart.
Consistent Logic: The same objective bias logic is used for all timeframes, ensuring clarity and reliability in your analysis.
How to Use:
Use the bar colors for instant visual feedback on trend and momentum shifts.
Watch the top-right table to align your trades with higher timeframe bias, improving your edge and filtering out lower-probability setups.
Set alerts to be notified of bias changes, so you never miss a potential opportunity.
This tool is ideal for traders who value multi-timeframe analysis, want clear visual cues for trend direction, and appreciate having actionable alerts and context at their fingertips.
