KitoBoy_trading_Bay/Sell_TargetAn indicator showing where to buy and where to sell + Targets + Moving stop loss + trend support and resistance.
Multitimeframe

ChanTheoryChan Theory Indicator
Functional Features Description
K-line Merging Processing: Merge K-lines according to their direction and support visual display of the merging process.
Fractal Recognition: Real-time recognition of top and bottom fractals.
Stroke Recognition: Alternately connect top and bottom fractals to draw strokes, supporting three modes: strict strokes, standard/old strokes, and simplified/new strokes. Support filtering noise fractals through different fractal constraints, adding constraints to strokes to improve their stability.
Segment Recognition: Identify segments by extension + feature sequence fractals. Implement two scenarios for feature sequences: (1) No gap in the feature sequence before and after the turning point; (2) A gap in the feature sequence before and after the turning point.
Trend Recognition: Treat segments as strokes to identify trends based on the principle that strokes form segments. Note: This complies with the same-level decomposition and associative law, which can prevent unlimited extension of central zones but may cause a delay in central zone recognition when a trend has not yet formed.
Central Zone Recognition: Identify stroke central zones within segments and segment central zones within trends. Note: There is a recognition delay issue.
MACD Area Calculation: For upward segments, calculate the MACD area above the zero line within the scope; for downward segments, calculate the MACD area below the zero line within the scope.
Momentum Calculation: Calculate momentum based on "time, price, and volume" to evaluate segment strength, which can be used as a reference alongside MACD area to facilitate divergence judgment. Note: Sometimes they may not be completely consistent, and actual situations should be considered.
Trading Point Recognition: Not implemented.
Alerts and Strategies: Not implemented.
______________________________________________________________
缠论指标
功能点说明
K线合并处理:按照K线方向对K线进行合并处理,支持可视化方式显示合并过程。
分型识别:实时识别顶分型和底分型。
笔识别:交替连接顶分型和底分型,绘制笔,并支持严笔、标准笔/老笔、简笔/新笔三中模式。支持通过不同的分型约束来过滤噪音分型,增加对笔的约束,提升笔的稳定性。
线段识别:按照延伸+特征序列分型的方式识别线段。实现特征序列的两种情况:(1)转折点前后不存在特征序列缺口;(2)转折点前后存在特征序列缺口。
趋势识别:按照笔成线段的方式,将线段当成笔,识别趋势。说明:这符合同级别分解和结合律,可以避免中枢无限制的延伸,但也会导致未成趋势时,中枢识别延迟的问题。
中枢识别:在线段范围内识别笔中枢,在趋势范围内识别线段中枢。注意:存在识别延迟问题。
MACD面积统计:对于向上线段,统计范围内的0轴上方的MACD面积;对于向下线段,统计范围内0轴下方的MACD面积。
动能计算:基于“时价量”对动能进行计算,评估线段强度,和MACD面积互为参考,方便判断背驰。注意:有时二者并不完全一致,需根据实际情况判断。
买卖点识别:未实现。
告警和策略:未实现。

Multi-Timeframe EMA50 Overlaythis is EMA50 WD41, means EMA50 weekly, daily, 4h, 1h in one time frame.
So you don't need to check EMA50 every time frame.
When EMA50 daily under EMA50 4h, and 1h i can say it's bullish trend, especially when you see weekly EMA50 under all EMA50.
it's work for bearish trend also, when EMA50 daily above EMA50 4h, and 1h i can say the trend is bearish, espesially when you see weekly EMA50 is above every EMA50.
this indicator help you to understand market is in bullish or bearish trend! happy trading!

HTF Rejection Block [TakingProphets]HTF Rejection Block
This advanced smart money indicator by Taking Prophets helps traders pinpoint Higher Timeframe Rejection Blocks, where institutional price manipulation often leads to sharp reversals. Whether you're trading Forex, Indices, Crypto, or Futures, this tool gives you a real-time view of bullish and bearish rejection zones across up to 4 higher timeframes.
🧠 ICT-Aligned + Inspired by Powell
This concept was popularized by Powell, a respected voice in the ICT community known for spotlighting how aggressive wicks signal Smart Money activity. His insights helped bring Rejection Blocks to the forefront as a critical SMC tool—marking where price fails to hold after liquidity runs.
This script enhances Powell's foundational idea with full automation, multi-timeframe analysis, and customizable visuals.
🔍 What It Does
Detects Bullish/Bearish Rejection Blocks where long wicks reject institutional levels.
Tracks blocks on the current timeframe plus up to 4 custom HTFs.
Displays 50% midpoint levels (optional) for further precision.
Automatically removes blocks once price mitigates them.
Includes a stylish info box with asset, date, and timeframe context.
✅ How to Use
Enable your preferred HTFs (e.g., 1H, 4H, 1D).
Wait for price to form a Rejection Block after a liquidity raid.
Monitor for CHoCH, displacement, or retracement into the block.
Use the 50% level or body extreme as your entry zone.
🧠 Pro Tip: Combine this tool with Killzones, SMT divergence, and OTE entries for elite ICT-style setups.

SIWONK V11The SIWONK V11 indicator was designed to help traders identify key market zones based on Support & Resistance (S&R) principles, along with Crossing analysis. The SIWONK V11 indicator is suitable for scalping, particularly in the Gold (XAUUSD) and Bitcoin (BTC) markets on lower timeframes like M1 and M5. It can also be used on all timeframes.

SR 360 AI Algo 2025SR 360 AI Algo 2025 — By Stock Research 360
SR 360 AI Algo 2025 Charting is a SEBI registered Research Analyst Proprietary coding , a powerful multi-timeframe S & D indicator combined with trend confirmation and momentum-based trade signals.
🔍 Key Features:
Automatically Detects and plots high-probability demand and supply zones with optional retests and break alerts.
Analyses Multi-Timeframe up to 3 timeframes simultaneously to align higher-timeframe context.
Triple EMA (TEMA): Built-in trend indicator with dynamic color shift for visual cues.
MACD Filter: Optional MACD-based trend confirmation to filter out noise.
Buy/Sell Signals: Generates confirmed entries with optional labels or plot shapes.
Retest & Break Alerts: Real-time alerts when price revisits or breaks important zones.
Smart Zone Merging: Combines overlapping SD zones for cleaner charting.
⚙️ Highly Customizable:
Adjust the number of zones, momentum candle filters, timeframe resolution, and label visibility.
Enable or disable features like TEMA, trend coloring, percent tracker, and alert notifications.
🔔 Use Cases:
Ideal for intraday and swing traders looking to trade around institutional order blocks.
Works great with breakout/retest strategies and confluence-based setups.
💡 Best suited for experienced traders using Price Action + Trend + Volume Zones to make informed entries and exits.
📢 Don't forget to turn on alerts for retests and zone breaks to never miss a key move.

Sl/TP Daynamic Based on ATRATR Stop Loss Compact with Lines
By @Salarbb
This script calculates dynamic Stop Loss and Take Profit levels based on the Average True Range (ATR). It’s designed for traders who want a clean and flexible way to map volatility-adjusted SL and TP zones directly on the chart.
Features:
Uses a custom entry price or defaults to the current candle close
Calculates Long and Short stop loss and take profit levels using adjustable ATR and R multipliers
Draws visual lines for SL and TP levels with optional toggle controls
Includes a compact table showing SL, risk value (R), and TP for both long and short directions
Table position and visibility settings are fully user-configurable
This tool is handy for traders who size their positions externally and want to align stop zones with actual market volatility instead of arbitrary numbers. It’s simple, focused, and designed for practical use.
Use it as part of your planning process, not as a signal or system.
Drop a message on Twitter for me with your TradingView ID. I will grant you access for free.
x.com/salarbb

Risk Distribution HistogramStatistical risk visualization and analysis tool for any ticker 📊
The Risk Distribution Histogram visualizes the statistical distribution of different risk metrics for any financial instrument. It converts risk data into histograms with quartile-based color coding, so that traders can understand their risk, tail-risks, exposure patterns and make data-driven decisions based on empirical evidence rather than assumptions.
The indicator supports multiple risk calculation methods, each designed for different aspects of market analysis, from general volatility assessment to tail risk analysis.
Risk Measurement Methods
Standard Deviation
Captures raw daily price volatility by measuring the dispersion of price movements. Ideal for understanding overall market conditions and timing volatility-based strategies.
Use case: Options trading and volatility analysis.
Average True Range (ATR)
Measures true range as a percentage of price, accounting for gaps and limit moves. Valuable for position sizing across different price levels.
Use case: Position sizing and stop-loss placement.
The chart above illustrates how ATR statistical distribution can be used by looking at the ATR % of price distribution. For example, 90% of the movements are below 5%.
Downside Deviation
Only considers negative price movements, making it ideal for checking downside risk and capital protection rather than capturing upside volatility.
Use case: Downside protection strategies and stop losses.
Drawdown Analysis
Tracks peak-to-trough declines, providing insight into maximum loss potential during different market conditions.
Use case: Risk management and capital preservation.
The chart above illustrates tale risk for the asset (TQQQ), showing that it is possible to have drawdowns higher than 20%.
Entropy-Based Risk (EVaR)
Uses information theory to quantify market uncertainty. Higher entropy values indicate more unpredictable price action, valuable for detecting regime changes.
Use case: Advanced risk modeling and tail-risk.
VIX Histogram
Incorporates the market's fear index directly into analysis, showing how current volatility expectations compare to historical patterns. The CAPITALCOM:VIX histogram is independent from the ticker on the chart.
Use case: Volatility trading and market timing.
Visual Features
The histogram uses quartile-based color coding that immediately shows where current risk levels stand relative to historical patterns:
Green (Q1): Low Risk (0-25th percentile)
Yellow (Q2): Medium-Low Risk (25-50th percentile)
Orange (Q3): Medium-High Risk (50-75th percentile)
Red (Q4): High Risk (75-100th percentile)
The data table provides detailed statistics, including:
Count Distribution: Historical observations in each bin
PMF: Percentage probability for each risk level
CDF: Cumulative probability up to each level
Current Risk Marker: Shows your current position in the distribution
Trading Applications
When current risk falls into upper quartiles (Q3 or Q4), it signals conditions are riskier than 50-75% of historical observations. This guides position sizing and portfolio adjustments.
Key applications:
Position sizing based on empirical risk distributions
Monitoring risk regime changes over time
Comparing risk patterns across timeframes
Risk distribution analysis improves trade timing by identifying when market conditions favor specific strategies.
Enter positions during low-risk periods (Q1)
Reduce exposure in high-risk periods (Q4)
Use percentile rankings for dynamic stop-loss placement
Time volatility strategies using distribution patterns
Detect regime shifts through distribution changes
Compare current conditions to historical benchmarks
Identify outlier events in tail regions
Validate quantitative models with empirical data
Configuration Options
Data Collection
Lookback Period: Control amount of historical data analyzed
Date Range Filtering: Focus on specific market periods
Sample Size Validation: Automatic reliability warnings
Histogram Customization
Bin Count: 10-50 bins for different detail levels
Auto/Manual Bin Width: Optimize for your data range
Visual Preferences: Custom colors and font sizes
Implementation Guide
Start with Standard Deviation on daily charts for the most intuitive introduction to distribution-based risk analysis.
Method Selection: Begin with Standard Deviation
Setup: Use daily charts with 20-30 bins
Interpretation: Focus on quartile transitions as signals
Monitoring: Track distribution changes for regime detection
The tool provides comprehensive statistics including mean, standard deviation, quartiles, and current position metrics like Z-score and percentile ranking.
Enjoy, and please let me know your feedback! 😊🥂

Tiny Candle + High Volume DetectorTiny Candle + High Volume Detector
This simple indicator highlights candles with:
A very small body (user-defined % of the close)
A significant volume spike (volume > X times average)
📊 Use this to spot:
Compression zones before breakout
Smart money absorption
Hidden accumulation
⚙️ Adjustable Parameters:
Max Body Size (% of close)
Volume Spike Multiplier
Volume SMA Period
🔔 Alerts are included.
Works on all timeframes and instruments. Best used in trending or consolidating environments to detect buildup before expansion.

JXMJXRS - Volume ShiftJXMJXRS - Volume Shift is a volume-based indicator designed to detect significant volume spikes that occur directly after periods of price compression. These moments often precede breakouts, traps, or liquidity events—especially in crypto markets. The indicator is optimized for use on low to mid-range timeframes such as 15-minute to 4-hour charts.
The logic is simple and effective: if current volume exceeds a dynamically calculated percentile of recent volume history, and recent price candles have shown a period of reduced movement (low body size), a signal is plotted below the candle. This helps filter out random volume surges and highlights moments that may reflect meaningful market participation.
How it works:
Volume Spike Detection
The indicator compares the current candle’s volume to a historical window. A volume spike is confirmed when the current volume exceeds the specified percentile (e.g., 80th percentile) of volume from the previous N candles.
Candle Body Compression
It calculates the average body size of recent candles (short-term) and compares it to a longer-term body average. If the short-term bodies are smaller by a configurable ratio, the price is considered compressed—suggesting low activity before the spike.
Signal Logic
When both conditions are met on the same candle, the indicator displays a “!” label below the bar. This does not indicate a buy or sell signal, but rather marks a moment worth observing for potential expansion in volatility.
Settings:
Volume Lookback:
The number of previous candles used to evaluate the volume percentile. A higher value makes the spike condition stricter.
Volume Percentile (0–100):
Sets the threshold for abnormal volume. For example, 80 means “current volume must be higher than 80% of the past X candles.”
Short-Term Body Avg:
Number of candles used to measure recent candle body size, representing the current price activity range.
Long-Term Body Avg:
Baseline window to calculate typical body size for comparison.
Compression Ratio:
The short-term body average must be less than this ratio times the long-term average to be considered compressed. Lower values increase the compression requirement.
This tool is designed to enhance market awareness by detecting moments of sudden volume expansion following quiet market conditions. It should be used in assist with your broader trading system or strategy.

GVR ChartingGVR Charting — By G Vijay Raghavan
GVR Charting a SEBI registered , a powerful multi-timeframe S & D indicator combined with trend confirmation and momentum-based trade signals.
🔍 Key Features:
Automatically Detects and plots high-probability demand and supply zones with optional retests and break alerts.
Analyses Multi-Timeframe up to 3 timeframes simultaneously to align higher-timeframe context.
Triple EMA (TEMA): Built-in trend indicator with dynamic color shift for visual cues.
MACD Filter: Optional MACD-based trend confirmation to filter out noise.
Buy/Sell Signals: Generates confirmed entries with optional labels or plot shapes.
Retest & Break Alerts: Real-time alerts when price revisits or breaks important zones.
Smart Zone Merging: Combines overlapping SD zones for cleaner charting.
⚙️ Highly Customizable:
Adjust the number of zones, momentum candle filters, timeframe resolution, and label visibility.
Enable or disable features like TEMA, trend coloring, percent tracker, and alert notifications.
🔔 Use Cases:
Ideal for intraday and swing traders looking to trade around institutional order blocks.
Works great with breakout/retest strategies and confluence-based setups.
💡 Best suited for experienced traders using Price Action + Trend + Volume Zones to make informed entries and exits.
📢 Don't forget to turn on alerts for retests and zone breaks to never miss a key move.

Fusion Scalper Pro🚀 Unlock precision trading with Fusion Scalper Pro – a high-performance, invite-only TradingView indicator trusted by scalpers and intraday traders worldwide.
Designed for Forex, Crypto, Stocks, and Indices, this powerful tool delivers high winrate buy/sell signals, dynamic trend clouds, and smart risk management — all directly on your chart.
✅ What Makes Fusion Scalper Pro Different?
🔹 Smart Buy/Sell Signal Logic
Get alerted to high-probability entries with real-time visual markers powered by multi-layered confluence logic (trend + momentum + volume).
🔹 All-Pairs Compatibility
Use on any market: EUR/USD, BTC/USD, SPX500, Gold, NASDAQ, and more — works seamlessly on 1M to 4H timeframes.
🔹 Adaptive Trend Cloud System
Stay on the right side of the market with a clean, colored trend cloud designed for both scalping and swing trading.
🔹 Risk Management Built-In
Auto-generated TP1/TP2/TP3 zones and dynamic stop-loss levels plotted directly on the chart.
🔹 Session-Aware Filtering
Optimized for London, New York, and Asian sessions with smart logic that adapts filters based on market activity.
The same level of algorithmic power you get with Fusion Scalper Pro is being sold elsewhere for over $700 — and often with fewer features.
🖥️ How It Works:
✅ This is a private invite-only script on TradingView.
After purchase, send us your TradingView username via email to:
📩 contact fusionscalperpro.com
Access will be granted manually within 24 hours (usually much sooner).
Once approved, you'll find the script under your “Invite-Only Scripts” tab on TradingView.
📂 What You Receive:
✅ Lifetime access to Fusion Scalper Pro
✅ Full usage guide (PDF)
✅ Customer support for setup or questions
✅ All future updates included
📌 Important Notes:
🟠 No physical item will be shipped – this is an Invite-only TradingView script.
📧 Please include your correct TradingView username to avoid delays.
⚠️ Disclaimer:
This product is not affiliated with or endorsed by TradingView. It is for informational and educational purposes only and should not be considered financial advice. Trading involves risk, and past performance is not indicative of future results.

The Price ModelOpening Range Breakout
Focuses on taking advantage of the New York Opening High volatility
Main goal is to catch simple and straight forward trades with Strict rules
Recommend Targeting 1:1 first, and then setting stop to breakeven after 1:1 is hit
Can use 5 Min ORB 1:1 as a second TP after entering on the prior 1min ORB.

Contrarian Market Structure BreakMarket Structure Break application was inspired and adapted from Market Structure Oscillator indicator developed by Lux Algo. So much credit to their work.
This indicator pairs nicely with the Contrarian 100 MA and can be located here:
Indicator Description: Contrarian Market Structure BreakOverview
The "Contrarian Market Structure Break" indicator is a versatile tool tailored for traders seeking to identify potential reversal opportunities by analyzing market structure across multiple timeframes. Built on Institutional Concepts of Structure (ICT), this indicator detects Break of Structure (BOS) and Change of Character (CHoCH) patterns across short-term, intermediate-term, and long-term swings, plotting them with customizable lines and labels. It generates contrarian buy and sell signals when price breaks key swing levels, with a unique "Blue Dot Tracker" to monitor consecutive buy signals for trend confirmation. Optimized for the daily timeframe, this indicator is adaptable to other timeframes with proper testing, making it ideal for traders of forex, stocks, or cryptocurrencies.
How It Works
The indicator combines three key components to provide a comprehensive view of market dynamics: Multi-Timeframe Market Structure Analysis: It identifies swing highs and lows across short-term, intermediate-term, and long-term periods, plotting BOS (continuation) and CHoCH (reversal) events with customizable line styles and labels.
Contrarian Signal Generation: Buy and sell signals are triggered when the price crosses below swing lows (buy) or above swing highs (sell), indicating potential reversals in overextended markets.
Blue Dot Tracker: A unique feature that counts consecutive buy signals ("blue dots") and highlights a "Hold Investment" state with a yellow background when three or more buy signals occur, suggesting a potential trend continuation.
Signals are visualized as small circles below (buy) or above (sell) price bars, and a table in the bottom-right corner displays the blue dot count and recommended action (Hold or Flip Investment), enhancing decision-making clarity.
Mathematical Concepts Swing Detection: The indicator identifies swing highs and lows by comparing price patterns over three bars, ensuring robust detection of pivot points. A swing high occurs when the middle bar’s high is higher than the surrounding bars, and a swing low occurs when the middle bar’s low is lower.
Market Structure Logic: BOS is detected when the price breaks a prior swing high (bullish) or low (bearish) in the direction of the current trend, while CHoCH signals a potential reversal when the price breaks a swing level against the trend. These are calculated across three timeframes for a multi-dimensional perspective.
Blue Dot Tracker: This feature counts consecutive buy signals and tracks the entry price. If three or more buy signals occur without a sell signal, the indicator enters a "Hold Investment" state, marked by a yellow background, until the price exceeds the entry price or a sell signal occurs.
Entry and Exit Rules Buy Signal (Blue Dot Below Bar): Triggered when the closing price crosses below a swing low on either the intermediate-term or long-term timeframe, suggesting an oversold condition and potential reversal upward. Short-term signals can be enabled but are disabled by default to reduce noise.
Sell Signal (White Dot Above Bar): Triggered when the closing price crosses above a swing high on either the intermediate-term or long-term timeframe, indicating an overbought condition and potential reversal downward.
Blue Dot Tracker Logic: After a buy signal, the indicator increments a blue dot counter and records the entry price. If three or more consecutive buy signals occur (blueDotCount ≥ 3), the indicator enters a "Hold Investment" state, highlighted with a yellow background, suggesting a potential trend continuation. The "Hold Investment" state ends when the price exceeds the entry price or a sell signal occurs, resetting the counter.
Exit Rules: Traders can exit buy positions when a sell signal appears, the price exceeds the entry price during a "Hold Investment" state, or based on additional confirmation from BOS/CHoCH patterns or other technical analysis tools. Always use proper risk management.
Recommended Usage
The indicator is optimized for the daily timeframe, where it effectively captures significant reversal and continuation patterns in trending or ranging markets. It can be adapted to other timeframes (e.g., 1H, 4H, 15M) with careful testing of settings, particularly enabling/disabling short-term structure analysis to suit market conditions. Backtesting is recommended to optimize performance for your chosen asset and timeframe.
Customization Options Market Structure Display: Toggle short-term, intermediate-term, and long-term structures on or off, with customizable line styles (solid, dashed, dotted) and colors for bullish and bearish breaks.
Labels: Enable or disable BOS/CHoCH labels for each timeframe to reduce chart clutter.
Signal Visibility: Hide buy/sell signals if desired for a cleaner chart.
Blue Dot Tracker: Monitor the blue dot count and action (Hold or Flip Investment) via the table display, which is fully customizable in terms of position and appearance.
Why Use This Indicator?
The "Contrarian Market Structure Break" indicator offers a robust framework for identifying high-probability reversal and continuation setups using ICT principles. Its multi-timeframe analysis, clear signal visualization, and innovative Blue Dot Tracker provide traders with actionable insights into market dynamics. Whether you're a swing trader or a day trader, this indicator’s flexibility and intuitive design make it a valuable addition to your trading arsenal.
Note for TradingView Moderators
This script complies with TradingView's House Rules by providing an educational and transparent description without performance claims or guarantees. It is designed to assist traders in technical analysis and should be used alongside proper risk management and personal research. The code is original, well-documented, and includes customizable inputs and clear visual outputs to enhance the user experience.
Tips for Users:
Backtest thoroughly on your chosen asset and timeframe to validate signal reliability. Combine with other indicators or price action analysis for confirmation of entries and exits. Adjust timeframe settings and enable/disable short-term structures to match market volatility and your trading style.
Hope the "Contrarian Market Structure Break" indicator enhances your trading strategy and helps you navigate the markets with confidence! Happy trading!

Jitendra MTF RSI VWAP ADX EMA CROSS MACD StochasticDetailed summary This Indicator
Dynamic Table with Multi-timeframe (MTF) indicator dashboard
It analyzes key technical indicators across up to 6 timeframes and presents the results visually using arrows, colored cells, and indicator values
Toggle to Enable Disable Indicator & Timeframe
Image of Setting For Complete Details
drive.google.com
🧮 How It Works (Calculation Method)
=======================================================================
The core logic of the script uses the request.security() function to fetch each indicator’s value across multiple timeframes:
val_tf = request.security(syminfo.tickerid, tf, expression)
=======================================================================
📈 Indicator Calculations
RSI (Relative Strength Index) = ta.rsi(close, 14)
RSI Divergence (Regular & Hidden)
ta.pivotlow(rsi_tf, divLookbackLeft, divLookbackRight)
ta.pivothigh(rsi_tf, divLookbackLeft, divLookbackRight)
Bullish Divergence: RSI low detected by pivotlow
Bearish Divergence: RSI high detected by pivothigh
Hidden Divergence: Based on price and RSI direction
=======================================================================
ADX, +DI, -DI= ta.dmi(len, lensig)
Returns:
Used to assess trend strength and direction
=======================================================================
EMA (Exponential Moving Averages)
ta.ema(close, emaLength)
3 configurable EMAs
Price vs EMA status shown with green/red background
EMA1 vs EMA2 crossover gives:
▲ if EMA1 > EMA2
▼ if EMA1 < EMA2
=======================================================================
MACD (Moving Average Convergence Divergence)= ta.macd(close, 12, 26, 9)
Returns:
Comparison of MACD > Signal for bullish indicati
=======================================================================
Stochastic Oscillator
ta.stoch(close, high, low, stochKLen) → %K Raw
ta.sma(rawK, stochSmoothK) → Smoothed %K
ta.sma(k, stochSmoothD) → %D
=======================================================================
Table Construction Logic
Initializes a table with table.new()
Adds column headers on first bar (bar_index == 0)
Fills rows with data for: Current TF
Up to 5 additional user-selected timeframes
=======================================================================
✅ Color Logic
Custom color functions determine background/text color based on thresholds:
getRsiColor(val) => val > 60 ? aqua : val >= 40 ? green : red
getAdxColor(val) => val > 25 ? aqua : val >= 18 ? green : red
getVwapColor(close, vwap) => close > vwap ? green : red
=======================================================================
=======================================================================
Included Indicators
1. VWAP (Volume Weighted Average Price)
Displays whether current price is above or below VWAP
2. RSI (Relative Strength Index)
Value + Arrow showing direction change
Optional Divergence Detection (regular + hidden)
3. ADX (Average Directional Index)
ADX strength, +DI, -DI values
4. EMA (Exponential Moving Averages)
3 user-configurable EMAs (default: 5, 21, 50)
Displays value and color-coded status (price above or below)
5. EMA crossover symbol (▲ or ▼ between EMA1 and EMA2)
6. MACD (Moving Average Convergence Divergence)
7. MACD line and Histogram with color-coded background
8. Stochastic Oscillator
%K line shown, color-coded based on %K vs %D
⏱️ Multi-Timeframe (MTF) Support
Displays values for:
Current timeframe (CurTF)
Up to 5 custom timeframes (e.g., 15m, 1h, D, W, M)
Each row shows indicator values across selected timeframes
🔧 Key Features
Customizable Table Layout:
Position : top/bottom/center left/right
Text size : tiny to huge
Flexible Toggles:
You can enable/disable individual indicators (RSI, MACD, VWAP, EMA, etc.)
Select which EMAs to show and whether to display the crossover arrow
Color Coding:
RSI/ADX/DI: green, aqua, red based on strength
VWAP: green if price above, red if below
EMA: green/red backgrounds based on LTP >/< EMA
MACD: green if MACD > signal, red if < signal
Stoch: green if %K > %D, red if <
Thanks
Jitendra

LUCEO OHLCLUCEO OHLC Levels – Daily, Weekly, Monthly
Description:
This script displays dynamic OHLC (Open, High, Low, Close) levels for daily, weekly, and monthly timeframes, including both:
Previous period OHLC (shown in red)
Current period High/Low (shown in blue)
🔧 Fully customizable:
Toggle each timeframe (daily/weekly/monthly) independently
Adjust colors, labels, and line extensions
Place labels at start or end of the period
📌 Designed to help traders easily identify:
Key support/resistance zones
Breakout or rejection levels
Institutional price reaction zones
💡 Ideal for intraday, swing, and positional traders using multi-timeframe analysis.

Absorption DetectorABSORPTION DETECTOR -
The Absorption Detector identifies institutional order flow by detecting "absorption" patterns where smart money quietly accumulates or distributes positions by absorbing retail order flow. This creates high-probability support and resistance zones for trading. This is an approximation only and does not read any footprint data.
WHAT IS ABSORPTION?
Absorption occurs when institutions take the opposite side of retail trades, creating specific candlestick patterns with high volume and significant wicks. The indicator identifies two main patterns:
SELLING ABSORPTION (P-Pattern): Red zones above candles where institutions sell into retail buying pressure, creating resistance levels. Look for high volume candles with large upper wicks that close in the lower half.
BUYING ABSORPTION (B-Pattern): Green zones below candles where institutions buy from retail selling pressure, creating support levels. Look for high volume candles with large lower wicks that close in the upper half.
KEY FEATURES
- Automatic detection of institutional absorption patterns
- Dynamic support and resistance zone creation
- Customizable styling for all visual elements
- Historic zone display for backtesting analysis
- Strength-based filtering to show only high-probability setups
- Real-time alerts for new absorption patterns
- Professional info panel with key statistics
- Multi-timeframe compatibility
MAIN SETTINGS
Volume Threshold (1.2): Minimum volume surge required compared to average. Higher values = fewer but stronger signals.
Minimum Volume (2500): Absolute volume floor to prevent signals during low-volume periods.
Min Wick Size (0.2): Minimum wick size as ATR multiple. Ensures significant rejection occurred.
Minimum Strength (1.5): Combined volume and wick strength filter. Higher values = higher quality signals.
Show Historic Zones (OFF): Enable to see all historical zones for backtesting. Disable for better performance.
Zone Extension (20): How many bars to project zones forward for anticipating future reactions.
TRADING APPROACH
ZONE REACTION STRATEGY: Wait for price to approach absorption zones and trade the bounce or rejection. Use the zones as dynamic support and resistance levels.
BREAKOUT STRATEGY: Trade decisive breaks of strong absorption zones with proper risk management. Failed zones often lead to strong moves.
CONFLUENCE TRADING: Combine absorption zones with other technical analysis for highest probability setups. Look for alignment with trend lines, Fibonacci levels, and key support/resistance.
RISK MANAGEMENT: Always use stop losses beyond the absorption zones. Target minimum 1:2 risk-reward ratios. Position size appropriately based on zone strength.
OPTIMIZATION GUIDE
For Conservative Trading (fewer, higher quality signals):
- Volume Threshold: 1.5
- Minimum Strength: 2.0
- Min Wick Size: 0.3
For Aggressive Trading (more signals, requires careful filtering):
- Volume Threshold: 1.1
- Minimum Strength: 1.0
- Min Wick Size: 0.15
BEST PRACTICES
Markets: Works best on liquid instruments with good volume - major forex pairs, popular stocks, liquid futures, and established cryptocurrencies.
Timeframes: Effective on all timeframes from 1-minute scalping to daily swing trading. Adjust settings based on your timeframe and trading style.
Confirmation: Never trade absorption signals in isolation. Always combine with trend analysis, market structure, and proper risk management.
Session Timing: Be aware of market sessions and avoid trading during low liquidity periods or major news events.
Backtesting: Use the historic zones feature to validate performance on your chosen market and timeframe before live trading.
CUSTOMIZATION
The indicator offers complete visual customization including zone colors, border styles, label appearances, and info panel positioning. All colors can be adapted to match your chart theme and personal preferences.
Alert system provides both basic and custom message alerts for real-time notifications of new absorption patterns.
PERFORMANCE NOTES
Default settings are optimized for most markets and timeframes. For best performance on older charts, keep "Show Historic Zones" disabled unless specifically backtesting.
The indicator maintains excellent performance even with extensive historical analysis enabled, handling up to 500 zones and 100 labels for comprehensive backtesting.

JXMJXRS - Mean Reversion Bands ToolThis indicator highlights when price is likely overextended and may revert back toward its average. It does this by plotting a central mean (EMA, SMA, or VWAP) with dynamic bands based on either standard deviation or ATR. These bands help show how far price has moved from normal levels.
When price moves beyond the outer bands, the background highlights in red or green to signal possible exhaustion. An optional setting allows the highlight to trigger only if the full candle body breaks beyond the band, helping reduce noise from small spikes or wicks.
The inner bands show more moderate overextensions, while the outer bands focus on stronger, less frequent moves. This makes the tool useful in both ranging and trending environments.
The indicator also includes a hidden oscillator that measures how far price is from the mean in standardized units. It stays off by default but can be enabled by advanced users if needed.
This tool works best on higher timeframes, such as the daily chart. It is not a buy or sell signal, but a way to add context and filter low-quality setups by focusing only on significant price extensions.
A red background appears when price closes significantly above the upper volatility band. This suggests that price is stretched far above its normal range and may be entering an overbought or exhausted state. A green background appears when price closes significantly below the lower volatility band, indicating a potential oversold condition. These zones highlight areas where a price reversion or slowdown may be more likely based on statistical extremes.

Multi-Timeframe Bands (Horizontal Table, Robust, No get_cols)Mulit-timeframe /Kelt Bands with Table Price tracker
This is a simple Kelt style Band indicator draws colored horizontal bands representing the high (top) and low (bottom) for each of the following timeframes:
4h: Blue (bottom), Red (top)
1D: Gold (bottom/top)
1W: Purple (bottom/top)
1M: Orange (bottom/top)
Quarterly: Light purple (bottom/top)
The script works on any chart timeframe, and the bands will update dynamically.
I've added a horizontal box to show the corresponding prices at the top.

Auto LevelsSimple auto level tracker that automatically detects and plots the high/low for the current week, day, and month, as well as the previous week/day/month.
Includes a built-in dashboard that shows how close or far price is from each level, along with directional guidance (above/below). The closest level to current price is automatically highlighted for quick awareness.
Everything is fully toggleable to only show the levels and info that is needed.

Ultra Supply & DemandUltra Supply and Demand fixed.
Order Block Detection: Identifies potential order blocks (demand/supply zones)

Multi-Timeframe Bands (final, with labels)This is a simple Kelt style Band indicator draws colored horizontal bands representing the high (top) and low (bottom) for each of the following timeframes:
4h: Blue (bottom), Red (top)
1D: Gold (bottom/top)
1W: Purple (bottom/top)
1M: Orange (bottom/top)
Quarterly: Light purple (bottom/top)
The script works on any chart timeframe, and the bands will update dynamically.

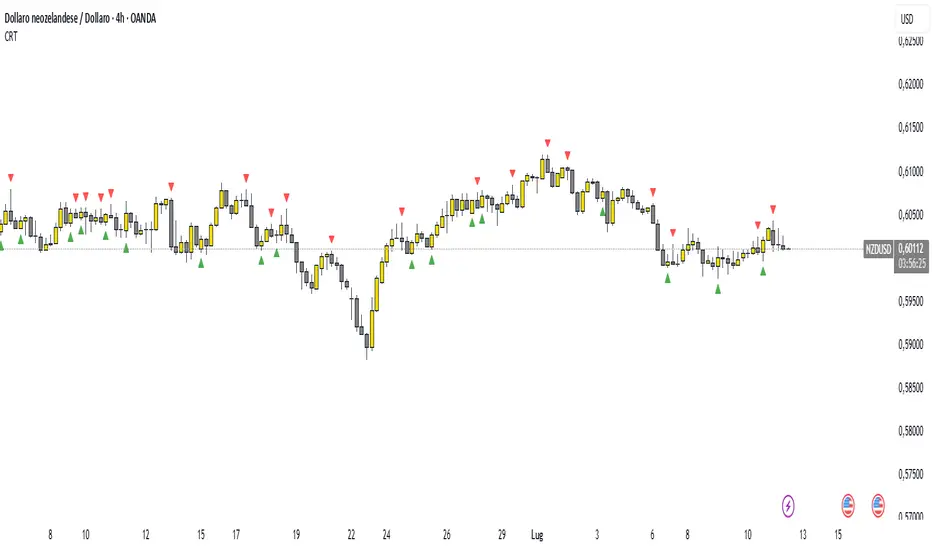
Candle Range Theory (CRT) indicator📌 Indicator Name: Candle Range Theory (CRT) indicator
This indicator detects potential bullish and bearish reversal setups based on specific candlestick price action behavior. It is designed to highlight moments when the market may be rejecting extremes and preparing to reverse direction — but only after confirmation with the closing price.
🔍 How It Works:
Bullish Setup (Long Signal):
The previous candle is bearish (closes lower than it opens).
The current candle makes a lower low than the previous one.
The current candle closes above the previous candle’s close.
Bearish Setup (Short Signal):
The previous candle is bullish (closes higher than it opens).
The current candle makes a higher high than the previous one.
The current candle closes below the previous candle’s close.
Signals are only triggered after the bar is fully closed, to avoid premature entries.
🔔 The script includes alert conditions for both long and short setups so you can receive notifications instantly.
🎥 Inspiration:
The idea for this indicator came from the excellent educational content presented in this video:
"How to Read Candlesticks Like a Pro"
We highly recommend watching it to better understand the price action principles behind this signal.