WTI Oil H4 | Falling to pullback supportWTI oil (USOIL) is falling towards a pullback support and could potentially bounce off this level to climb higher.
Buy entry is at 79.94 which is a pullback support.
Stop loss is at 79.00 which is a level that lies underneath the 23.6% Fibonacci retracement level.
Take profit is at 82.41 which is a pullback resistance.
High Risk Investment Warning
Trading Forex/CFDs on margin carries a high level of risk and may not be suitable for all investors. Leverage can work against you.
Stratos Markets Limited (www.fxcm.com):
CFDs are complex instruments and come with a high risk of losing money rapidly due to leverage. 68% of retail investor accounts lose money when trading CFDs with this provider. You should consider whether you understand how CFDs work and whether you can afford to take the high risk of losing your money.
Stratos Europe Ltd, previously FXCM EU Ltd (www.fxcm.com):
CFDs are complex instruments and come with a high risk of losing money rapidly due to leverage. 70% of retail investor accounts lose money when trading CFDs with this provider. You should consider whether you understand how CFDs work and whether you can afford to take the high risk of losing your money.
Stratos Trading Pty. Limited (www.fxcm.com):
Trading FX/CFDs carries significant risks. FXCM AU (AFSL 309763), please read the Financial Services Guide, Product Disclosure Statement, Target Market Determination and Terms of Business at www.fxcm.com
Stratos Global LLC (www.fxcm.com):
Losses can exceed deposits.
Please be advised that the information presented on TradingView is provided to FXCM (‘Company’, ‘we’) by a third-party provider (‘TFA Global Pte Ltd’). Please be reminded that you are solely responsible for the trading decisions on your account. There is a very high degree of risk involved in trading. Any information and/or content is intended entirely for research, educational and informational purposes only and does not constitute investment or consultation advice or investment strategy. The information is not tailored to the investment needs of any specific person and therefore does not involve a consideration of any of the investment objectives, financial situation or needs of any viewer that may receive it. Kindly also note that past performance is not a reliable indicator of future results. Actual results may differ materially from those anticipated in forward-looking or past performance statements. We assume no liability as to the accuracy or completeness of any of the information and/or content provided herein and the Company cannot be held responsible for any omission, mistake nor for any loss or damage including without limitation to any loss of profit which may arise from reliance on any information supplied by TFA Global Pte Ltd.
The speaker(s) is neither an employee, agent nor representative of FXCM and is therefore acting independently. The opinions given are their own, constitute general market commentary, and do not constitute the opinion or advice of FXCM or any form of personal or investment advice. FXCM neither endorses nor guarantees offerings of third-party speakers, nor is FXCM responsible for the content, veracity or opinions of third-party speakers, presenters or participants.
Community ideas

SUGAR/USD ShortSUGAR/USD Short
Minimum entry requirements:
• Tap into area of value.
• 1H impulse down below area of value.
• If 2 touch 15 min continuation, 5 min risk entry within it, or reduced risk entry on the break of it.

Market is on its Upper Band - Its 2nd Camel HumpAll the major markets are testing their upper band channels since their first major hump in the 90s.
The Russell 2000 has reached its second hump and is on the way down. Though the Russell 2000 is the least known among the four indices, it serves as a leading indicator for the other three.
Why?
The Russell 2000 comprises 2000 mid-sized listed companies, which I believe employ the largest workforce in the United States. This means their employees are also the mass consumers who use or buy products and services listed on the Nasdaq, S&P, and Dow Jones. When the Russell 2000 is not doing well, mass consumers tend to spend less, and the rest of the indices subsequently follow.
Micro E-mini Futures & Options
Ticker: MYM
Minimum fluctuation:
Outright: 1.0 index points = $0.50
Disclaimer:
• What presented here is not a recommendation, please consult your licensed broker.
• Our mission is to create lateral thinking skills for every investor and trader, knowing when to take a calculated risk with market uncertainty and a bolder risk when opportunity arises.
CME Real-time Market Data help identify trading set-ups in real-time and express my market views. If you have futures in your trading portfolio, you can check out on CME Group data plans available that suit your trading needs www.tradingview.com

XLM Stellar in 2024 (deep research)Stellar (XLM)
Stellar is an open-source, peer-to-peer virtual currency network that first appeared in 2015 The network was founded by current chief architect Jed McCaleb, current chief scientist David Mazier, and former lawyer Joyce Kim, who has since left Stellar The network aims to make moving money across borders faster and easier, especially for those without access to traditional banking services.
The Stellar blockchain is a distributed ledger used to transfer digital currencies. The primary token of the Stellar blockchain is XLM. The Stellar blockchain uses the Stellar Consensus Protocol (SCP), which is different from the proof-of-work mechanism used in Bitcoin. SCP allows for fast and inexpensive transactions and does not require mining, making it more energy efficient Stellar transactions are confirmed within 5 seconds Transaction costs are extremely low: the average transaction cost is a fraction of a US penny.
The Stellar Development Fund was created to support the development and growth of the Stellar network. The goal of the fund is to promote global financial access, literacy, and inclusion. Stellar has a unique feature, Anchors, which are organizations that can hold deposits and make loans. This allows for a network of inputs and outputs for conversion between digital and traditional currencies Stellar is involved in various partnerships and projects to expand financial inclusion and improve cross-border payments For example, in January 2021, the Ministry of Digital Transformation of Ukraine announced its cooperation and collaboration with Stellar in the development of Ukraine's digital infrastructure.
Roadmap
The Stellar Development Foundation has published a strategic roadmap for 2023, focusing on three blocks to support and grow the Stellar network, ecosystem, and community:
Block 1: Utility is an indicator of growth - this principle aims to attract more developers to the network by providing utility. By focusing on the dysfunctional elements of the current system, Stellar aims to highlight and address them through the network. This includes bringing top-notch assets. Into the network, expanding access through global ramps, and honing in on use cases.
Block 2: Stellar - the network of choice - this block aims to make Stellar the standard for everyday financial services. The goal is to show that Stellar is a network that will not only survive but will set the standard in the industry.
Block 3: Stellar for Developers - This block aims to support the growth of the Stellar ecosystem by providing a clear path for builders to develop solutions. Stellar aims to make it easier for developers to get online and support them in building real-world solutions.
The roadmap also outlines a focus on expanding payments and remittances, leveraging the movement of digital value to provide financial services such as savings, loans, credit, and other transactions in a more accessible way. Stellar's goal is to make it easier for people to access financial services without creating the difficulties and challenges they face today.
Team
The Stellar team is highly regarded in the cryptocurrency space. They have a wealth of experience and expertise, and key figures such as Jed McCaleb, co-founder of Ripple, and Joyce Kim have been instrumental in the development and growth of Stellar. The team consists of more than 80 experts from various leading gaming fields, which is a testament to the diversity and high caliber of the employees.
In addition, the team includes veterans from industry giants such as Binance, ConsenSys, Google, and Microsoft, further enhancing their credibility and expertise in the cryptocurrency space. Stellar has also partnered with major financial institutions and governments, such as the Ministry of Digital Transformation of Ukraine, to create an ecosystem of virtual assets and a national digital currency This is a testament to their extensive experience and strong reputation in the industry.
Audit
Stellar has been listed on the Cyberscope platform, which gives Stellar's due diligence score of 88%, indicating a very low-risk level. The security score is 71%, indicating a moderate level of security. Stellar's audit history is not provided in the search. results, but it is noted that Stellar has not been audited by CertiK Additionally, the Stellar Development Fund (SDF) announced the launch of an audited bank that will distribute up to $1 million in security audit credits in coordination with six top-tier audit firms This initiative aims to support the growth and security of the Stellar ecosystem by providing financial assistance for security audits of projects being built on the network.
GitHub
The project repository seems to be quite active. There were 1860 commits in April!
This indicates a significant level of activity in the development and maintenance of the project. The project has an active community of developers contributing to various repositories. These include the core protocol, smart contracts, and multiple tools and resources for developers. The project has released new features and tools such as the Starlight wallet, which allows for private, instant and secure transactions This is a testament to the constant innovation and development of the project.
Ecosystem
The Stellar ecosystem has grown significantly, with many applications and projects coming online.
These include:
StellarX: An easy-to-use peer-to-peer trading platform for trading assets on the Stellar network.
Stellarport: A web-based interface to access the Stellar network, allowing users to trade assets, send payments, and create tokens.
Lobster: A mobile and web wallet for managing Stellar accounts and assets.
StellarTerm: An open-source client for the Stellar network that allows users to access a decentralized exchange and manage their accounts.
Stellar Lumens: The native digital currency of the Stellar network, used as an intermediate currency to facilitate transactions between different assets.
According to the latest data, the total value of assets locked in the Stellar ecosystem is $9.84 million. The high TVL indicates that a significant number of investors uses the protocol and that it has a high level of liquidity TVL in the Stellar ecosystem is a testament to the growing interest and confidence in DeFi's capabilities on the network As the Stellar ecosystem continues to expand, TVL can be expected to continue to grow, reflecting the growing popularity and utility of the network.
Stellar has also made significant strides in smart contracts in recent years with the introduction of Soroban Soroban is a smart contracts platform on Stellar that allows developers to create, deploy and interact with decentralized applications (dapps) on the network The Stellar Development Fund has committed $100 million to the Soroban Adoption Fund to incentivize the development of projects that leverage the network's smart contract capabilities According to the latest data, 466 projects are active on the Stellar network, demonstrating the versatility of the platform and its potential to revolutionize the way financial transactions are conducted.
Tokenization
Tokenization is the process of representing real world assets (RWAs) or financial products as digital assets on the blockchain It is a key feature of the Stellar blockchain network, allowing any developer or enterprise to issue assets on the platform The Stellar blockchain is designed to support the tokenization of assets, including fiat currencies and securities, in a secure and simple way This enables the creation of digital representations of real-world backed assets, which can then be moved around the world around the clock, quickly and at low cost Below are RWA's market capitalization statistics across various networks.
The process of tokenizing an asset on the Stellar network involves four main steps:
1 Creation of the issuing account: The first step is to create an account on the Stellar network that will be used to issue the asset.
2 Creating a distribution account: Next, a separate account is created to hold the issued asset.
3 Add a trust line for the asset to the distribution account: The trust line is a record of the asset and the maximum amount of that asset that the account is willing to hold This step ensures that the distribution account can receive and store the newly issued asset.
4 Transferring the asset from the issuing account to the distribution account: The last step is to transfer the asset from the issuing account to the distribution account.
Stellar's built-in software features allow for asset control, which means issuers can limit the use of an asset and who can own it by setting various configuration flags This provides a high level of flexibility and control for asset issuers.
Tokenizing assets on the Stellar network provides several benefits:
Reduced record keeping: Issuers can reduce the number of internal sources for record keeping by using the blockchain as the primary source of truth for non-PII data.
Increased market access: Issuers can expand their markets by offering their assets to the ins and outs and wallets built on the Stellar network.
Instant settlement: The Stellar network provides instant settlement 24/7, reducing the cost of processing financial transactions.
Interchangeability: Assets created on the Stellar network are interoperable with the rest of the digital asset ecosystem.
Low cost: The Stellar blockchain is known for its low transaction costs, making it an attractive choice for asset tokenization.
Tokenization on the Stellar network thus enables the creation of digital representations of real-world assets, providing a secure, efficient and cost-effective way to transfer and manage assets on the blockchain.
Bridges
One of the most notable bridges is Allbridge, which provides interoperability between Stellar and several other leading blockchains, including Ethereum, Solana, Polygon and Celo This bridge allows users to transfer assets between these networks, utilizing the unique features of each blockchain and enjoying the fast and inexpensive transactions that Stellar is known for Allbridge's integration with Stellar was made possible through a partnership with Ultra Stellar, a key player in the Stellar ecosystem An example of how Allbridge works:
Another significant development in Stellar interoperability was the introduction of Spacewalk, a trust-minimized bridge between Stellar and the Polkadot/Kusama ecosystems Spacewalk enables the transfer of stable tokens from the Stellar network to the Polkadot/Kusama ecosystems, opening up new opportunities for users to access a wide range of DeFi services The Stellar Development Foundation (SDF) also launched the Stellar Bridge Bounty Program, which supports the development of cross-chain solutions on the Stellar network This program has led to the creation of innovative bridge solutions such as Starbridge, which aims to create a robust integration between Stellar and Ethereum.
These bridging and interoperability solutions are critical to the growth and proliferation of the Stellar network, as they enable users to access a wider range of assets and services while taking advantage of Stellar's fast and low-cost transactions As the Stellar ecosystem expands, we can expect to see further developments in bridging and interoperability, further increasing the utility and reach of the network The need for bridges in the race to tokenize real world assets underscores the importance of seamless integration and interoperability in the financial ecosystem By enabling asset transfer between different blockchain networks, bridges play a critical role in facilitating tokenization of real-world assets, which is expected to unlock significant value and create new opportunities for investors and businesses alike As the demand for tokenized assets continues to grow, the design and implementation of bridges will play an important role in meeting this demand and enabling efficient and secure asset transfers between different blockchain networks.
Conclusion
Stellar is a truly outstanding project with a vibrant ecosystem with a significant number of projects and a wide range of opportunities Fast and inexpensive transactions, energy efficiency, and a focus on financial inclusion make it attractive to both developers and users Support for tokenization of real assets further extends the network's capabilities by enabling digital representations of a wide range of financial instruments The development of bridges and interoperability solutions on the Stellar network demonstrates its commitment to creating a more interconnected and accessible financial ecosystem These bridges enable seamless integration with other blockchain networks, extending the reach and utility of the Stellar network and making it an ideal platform for cross-border payments and tokenization of real-world assets.
All of the above factors point to the significant development of the Stellar project, as well as the price of XLM The growing interest in the network
and its adoption, as evidenced by the increasing number of TVLs and the development of bridging, interoperability solutions, suggest a large growth of XLM While it is difficult to predict specific news or events that will trigger the price to rise and get out of accumulation, I have already started accumulating XLM in my portfolio You can familiarize yourself with it at the link below the chart.
Best regards EXCAVO

🔔Everything You need to Know about Ethereum ETF🔔🌐Today seems to be the time to decide about the Ethereum ETF. (⚠️ The cryptocurrency market may get excited when the result is announced, so be careful with your positions⚠️ ).
🔔Let's take a look at what happened to Bitcoin when the Bitcoin ETF was adopted.
When the Bitcoin ETF was approved , Bitcoin corrected about ➖20% and this correction lasted about 12 days . This happened seemed to express the proverb, " Buy the Rumor, Sell the News ".👇
💡So there is a possibility that if Ethereum ETF is approved, Ethereum will be corrected for a while like Bitcoin .
📊Now let's check the Ethereum chart .
🏃♂️Ethereum has managed to break the 🔴 Heavy Resistance zone 🔴 (now the 🟢 Heavy Support zone($3,580-$2,930) 🟢) of Ethereum with the help of the Classic Falling Wedge Pattern . It is currently moving near the 🔴Resistance zone($4,380-$3,950)🔴.
🌊According to the Elliott wave theory , Ethereum seems completed the microwave 3 of main wave 3 . Ethereum seems to be completing microwave 4 of the main wave 3 right now.
📈Let's look at the ETHBTC chart and see how much Ethereum will be affected by the growth or decline of the cryptocurrency market .
📈 ETHBTC seems to be trying to break the important Resistance line and Resistance zone , and this is a good sign for Ethereum and most altcoins. If the cryptocurrency market starts to increase, it seems that Ethereum will get a larger share of this increase. It could be a sign for Altseason .
📈But right now it seems that ETHBTC should have a correction to the Support zone or Fibonacci lines .👇
🔔According to the above explanations , it seems that if you want to add Ethereum and other Altcoins that are on the Ethereum network to your portfolio , it is better to wait for Ethereum to reach the 🟢 Heavy Support zone($3,580-$2,930) 🟢, if ETHBTC also corrects at the same time, it will be a more suitable situation.
🔔If you want to open a position on Ethereum, it is better to have a short position , because if Ethereum ETF is approved , the same scenario as Bitcoin may happen to it, and if it is not approved , the possibility of a fall is very very high , so the risk of a short position may be less now. What is your idea❗️❓
❗️⚠️Note⚠️❗️: If the Ethereum ETF is not approved, you better wait because Ethereum is likely to lose the 🟢 Heavy Support zone($3,580-$2,930) 🟢, and this shock will also affect Bitcoin and other Tokens.
❗️⚠️Note⚠️❗️: An important point you should always remember is capital management and lack of greed.
Ethereum Analyze ( ETHUSDT ), 4-hour time frame ⏰.
Do not forget to put Stop loss for your positions (For every position you want to open).
Please follow your strategy; this is just my Idea, and I will gladly see your ideas in this post.
Please do not forget the ✅' like '✅ button 🙏😊 & Share it with your friends; thanks, and Trade safe.

Learn from the Pros: Trading Quotes from Trading LegendsSpeculation is as old as the hills, says one of the world’s best traders of all time, Jesse Livermore. In this blog, we give you the best quotes by the best traders — use them to get inspired and realize that success in trading is possible.
Paul Tudor Jones, hedge fund manager, founder of Tudor :
“I always believe that prices move first and fundamentals come second.”
“If I have positions going against me, I get right out; if they are going for me, I keep them. Risk control is the most important thing in trading.”
“I believe the very best money is made at the market turns. Everyone says you get killed trying to pick tops and bottoms and you make all your money by playing the trend in the middle. Well for twelve years I have been missing the meat in the middle but I have made a lot of money at tops and bottoms.”
Stanley Druckenmiller, family office manager, founder of Duquesne:
“I don't really like hedging. To me, if something needs to be hedged, you shouldn't have a position in it.”
“I like putting all my eggs in one basket and then watching the basket very carefully.”
“Soros has taught me that when you have tremendous conviction on a trade, you have to go for the jugular. It takes courage to be a pig. It takes courage to ride a profit with huge leverage.”
George Soros, hedge fund manager, founder of Soros Fund Management :
“It's not whether you're right or wrong, but how much money you make when you're right and how much you lose when you're wrong.”
“Markets are constantly in a state of uncertainty and flux and money is made by discounting the obvious and betting on the unexpected.”
“My peculiarity is that I don't have a particular style of investing or, more exactly, I try to change my style to fit the conditions.”
Ray Dalio, hedge fund manager, founder of Bridgewater Associates :
“In trading you have to be defensive and aggressive at the same time. If you are not aggressive, you are not going to make money, and if you are not defensive, you are not going to keep money.”
“Diversifying well is the most important thing you need to do in order to invest well.”
“To make money in the markets, you have to think independently and be humble.”
Jesse Livermore, stock trader, portrayed in “Reminiscences of a Stock Operator”:
“It never was my thinking that made the big money for me. It was always my sitting.”
“It is literally true that millions come easier to a trader after he knows how to trade, than hundreds did in the days of his ignorance.”
“There is nothing new on Wall Street. There can’t be because speculation is as old as the hills. Whatever happens in the stock market today has happened before and will happen again.”
Let’s hear from you!
What’s your favorite trading quote or maybe a favorite trader? Let us know in the comments!

☄️ SEC GREENLIGHTS ETHEREUM ETF'S! HISTORIC ☄️☄️ Crazy development today as we now know that the SEC has officially greenlit ETF's for Ethereum in a widely anticipated move, helping to further bolster and boost crypto's foothold and position in the financial world, giving many a confidence boost in crypto and helping to set the stage for the role that cryptocurrencies will come to play in the next few years for not one, but many.
☄️ Retail investors and whale's have been waiting to see what the SEC would ultimately decide in it's decision on whether or not to approve ETF's for Ethereum, much like what we've already seen in the last few months with the SEC also approving ETF's for Bitcoin setting the stage for others to enter the crypto space such as Blackrock which itself has seen record Bitcoin inflows this month, even hitting a 6 week high as highlighted in the article linked below:
cointelegraph.com
☄️ That being said as we can see by the chart linked below, Ethereum whales and retail investors alike, took the news well and we can see just how much of a jump we've gotten since then.
☄️ It's a crazy jump, even with the news considered. I mean price jumped from $3100 to $3,700 like nothing even managing to hit $3,900, it's unprecedented but something we'll gladly take, especially after this news it's the kind of positive reaction we like to see.
☄️ Everything considered, the next few days will be pretty pivotal as we'll undoubtedly face retest and traders will be watching things intensely to see whether or not we can break up further or if we'll retrace and get a reversal. Personally I see us retracing, after an impulse move up we almost always see some sort of reversal or retracement. We'll see this battle the next few days as many seek to close positions and take profit while many others in turn will be buying whether it be for FOMO Or in anticipation, hope for prices to move up higher.
☄️ I can see that happening though again, we have had a literal 25% jump from 3100, you don't see that kind of jump everyday, let alone at all in some cases, below I've added two lines to display this ascending channel we've got:
☄️ Personally, I can see this being the make or break it for traders, long as we keep within the channel things are bullish overall but if we fall below and out of the channel then we'll likely drop, retrace and face losing that 200 EMA by which then we'd risk falling even further so I'd definitely keep an eye out for those things and a likely retracement, especially after this impulse wave.
☄️ I just wanted to make a quick post, this has been a historic move and I'm glad I've been able to take part and be here for such an event, I've added a link to an article on the greenlight below as well for reference. Thanks for tuning in and blessing's, here's to a bright future for crypto. 🥂
www.ft.com
~ Rock '

GME Gamestop Technical Analysis and Trade IdeaIn a recent video, I covered a trade idea prior to the Gamestop (GME) bull rally. Since then, we’ve observed a significant bearish movement. I’m closely monitoring the current price level for another potential buying opportunity, provided that price action aligns with my analysis from the video. The market is currently moving sideways, and if we wait for increased volatility above and below the range, we might be able to capitalize on a bullish trend by entering a break re-test and fail of the range on the 15-minute chart if we see higher highs/lows forming.
The video covers critical elements, including trend analysis, price action insights, market structure, and a potential trade setup. Always exercise prudent risk management when trading, and keep in mind that this information is purely educational and not financial advice. 🚀📊

Natural Gas Price Forecast | Oil, Silver, GoldNatural Gas stock Bulls NatGas Support & Resistance Guide
AMEX:UNG Stock Forecast
USO Oil Stock Forecast
DXY US dollar Stock Forecast
Gold XAUUSD Stock Forecast
Silver XAGUSD

Bitcoin - New all time high soon! (Follow this channel)Bitcoin is breaking out of the bear market structure and creating a new uptrend that will lead to an all-time high! This thesis is supported by the fact that after the halving event, Bitcoin always goes up (statistically, 100% probability). The halving event took place 1 month ago and cut the reward for mines by half. It's recommended to trade with the trend to increase the probability of success in your trades.
From a technical perspective, Bitcoin has been moving in the ascending parallel channel, so you can definitely take advantage of that and buy/sell Bitcoin at the upward sloping trendlines! With TradingView, you can set an alert, and when it hits, you will get notified.
What are the resistances on the way up? As I mentioned, the upward-sloping trendline of the parallel ascending channel is the first one. The second one is the FAIR VALUE GAP (FVGAP) which was created in April 2024. Usually, the start of the GAP and the end of the GAP are strong levels by themselves. You can use these levels for your short-term trades with leverage. These resistances Bitcoin needs to break before a continuation to a new all-time high; I don't see any other significant levels worth mentioning. Always choose the strongest levels to increase the probability of success.
I am bullish on Bitcoin, and I believe we will see prices above 100k in Q3/Q4 2024. Let me know in the comment section - are you still waiting for a big crash to buy the dip? Let me know what you think about my analysis, and please hit boost and follow for more ideas. Trading is not hard if you have a good coach! Thank you, and I wish you successful trades.

Bitcoin BTC price + CPI US 15.05 will stir up the marketHere is a chart of #BTCUSDT on the 12-hour timeframe.
At first glance, it looks nothing special: a prolonged consolidation on falling trading volumes, everything is natural and natural.
But tomorrow, at 15.05 at lunchtime with the close of the 12hr candlestick, everything can change.
Tomorrow is the announcement of the "fresh" US CPI rate.
Forecast: inflation will decrease from 3.5% to 3.4%.
Declining inflation = a good signal for the growth of financial markets.
But the tweet from Mr. Biden adds some "spice".
President Biden: wants to give new home buyers $400 per month for 2 years to help people with housing.
This is either a pre-election promise or a good opportunity to start the “printing press”
And now for a bit of conspiracy theorizing:
Let's assume for a moment that Biden knows a little more than we do. And tomorrow it will be announced that inflation has fallen not to 3.4% but to 3.2% or even 3%.
This will definitely cause a powerful surge and growth in the market.
The last thing that comes to mind is how massively $ were printed and distributed in the spring of 2020 as financial aid during COVID-19.
Do you remember how the crypto market grew then in 20\21 from an additional portion of “retail's crazy money”?)
So where do you think the CRYPTOCAP:BTC price will go in 24 hours?
👍 towards $71000
👎🏿 towards $56500

GameStop Stock Evokes Dreams of Rocket Ships and Diamond HandsShares of the video game store tested retail traders’ survival skills. But the meme stock madness also bamboozled the pros.
In the span of just a few regular trading sessions, with some stomach-churning pre-market action in between, GameStop once again made headlines. Roughly three years ago, Keith Gill — known as “Roaring Kitty” on the internet (mostly Reddit) — triggered a huge rally in the shares of a little known video game retailer called GameStop NYSE:GME .
The Hidden Gem
Roaring Kitty took a big long position in GameStop for his belief that it was a company with a lot of potential. And at the same time, he blamed the big bad hedge funds for keeping a lid on share-price growth by shorting the living thing out of it.
Mr Kitty’s thesis caught the attention of fellow retail traders on Reddit’s r/WallStreetBets chat board, a place where self-described “degens” exchange fast-churning trading ideas. Soon after, shares were flying high, riding on gains of more than 2,000%. GameStop was set free and institutional investors got smoked.
These were the good old days of speculative pumps and the absolute power of like-minded individuals seeking the thrill of quick profit and adrenaline rush. And — it seems — we’re back at it again with the meme stock corner going fully bananas.
Roaring Comeback
Roaring Kitty’s X account switched the lights on after three years of silence. In a rather vague post, he published a drawing of a man leaning forward . Boy, did that get understood in all the possible ways. Shares took off by as much as 75% a day after that post went live. A breakneck rally went on for a few more days, evoking dreams of rocket ships and diamond hands.
A week later, none of that is there anymore. Shares are not only back where they were before the surge — they’re doing worse. The rollercoaster ride lifted the stock from $20 on Monday to $80 on Tuesday, a 300% pop per share.
By Friday, shares had briefly dipped below $20, pulling off a boomerang move and erasing 75% from the stock’s weekly peak.
And, this is how GameStop tricked retail investors into believing that this the GameStop rally 2.0. But, before that, it smacked professionals with huge losses on the way up.
Same Old, Same Old
Professional money managers had borrowed about 30% of all shares outstanding for — you guessed it — shorting purposes. The thing with shorting a stock, i.e. profiting from its decline, is that if you’re wrong, you can be wrong until your account is wiped out because shares could rise indefinitely.
GameStop short sellers were ironed out. They lost more than $2 billion in just two days, according to data analytics firm S3 Partners.
“After being down $862 million in mark-to-market losses yesterday, NYSE:GME shorts are down another $1.36 billion in mark-to-market losses today,” S3 Partners’ Managing Director Ihor Dusaniwsky commented on X .
If only there was some similar experience in recent history that would inform hedge funds:
Not to bet on a red-hot stock, popular among the retail crowds, because you’ll get burned if they come after you with a short squeeze.
Not to bet on a red-hot stock that’s thinly traded, because you won’t be able to easily get rid of your short position that’s draining your funds.
After all, they did make a movie ( “Dumb Money” ) about shorting GameStop. Yet, “smart money” did it again. Professional hedge funders weren’t the only ones to get knocked.
What Goes Up Must Come Down
The retail trading army on Reddit and X lost some serious cash, too. Just when shares were going in the other direction. Redditors on r/WallStreetBets initially cheered the first rays of the powerful upside swing. This sparked hopes of a revival before these same guys started flooding the board with screenshots of mounting losses as shares were nosediving.
What Happened and Why the Fast About-Face?
Other than the super frothy state of the highly inflated stock, what helped shares come back to earth was GameStop’s securities filing to sell some equity. Apparently, the C-suite of the video game store figured they could ride out the surge and issue up to 45 million shares that would dilute the number of existing shares by as much as 15%.
In another price-damaging filing , GameStop said that it expects net sales for the current quarter to land between $872 million and $892 million. The forecast is well below last year’s $1.237 billion and the consensus views for $1.045 billion.
With that said, GameStop shares are still in the green for the year, following the head-spinning trip to the moon and back. So, until next time?
We Want to Hear from You!
Let us know about your experience with that volatile beast! Do you own shares, when did you buy, and are you optimistic about the future of GameStop?

Bitcoin: 64K Test For New Longs.Bitcoin has followed my anticipated scenario nicely over the recent two weeks (it doesn't always agree). As I have written in my previous two articles, the 64K and 68K resistance areas are potential take profit zones, NOT locations to put on more risk. Price action appears to be confirming that and is attempting to retrace off the 66K area minor resistance (See upper arrow). While this price action appears to be bearish it must be considered in light of the broader structure.
Since the March peak, Bitcoin has been in consolidation mode (upon completion of 5 waves). This structure represents a broader HIGHER LOW with 56K established as the bottom of the range. This implies that the broader trend continues to be BULLISH even though recent price action has yet to push major resistances. This is a key piece of context because it helps to shape risk and profit potential for the near future.
How you navigate this will depend on your risk tolerance and trade style but no matter how you look at it, current prices are unattractive for longs on most time horizons in my opinion. The scenario I anticipate this week (see illustration) is a minor retrace to 64K (old resistance/new support) followed by a momentum continuation into the 70K resistance. If a long confirmation appears (Trade Scanner Pro), this can play out well for traders on shorter time horizons.
While I am optimistic in this regard, I also consider that price CAN break 64K and test 60K again. There is NO way to forecast how the market will behave, ESPECIALLY the longer the time horizon.
Managing risk and capitalizing on movements EFFECTIVELY requires knowing how to evaluate market structure in order to stack probabilities. Based on this context if I can determine the trend is bullish for example, I can estimate that supports have a greater than 50% chance of staying intact. I can also expect long signals to have greater than 50% chance of generating some amount of profit, but there is no way to anticipate how much exactly (markets are MOSTLY RANDOM).
Adjusting to price action and looking for signal conflicts or using a trailing stop helps to improve decision making in such an environment. If you get stuck on ideas, cling to hope or consume too much internet, you will soon learn how ineffective this is. The market is a great teacher but the lessons are often VERY EXPENSIVE.
Thank you for considering my analysis and perspective.

Intel - Stop the bleeding!Hello Traders and Investors, today I will take a look at Intel .
--------
Explanation of my video analysis:
In the beginning of 2023 Intel stock retested a multi year long horizontal structure at the $26 level. Here Intel created bullish confirmation and took off, creating a crazy rally of +100% within a couple of months. Then we saw a false breakout towards the upside which was followed by an incredible sell off. At the moment Intel is retesting support so we might see a short term short covering rally.
--------
Keep your long term vision,
Philip (BasicTrading)

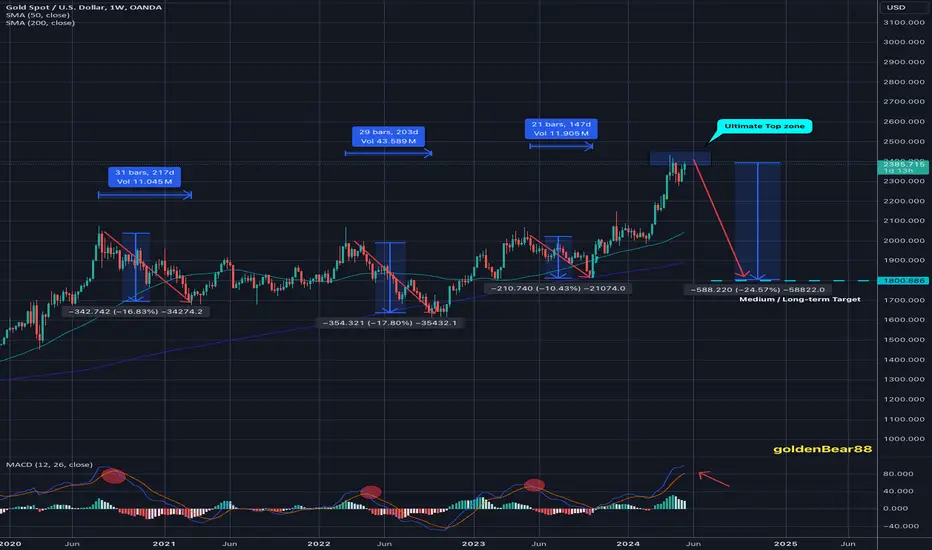
Multi-Month Bearish cycle ahead / #1,800.80 TargetGold's general commentary: As discussed, if Gold does not invalidate #2,452.80 - #2,500.80 psychological benchmarks in extension (Buying every Low's / less likely), I am expecting Gold to finish the Monthly fractal below #2,300.80 benchmark. Needless to mention, that would be Bearish for Gold’s Medium to Long-term (aligns with my Bearish expectations). On an Intra-day basis the only Trading opportunity exists only within the Hourly 4 chart’s Overbought levels, as I don’t see why I should allow additional risk of Selling Gold throughout Low Volume sessions such as current (many similarities with December #24 - December #25 fractal). I am expecting Gold to re-test #2,352.80 benchmark within #2-sessions if there aren't new DX Selling surprises.
Fundamental analysis: Cup and a Handle formation was delivered on Hourly 1 chart (visible even more on smaller charts), spike to the upside is delivered as I expect cool-down on Gold (even though CPI delivered unexpected forecast / numbers). Only reason what is keeping overall Bullish trend sustainable is DX taking strong hits on Daily basis. As High Interest rates are having very negative impact on world’s economy and individual population, DX is on a decline.
Technical analysis: Last #3 Weekly chart’s (#1W) MACD Selling signals brought approximately (# -15.80%) to (# -17.27%) declines in #140 to #160 sessions. MACD is about to deliver Long-term Selling signal and if one calculates (# -16.00%) decline from current Price-action, #2,000.80 psychological benchmark remains first Long-term Target (followed with #1,800.80 Selling extension of recent High's). Also if Monthly (#1M) chart is correct, every major / mega Bullish rally was aggressively corrected. If I take period from #2.000 Year to ATH’s in #2.011, Gold delivered (# +619.80%) rise, then delivered aggressive multi-Year decline until #2,015 Year. Since #2.015 Year, Gold was gradually soaring until #2.020 Year stagnation which was extended (made a Bullish breakout) on #2.023 Year towards recent record High’s (delivering (# +127.80%) rise. If this is eventual Top, I do expect Gold to continue it’s cycle of multi-Year struggling after delivering / fresh ATH’s at least #500-points ahead.
Advice to Traders since I am getting many inquiries lately: There is no secret. Trading is (especially Gold) taking certain Risks at certain times. If you're not aligning your strategy to the context, you will not get paid and will consequently lose money. Financial markets are ruled by Stochastic processes and most of what happens is beyond our control or understanding even, however can in turn represent serious source of income, especially on bigger levels (account sizes). #50% of Trading is Trading knowledge (day to day experience and fieldwork, Risk control, capital management) and second #50% is handling emotions and one’s psychology while understanding the broader context of the market and how to be appropriately positioned. Most importantly, Trading is a process, not an over-night success, so strong patience is required.
Momentum is picking up.After the release of the CPI data on Wednesday buying momentum is picking up in the S&P 500. The expectation is follow through to the upside but not a large move on Thursday.

SILVER TO $750 IN THE NEXT DECADE ?This has to be the biggest Cup & Handle Formation in Human History. Holy Smokes.
Ok, let's dive into the Fundamentals:
1) Industrial Demand: Silver is essential in various high-growth industries such as electronics, solar energy, and medical devices. As technological advancements continue, the demand for silver is expected to increase significantly.
2) Investment Demand: Economic uncertainty, inflation, or financial crises often lead investors to seek precious metals like silver as a safe haven.
3) Supply Constraints: Silver mining production may face challenges due to factors like depleted mines, increased extraction costs, or regulatory changes. Supply shortages can occur if production cannot keep up with demand, which will ultimately lead to a short squeeze.
4) Monetary Policy and Inflation: Central banks' monetary policies, such as maintaining low interest rates or implementing quantitative easing, can weaken currencies.
5) Green Energy Initiatives: The push for renewable energy sources, particularly solar power, relies heavily on silver for photovoltaic cells. As global efforts to combat climate change intensify, the demand for silver in green technologies is likely to rise, boosting its price.
(aka Agenda 2030 - The Great Reset)
What scares me about this chart is that it suggests terrible events are imminent.
The impact of these events cannot yet be measured, but they will be catastrophic for humanity.
Stay Safe and keep stacking as fast as possible, NFA!
CYANE

ON Semiconductor - betting on corrective UT rallyOn Semi conductor's selling has been weakened since Nov 23 and the larger falling wedge is pointing towards a larger bullish reversal pattern. First the cup and handle is close to a completion and will confirm the pattern once it breaks above US$72.84 resistance.
Volume is low but is a potential sign of accumulation. Long-term MACD is close to a bottom crossover. Stochastic Oscillator is oversold. 23-period ROC shows bullish divergence.
Hence will consider buying at spot or wait for pullback at 65.13 support. Target is at 79.85 and 98.54.

Nvidia Q1 25 earnings preview – will the Kraken awake?Due to report shortly after market close on 22 May (typically 06:20 AEST / 21:20 UK).
“The most important stock in the world” - That was the label given to Nvidia (NVDA) throughout February as we geared up for its highly anticipated Q424 earnings results. Where, at the time, the sheer number of articles written on the stock was incredible – when you are a momentum stock, you need this sort of attention to fuel the beast.
Since March though the hype has settled, and we see reduced news flow. In fact, we’re seeing an increasing number of articles directing traders away from Nvidia and towards other smaller names in the AI-semi space that could potentially see explosive moves.
With the momentum in NVDA falling away since Nvidia’s last earnings, and with Nvidia lacking a near-term catalyst, amid some concern of an over-supplied chips market, market players have moved their attention towards quality defensive areas of the equity market and value as an investment factor, with utilities, energy, and materials all seeing strong outperformance of late vs the S&P500.
We can also see this lack of momentum in NVDA’s technical set-up and price action, with shares rallying in a $205 range between $947 to $756, and now finding a fair value around $900. Traders remain buyers of pullbacks, where the trigger for long positions seems to be when the shares fall 10% below the 50-day moving average.
Nvidia may not be the hot topic it was in February, is that about to change?
For a short period, absolutely, with the eyes of the trading world falling once again on NVDA’s quarterly earnings.
The options market is pricing a -/+8.9% on the first day of trade after earnings (i.e. the 23 May), which if priced correctly, from current levels, could see the stock trade into new all-time highs or see it closer to $820. With a current market capitalization of $2.260t, an 8.9% move would equate to $200b in gained/lost market cap in one day, which would essentially be larger than the market cap of 82 companies in the NAS100.
We can also go back over the past 8 quarterly earnings announcements and that Nvidia has seen an average move of 8.5% on the day of reporting, with shares closing higher in 6 of the past 8 quarters.
Many will recall the Q424 earnings (reported in February), where the share price closed +16.4% on the day and went on to rally a further 23.4% over the following 11 trading sessions.
Earnings pedigree – few do it better
Let’s not forget that few companies globally have NVDA’s form at beating analysts’ consensus expectations on earnings-per-share (EPS), revenue, or gross margins. Perhaps the bar is perennially set too low, but NVDA has beaten expectations for revenue for the reporting quarter, as well as on expectations for the upcoming quarter, on all but two occasions since 2018: Q32019 and Q2 2023 being the exceptions.
In the past 4 quarterly earnings reports, NVDA has beaten guidance on sales for the upcoming quarter by an average of 14% - remarkable form, especially when they have a CEO (Jensen Huang) who knows how to hit the sweet spot and say exactly what investors want to hear in the post-earnings conference call.
Earnings expectations for Q1 2025 – will they beat yet again?
Q125 EPS – $5.51 (Q2 25 guidance expectations - $5.96c)
Q125 revenue - $24.58b (Q2 25 guidance expectations - $26.617b)
Data centres revenue - $20.903b (Q2 25 expectations - $22.567b)
Gross Margins – 77.01% (Q2 25 guidance expectations - 75.61%)
Recall in the prior earnings call CEO Jensen Huang suggested AI was at ‘a tipping point, which was a big topic of discussion. Given that NVDA only recently held its GTC conference in March and explored the future across multiple touch points, this time around traders will react on news that isn’t already discounted into the stock - growth opportunities, maintain its monopolistic qualities, levels of capex, and future partnerships.
Traders have found opportunities outside of AI-related semi and while many feel Nvidia lacks a near-term catalyst, the element of surprise is always there. The idea of ‘as goes Nvidia, as goes the market’ has dissipated, but it could make a return – and with big movement expected, this is a key event for equity and index CFD traders to have on the radar.

Gold Price (XAU/USD) Is Testing an Important Resistance ZoneGold Price (XAU/USD) Is Testing an Important Resistance Zone
On April 16, we wrote why the $2,380 zone is an important resistance area.
The XAU/USD chart shows that:
1) After fading fluctuations (they formed a narrowing consolidation triangle - shown in green), the price of gold dropped sharply (shown by a black arrow) on April 22-23.
2) Then, the price found support in the form of the lower border of the ascending channel (shown in blue), which has been in effect since the beginning of March. This led to the formation of another consolidation pattern between the blue lines.
3) An upward breakdown of the red lines on May 9 could be interpreted as an attempt by the bulls to resume the upward trend within the blue channel, but we could expect that the green triangle with its axis around 2380 would provide resistance.
However, it is important to pay attention to the nature of buyers’ behaviour when the price approaches an important resistance - the XAU/USD chart shows that the bulls’ persistence has quickly depleted. From the point of view of technical analysis of the gold price, a bearish engulfing has formed on the chart (shown by a blue arrow) in the area of 2380. In other words, the price of gold tested the resistance level, revealing the activity of bears defending their territory.
From the point of view of fundamental analysis, market participants can position themselves ahead of the key news for the beginning of the week: the CPI index will be published on Wednesday at 15:30 GMT+3.
But if economic or geopolitical news does not change the balance, in which, as we observe, the initiative is on the side of the bears, then this may create a threat of a breakdown of the blue channel’s lower border.
This article represents the opinion of the Companies operating under the FXOpen brand only. It is not to be construed as an offer, solicitation, or recommendation with respect to products and services provided by the Companies operating under the FXOpen brand, nor is it to be considered financial advice.

XAU/USD 13 May 2024 Intraday AnalysisH4 Analysis:
Bias/Analysis remains the same as analysis dated 12 May 2024.
-> Swing: Bullish.
-> Internal: Bullish.
Price has printed a bullish BOS.
After bullish BOS expectation is for price to pullback.
We have nested Daily and H4 supply levels where price is expected to initiate pullback.
CHoCH is positioned at quite a distance away from current price, therefore, there is a possibility price could engineer a CHoCH closer to current price to indicate initiation of pullback.
Previous intraday expectation dated 10 May 2024 was for price to continue bullish, react at nested Daily and H4 POI levels to start pullback phase which price is indicated as printing.
Intraday expectation: Price to continue bearish, react at discount of 50% EQ or H4 POI, both of which are closely positioned before targeting weak internal high.
H4 Chart:
M15 Analysis:
-> Swing: Bullish.
-> Internal: Bullish.
Price has printed a printed a bullish BOS and iBOS
After BOS we expect price to pullback.
First indication, but not confirmation of pullback initiation would be for price to print a bearish CHoCH which is denoted with a blue dotted line.
Intraday expectation dated 10 May 2024 was for price to react at nested Daily and H4 POI levels to initiate pullback, which price did.
Current Intraday expectation: Price to react at M15 POI, discount zone of 50% EQ or H4 POI before targeting weak internal high.
M15 Chart:

GameFi, Blockchain games, Top projectsGameFi
GameFi is a combination of gaming and decentralized finance that combines blockchain technology, NFT (non-flammable tokens), DeFi (decentralized finance), and the play-to-earn (P2E) model to create a unique gaming experience. This innovative approach lets players enjoy the game and earn real money through in-game actions and assets. At its core, GameFi uses blockchain technology to create decentralized gaming platforms where players have full ownership and control over their in-game assets. These assets, often represented as NFTs, can be exchanged or sold on NFT trading platforms, allowing players to monetize their gaming experience. DeFi is essential in GameFi by offering various financial services in the game ecosystem. Players can farm, bet, and provide liquidity, generating passive income while participating in the game.
The P2E model is a critical component of GameFi as it allows players to earn cryptocurrency or NFT by completing tasks, competing with other players, and advancing in the game. This model can potentially revolutionize the gaming industry by incentivizing players to invest time and effort into their gaming experience. GameFi projects often combine elements from different sectors of the cryptocurrency space, including tokens, DeFi, NFT, and the meta-universe, to create an immersive and rewarding gaming environment.
An example of how the economy works in GameFi through smart contracts:
The History and Evolution of GameFi
The history and evolution of GameFi is a fascinating journey marked by the innovation, growth, and merger of the gaming industry and decentralized finance. GameFi has seen significant milestones and key events that have shaped the industry from its inception to its current state. In the early days of GameFi, projects such as Axie Infinity and CryptoKitties introduced the concept of play-to-earn (P2E) games, where players could earn cryptocurrency by playing games and participating in the in-game economy. This was a revolutionary development as it allowed players to monetize their gaming experience in previously impossible ways. GameFi's development was also marked by introducing various innovative concepts and technologies. For example, integrating NFTs (non-game tokens) allowed players to own their in-game assets and trade them on NFT trading platforms. This added a new value and utility to the game as players could now buy, sell, and trade unique digital assets.
Another significant milestone for GameFi was the development of DeFi (decentralized finance) protocols in gaming ecosystems. This allowed players to farm, bet, and provide liquidity, providing new ways to generate passive income while playing. The "play-and-own" concept was also a critical development in GameFi, shifting the focus from just playing the game to owning and managing in-game assets. This has created a more engaging and rewarding gaming experience, where players play a more active role in the life and development of the games they play. Notable projects such as Legend of Arcadia, Panzerdogs, and CREO Engine have significantly shaped the GameFi industry. They have introduced innovations, partnerships, and technical advances that have pushed the boundaries of what is possible in gaming and decentralized finance. As GameFi continues to evolve, it faces challenges and growth hurdles, such as regulatory uncertainty and the need for more precise rules in the crypto-gaming space. However, the industry is also experiencing exciting developments, such as the integration of artificial intelligence, scalable second-tier solutions, and the emergence of new game genres.
GameFi market today
The GameFi market is experiencing significant growth and development as the number of active players and games continues to increase. In December 2023, there were more than 1 million active players in the GameFi sector. By April 2024, the number had grown to 3 million, representing a 300 percent growth in active users from 2023 to 2024.
This indicates a rapidly growing and engaging market with a projected increase in market size due to this user engagement trend! The GameFi sector had a market capitalization of $20.66 billion.
The market shows a diverse landscape in terms of user distribution across platforms and networks. For example, active games with the highest number of users in recent weeks include Sunflower Land ( NSE:SFL ), SecondLive ( NASDAQ:LIVE ), Planetix ($IXT), MOBOX ( AMEX:MBOX ), Tower Token ($TOWER), Crypto Unicorns ( LSE:RBW ), and others.
This wide range of active games across multiple platforms and networks indicates a healthy and competitive marketplace where users participate in different games and have different experiences.
Technology and tokenomics of GameFi projects
The technology and tokenomics behind GameFi projects are primarily driven by integrating blockchain, NFTs (non-gaming tokens), and smart contracts. This combination creates unique gaming experiences and economic incentives, revolutionizing the gaming industry.
Blockchain technology is the foundation of GameFi projects. It is a decentralized and distributed digital ledger that records transactions across multiple computers, providing transparency and security. This technology eliminates the need for intermediaries and central authorities, allowing players to own and control their in-game assets fully. Using blockchain in games also enables cross-game interoperability, where players can transfer assets from one game to another.
NFTs play an essential role in GameFi by representing unique in-game assets such as characters, weapons, and lands. Unlike fungible tokens such as Bitcoin or Ethereum, NFTs are unique and cannot be replicated, making them valuable and collectible. Thus, players gain ownership of their assets, which can be traded on NFT trading platforms. The value of NFTs can increase depending on their rarity and usefulness in the game, creating economic incentives for players.
Smart contracts - self-executing contracts whose terms are written directly into the code - allow you to automate various in-game processes. For example, smart contracts can create an in-game economy, manage assets, and reward players for completing tasks or participating in events. This enhances the game experience by providing players with a transparent and secure environment for economic activity.
Tokenomics, or the economic model of a GameFi project, is another crucial aspect of these projects. It involves creating and distributing tokens within the game ecosystem that can be used for various purposes, such as purchasing in-game items, bidding for rewards, or participating in management decisions. Tokenomics design plays a crucial role in incentivizing player participation and maintaining the long-term sustainability of the gaming economy. The combination of blockchain, NFT, and smart contracts in GameFi projects creates a new paradigm in the gaming industry where players have full ownership and control over their in-game assets, and economic incentives are integrated into the gameplay. This enhances the gaming experience and lets players earn real money for their in-game actions.
Gaming blockchains
Integrating blockchain technology into the gaming industry, known as GameFi, has revolutionized how players interact and how they are rewarded for playing time or achievements. The gaming industry has blockchains such as SKL, WAX, PORTAL, and VANRY. These are the leading gaming blockchains, each unique product with advantages and vast opportunities in the fast-growing GameFi sphere.
SKL
SKL is a blockchain designed to create high-performance dApps to provide zero-gas scaling for players and solve the problems of high transaction fees and slow transaction processing on the network. SKL allows developers to create unique games with instant transactions, which is a priority in game creation, as well as correct operation of smart contracts and improving the quality of gameplay through the speed of the exchange processes and receiving game objects in the game.
WAX
WAX is a specially designed blockchain for trading virtual items and digital collectibles, making it a popular and high priority for developers to create blockchain games and NFT markets. The WAX protocol allows in-game objects to be created, bought, and sold, providing a seamless way for gamers to monetize their gaming activity. In addition, WAX can interact with the Binance Smart Chain, making it possible to transfer NFTs between players on different blockchains.
PORTAL
PORTAL is a cross-chain gaming system that connects all games into a single WEB3 network and establishes a connection between blockchains. PORTAL is designed to simplify moving players between games using a single account, making the platform convenient and exclusive. The problem that this project addresses is the barriers related to the fragmentation of gaming ecosystems.
VANRY
Vanar Chain is a blockchain ecosystem designed explicitly for the games industry and intended to provide developers with tools and modules to facilitate the transition of games to Web3. A key feature of VANRY is its focus on direct integration with blockchain, which was a crucial factor in attracting Google Cloud. This capability allows established brands to master Web3 efficiently. The Vanar Chain ecosystem is also supported by NVIDIA, Phoenix Grounds Studio, and Revolut.
Promising projects in GameFi:
Mavia
The Heroes of Mavia project is a blockchain-based strategy game that allows players to compete in battles for cryptocurrency rewards while developing and improving their bases worldwide. Service Studios developed the game, which is set on an exceptionally designed island called Mavia.
One of the critical aspects of Heroes of Mavia is the ability to earn natural financial resources, mainly through the use of a cryptocurrency called Ruby. Players can collect Ruby and other valuable resources, such as Gold and Oil, which are essential to the gameplay. Integrating blockchain and Play-to-Earn (P2E) mechanics creates new opportunities for players to enjoy their favorite game and earn additional income. An NFT trading option also allows players to buy, sell, and exchange game assets such as Land, Heroes, and Statues. In addition, Heroes of Mavia is backed by Binance Labs, confirming the project's potential and prospects in the GameFi sector.
According to the vesting, most of the coins are still unlocked, and full unlocking for all users will come in November 2029. After researching the blockchain, 85.59% of the coins are locked and waiting to be unlocked in the wallets of investors, team members, and enablers. This implies that the project is focused on long-term investing, and investment funds will pump up the price closer to their full unlocks!
Overall, Heroes of Mavia is an innovative GameFi project that combines exciting gameplay, the ability to earn natural financial resources, and integration with blockchain to attract the attention of players and investors.
Shrap
Shrap is the first innovative blockchain-enabled FPS (First-Person Shooter) game developed on the Avalanche blockchain. The game allows players to buy, sell, and trade digital assets, including in-game items and characters. Shrap has caught the attention of investors and players due to its unique concept that combines elements of a classic FPS with blockchain capabilities. Players can earn rewards for participating in various in-game events and contests, allowing them to increase the value of their digital assets.
Sharp also allows users to create and sell user-generated content, which opens up new opportunities for players to express themselves creatively and create a sustainable economy within the game. Shrap has successfully raised $37.5M in funding, which confirms investors' interest in promising GameFi projects.
Over the past week, Wintermute has become more active and has started funding its own wallets on exchanges. This is a direct sign of the upward movement that will be provided by its software to manage the coin's market price! It is currently a great price to buy with the expectation of a long-term investment.
Karate
Project Karate is a groundbreaking platform that combines full-contact karate with CGI and Epic Games' Unreal Engine. It gathers top athletes, including Olympic medalists and national champions, who compete in various weight classes. Karate Combat uses blockchain technology to create a secure and innovative asset management and decision-making system. Users can earn rewards by playing various karate-related games and completing in-game challenges.
Within the game, the voting system allows one to earn and manage digital assets using the $KARATE cryptocurrency and influence the project's development.
Karate is also getting ready to move up soon. According to the latest significant transactions, Wintermute has received a sufficient portion to manage the price. It is also worth noting that the project team and their investors have more than 90% of the momentum issue concentrated on their asset wallets. This will make it relatively easy to manage the price of the coin!
Karate Combat successfully fuses sports and entertainment with blockchain, creating new opportunities for interaction between athletes, fans, and investors. Now is a good opportunity to buy this asset, as investors, enablers, and the team will add even more assets to their wallets and try their best to pump up the price for their future unlocks.
GMEE
GMEE is part of Animoca Brands, a major player in the blockchain-based gaming industry. It is backed by Binance Labs, which gives the project significant credibility. GMEE is a token to access and manage an entire gaming platform aimed at merging the world of gaming and decentralized finance (DeFi). It runs on a blockchain that allows players to earn, trade, and own digital assets with real value in a decentralized and more democratic manner.
One of the critical aspects of GMEE is its integration with the Telegram platform, making it the first Telegram Gamefi token. This allows for a large and active user base of over 1 million daily active users, which is a testament to the popularity and growth potential of the project. The fact that GMEE is Telegram's largest gaming community further emphasizes its importance in the GameFi space. In addition, GMEE aims to bring blockchain to millions of gamers through its mobile gaming platform. This approach makes blockchain technology more accessible to a broader audience, especially those new to cryptocurrencies and blockchain technology. By offering a seamless and convenient experience, GMEE can contribute to the mass adoption of blockchain gaming.
GMEE is a significant player in the blockchain-based gaming industry, backed by reputable organizations and offering a unique and accessible gaming experience. Its focus on mobile gaming and integration with the Telegram platform sets it apart from other projects in this field. Investors also have a large amount of circulating issuance, allowing them to manage the asset's price easily. The end of unlockings is coming in March 2025, just as we approach the top of the bull cycle (September 2025). It is worth considering for investment for no more than one year.
Conclusion
The GameFi market is projected to grow from $12.8 billion in 2023 to $126.3 billion by 2032 at % compound annual growth rate (CAGR) of 29.0%. This growth is attributed to the growing adoption of blockchain technology and increasing interest in blockchain-based games. Despite a decline in the number of new Web3-based game launches in 2023 compared to previous years, the market still shows high interest in blockchain-based game development, indicating a bright future for the sector.
Advancements in blockchain technology are expected to address scalability and efficiency issues, making GameFi platforms more accessible and user-friendly. The emergence of Layer 2 and Layer 3 solutions such as Polygon and Immutable X indicates a growing trend to improve user experience and attract more users from Web 2 games to Web 3 games. Moreover, the future of GameFi is characterized by a potential increase in institutional interest and the entry of established gaming giants into this space. This may lead to more complex games with better gameplay and sustainable economic models.
Nevertheless, challenges remain, such as the need to balance economic incentives and engaging gameplay and the ongoing problem of market volatility. Despite these challenges, GameFi's future looks promising, and significant growth and transformation are expected.
Best regards EXCAVO

2 weeks ahead of schedule...we are there.I think all magnitude is worked out. Hate to call it, but, it is time. See you all on the moon.
