Spy.. Where we standSoo... I will go in detail for you so you can see where my POV comes from..
A summary of this post is a bounce. Back to 525-530 and then a possible new low to 470..
Let's start on the monthly time frame..
I will show you the chart regular then I will show you log scale (Logarithmic).
AMEX:SPY regular
Price is nearing a 5yr trend support
That support is at 495-500. There's a gap at 495 to close from April 19th 2024.. I would say if we were to gap down Monday below 500.00 that's where they will take this before buying it back up to 510.
Now do I think the correction Is over here at this trendline support? I'm leaning at it's a 70% chance we will break this support before End of May.
Why? Because of the sectors.. XLC and XLF is promising more pain to come.. imagine Spy as a car, the sectors are the important parts to keep things in motion . I'll get to the sectors later but let's stick with spy..
Now here's a monthly chart again but this time Log scale
As you can see with exception of the Covid crash spy has pretty much channel traded this the last 14yr bull run
Let's zoom in
As you can see, the bottom of this channel is around 2021 high 477. So I think Spy is headed there before End of May , it could happen sooner but you have to factor in A rally and i don't know how long that can last.
Also NASDAQ:QQQ monthly chart log scale is showing similar outlook
Zoomed in NASDAQ:QQQ
Lastly TVC:NYA
Monthly log scale
Same as Qqq and spy, headed back to 2021 high
NYA no log scale
So I've showed you the indexes now I will show you AMEX:XLF (Financials) and AMEX:XLC (Meta, NFLX)
Here's XLF price is headed back to trendline support 38-39.00 by end of May; that's another 10% drop which supports my theory that spy will tag 470
Zoomed in
XLF
Monthly 50sma aligns with trendline support so that's your target. I think any bounce on banks going into earnings should be faded!
XLC
I can't hammer on the table hard enough about how much pain is coming for this sector and it's tech stocks.. compared to the other sectors this hasn't even got started with the selling when looking at its monthly RSI and MFI. Friday price stopped right at its previous ATH
we are headed back to 82.00 which is another 8% drop on this sector, if 82 doesn't hold them , 60 comes next.. If you OWN meta on NFLX I hope you have a 5yr outlook because there will be pain
..
Now let's get into the bounce, I think a nice bounce comes next week as long as spy opens Monday above 495.00
When it comes to being oversold one of the most reliable tools I like to use is the PRICE RANGE tool with 20sma.
When you look at spy, you'll notice that in a normal market it usually moves between 2½-3½% from it's 20sma.
As of Friday's close we are 10% away from it's 20sma
This type of extension is extreme
Below I will post the last time spy was over 8% extended from it's 20sma and you can see what happened the next few sessions
June 17th 2022
Jan 24th 2022
June 8th 2020
March 2020 Covid crash
Dec 2024 2018
So in the last 7yrs spy has on dropped more that 8% from it's 20sma 5 times and with the exception of the Covid crash 10% extension was the area where you saw price Rallied back within days to retest the 20sma.
So that places us bouncing this week. Now the 20sma is fluid so even though the 20 is at 559 right now depending on how long spy takes to get there the 20ma could gravitate lower
I think 536 gap close minimum comes before we break below 495.
I will update this more tomorrow.. this right up took awhile
Community ideas

SPX500 & Nasdaq: Confluence! Confluence! Confluence!With consumer confidence off at circuit breaking levels, the market, technically, has reached extreme levels of support. Let's look at it:
Technicals:
(1) Horizontal Levels of support
(2) 50%/61.8% fib confluence
(3) exDiv1
(4) extreme indicators
(5) Chikou span testing cloud support
(6) 28% drop is SPX
All of these levels are lining up around the same location. And just like in real estate "Location! Location! Location!" is the adage; in markets, "Confluence! Confluence! Confluence!" is the adage!

THE STOCK MARKET IS CRASHING!! IS THERE HOPE? (April 6, 2025)Lowkey I popped off in this video, but we looked at AMEX:SPY weekly and talk about past repeating patterns, and when this chaos could end

Is 5,700 the New 6,000?The S&P 500 has struggled recently, and some traders may see risk of further downside.
The first pattern on today’s chart is the three-day jump above 5,700 early last week. The move peaked around the January low of 5,773. It also represented a false breakout above the November low of 5,696.50.
In other words, two former support levels have emerged as new resistance.
It’s also reminiscent of the price action in January and February, when failure to hold 6,000 triggered selling.
Next, last week’s high occurred at the 200-day simple moving average. That may suggest the longer-term uptrend has ended.
Third, the 8-day exponential moving average (EMA) has remained below the 21-day EMA. That may indicate that a shorter-term downtrend has begun.
Finally, given the weakening momentum, traders may start eyeing longer-term levels for potential support. One potential spot could be the September low of 5,403, followed by the August trough of 5,119.
TradeStation has, for decades, advanced the trading industry, providing access to stocks, options and futures. If you're born to trade, we could be for you. See our Overview for more.
Past performance, whether actual or indicated by historical tests of strategies, is no guarantee of future performance or success. There is a possibility that you may sustain a loss equal to or greater than your entire investment regardless of which asset class you trade (equities, options or futures); therefore, you should not invest or risk money that you cannot afford to lose. Online trading is not suitable for all investors. View the document titled Characteristics and Risks of Standardized Options at www.TradeStation.com . Before trading any asset class, customers must read the relevant risk disclosure statements on www.TradeStation.com . System access and trade placement and execution may be delayed or fail due to market volatility and volume, quote delays, system and software errors, Internet traffic, outages and other factors.
Securities and futures trading is offered to self-directed customers by TradeStation Securities, Inc., a broker-dealer registered with the Securities and Exchange Commission and a futures commission merchant licensed with the Commodity Futures Trading Commission). TradeStation Securities is a member of the Financial Industry Regulatory Authority, the National Futures Association, and a number of exchanges.
TradeStation Securities, Inc. and TradeStation Technologies, Inc. are each wholly owned subsidiaries of TradeStation Group, Inc., both operating, and providing products and services, under the TradeStation brand and trademark. When applying for, or purchasing, accounts, subscriptions, products and services, it is important that you know which company you will be dealing with. Visit www.TradeStation.com for further important information explaining what this means.

ETHEREUM at Major Support: Bullish Rally Incoming?COINBASE:ETHUSD is on the verge of a major move. The price has reached a key support level that has historically triggered strong buying interest. This zone has acted as a demand area multiple times, increasing the likelihood of a bullish reaction if buyers step in once again.
The market structure suggests that a confirmed bounce from this level could ignite a significant recovery. If bulls hold the support, the first upside target is $2,400, which represents a logical target for this setup. However, a sustained breakout beyond $2,400 could mark the beginning of a stronger rally, fueled by renewed buying momentum and increasing volume.
Given the prolonged bearish move leading into this setup, a retracement here could turn into a larger trend shift. However, a clean breakdown below support would invalidate this bullish bias and open the door for further downside.
🚀 If this rally takes off, we could see COINBASE:ETHUSD reclaiming higher levels in the coming weeks. What are your thoughts? Drop them in the comments! 🚀

Pandemic darling now at DEEP value Zoom who was a big beneficiary of the pandemic but unlike other stay at home stocks, this one actually makes money. I think a markup phase has begun and I am currently long, UNLESS there's a break of recent lows and the 200d SMA.

Alibaba - Don't Forget Chinese Stocks Now!Alibaba ( NYSE:BABA ) still remains super interesting:
Click chart above to see the detailed analysis👆🏻
After we saw the very expected parabolic rally on Alibaba about four months ago, Alibaba is now perfectly retesting major previous structure. Yes, we could see a short term pullback in the near future but this just offers a perfect break and retest after the rounding bottom pattern.
Levels to watch: $110, $140
Keep your long term vision,
Philip (BasicTrading)

GameStop’s Bitcoin Bet Fails to Wow Traders. Can It Copy MSTR?GameStop NYSE:GME wants to jam Bitcoin BITSTAMP:BTCUSD into its treasury. But isn’t that a risky move that threatens to derail the video-game retailer’s finances? With $1.3 billion on the line, GameStop’s pivot to Bitcoin in efforts to revive its flagging share price may make things even worse. Let’s talk about that.
Desperate times call for desperate measures. After a couple months of speculation, traders’ suspicions turned out correct — GameStop is indeed adding Bitcoin on its balance sheet .
The company confirmed the plan in its quarterly earnings update released last week. That was all good — shares jumped 8% on the news and closed the cash session higher by 12%.
But these solid gains were not only wiped out — traders doubled down on the selling pressure when the shares crashed 23% a day later because GameStop unveiled a scary figure.
To make Bitcoin a treasury reserve asset, GameStop said it is seeking to sell $1.3 billion of convertible bonds , which will be used “for general corporate purposes, including the acquisition of Bitcoin in a manner consistent with GameStop’s Investment Policy.”
What do these convertible bonds do? They’re essentially papers that certify you’ve given the company a loan. Usually, they come bearing some nice guaranteed yield, but in this case, the yield is exactly 0.00%.
Another string attached to GameStop's bonds is that they are due in 2030 and you can choose to convert them into shares, each with a price tag of $28.46, or you can take them out in cash. That’s one reason why the stock tanked last week — not too favorable conditions.
Another one, and perhaps a bigger worry for investors, is that GameStop’s net income will no longer be as secure as it’s been until now. More precisely, GameStop generates around $220 million in interest each year thanks to its holding of Treasury bills.
With Bitcoin getting in the mix of factors contributing to the bottom-line figure, things may spin out of ordinary. True, Bitcoin may go up in price and lift GameStop’s net income but it could also decide to nosedive for no reason and eat into GameStop’s profits.
Judging by the votes of the traders last week (if the stock market is a voting machine in the short term), they seem to believe in the latter. At least for now. But that's not a concern to the OG meme stock . Where it hopes Bitcoin will make a difference is the long run. Just look at MicroStrategy MSTR .
Strategy, formerly known as MicroStrategy , is the world’s largest corporate Bitcoin holder. Even more, it’s a Bitcoin hoarder, sitting on more than 506,000 Bitcoin, according to BTC-tracking platform Bitcoin Treasuries .
Strategy has been issuing debt to buy Bitcoin since 2020 and that’s the exact same thing that GameStop is doing. But there’s a key difference. Strategy has largely strapped its share price to the performance of Bitcoin. So much so that the market has been feverishly buying the stock as a way to get exposure to Bitcoin (on steroids). For GameStop, it’s too late for that.
Shares of Strategy are trading at less than 2x the value of its Bitcoin holdings.
GameStop, in contrast, has appealed to investors for its stack of cash (besides the speculative bonanza) with $4.8 billion in dry powder ready to be deployed. The stock is trading at more than 2x its cash holdings and the cash-to-Bitcoin conversion is likely to dent that performance and trigger some outflows. And that’s how the company puts its premium at risk.
So is it safe to say that GameStop is looking to spark a share-price rally by following MicroStrategy’s lead? Maybe. But the exposure to Bitcoin also comes at a perilous time for the cryptocurrency industry. Bitcoin is down 10% on the year and more than 25% from its all-time high of $109,000 to hover around $84,000 a pop.
Can the Bitcoin philosophy reel GameStop out of the slump? Or will it drag the bottom line and chip away at whatever’s left of the bruised valuation under $10 billion? You be the judge — share your thoughts in the comment section!

Can Gold still break upward?- Gold prices just hit a record high, soaring past $3,085 per ounce in March 2025. That’s not just a number—it’s a warning sign. Investors aren’t piling into gold for no reason. They’re reacting to a world that feels more uncertain by the day.
- The U.S. has imposed heavy tariffs on Canada, Mexico, and China, triggering trade tensions that are shaking global markets. Inflation is still higher than expected, climbing to 2.8% in February, making traditional investments riskier. At the same time, the U.S. dollar is weakening, and Treasury yields are dropping, pushing investors toward gold as a safe bet. Add to that ongoing conflicts in the Middle East and rising tensions between Russia and Ukraine, and it’s no surprise that gold is surging. Every new crisis just makes it more attractive.
This isn’t just a temporary spike. Experts warn that the worst effects of these trade policies haven’t even hit yet, and if inflation keeps climbing, the global economy could be in for a rough ride. Gold isn’t just going up—it’s flashing a warning. It’s telling us that investors don’t trust what’s coming next. And if history is any guide, they might be right.

BRBR Power Bar and Protein Shakes Shakin' It UP!Fundamentals:
Meets my parameters for investing long-term.
Technicals:
Daily:
ExDiv1
Triples
161 extension, equal legs and weekly key fib meeting at the same spot (confluence)
New Crown high formed on the daily
Weekly:
uHd+hammerw/ d3 volume @ key fib pullback
morning star
Met monthly average range
Kijun signal
extreme indicator
Target 140 (tentatively), but will hold forever if I possible
Tentative rethinking point to buy more investment if it falls is about 48.

BTC- Weekly Analysis: Elliott Wave ProjectionThis analysis applies Elliott Wave Theory using ghost candles to project potential future price movement for BTC/USDT Perpetual on Pionex.
Wave Structure: Completed (W)-(X)-(Y) correction followed by a speculative (A)-(B)-(C) correction using ghost candles.
Key Levels: Support at $110,791.5 (trendline), Resistance at $140,454.5.
Volume Confirmation: Low volume (154.4K) confirms the projected wave is speculative.
Forecast: If price respects the trendline, the next impulse wave could reach $140,454.5. A breakdown could target $73,238.2.

Bitcon On Track For 73.3K - Daily BreakdownBy now it's fairly obvious we've entered a bearish market. From a peak of 109k to now 82k this is hard to argue. We can view our earning moving average data with the red(10day), blue(20day), and yellow(50day) to see the candles are well below all levels. The most important level on the bearish confirmation is the 50 day EMA cross. This is known as a 'death cross'. When price crosses below the 50 day EMA price historically will continue to decline.
Our second major confirmation to enter short is by looking at lower Support zones for price. Looking at price to the left there are long periods from 73.3k to 87k where price action took off very rapidly with zero consolidation.(side ways market action). This means when price comes back down as it is there are zero support levels(as in the orange box) until 73.3k.
73.3k was previously a resistance level(where price did not go above) four times as in circled. These levels will now become a support zone for buying liquidity.
I do believe this bearish market will be much different than previous years. It will be a much more drawn out process with less typical overall volatility. This is due to the increase in the market cap is much higher than before. That being said the major confirmations based upon EMA data and zero support levels make this overall trend very clear.
Don't be stupid NEVER trade against the trend! Do not except price to snap to target over night either. This is a daily view on the overall direction of BTC and is not a short term trade. We should except price to decrease overall, but remember the market increase and decrease in 'waves'.

NASDAQ Supercycle — Welcome to the Age of Global DistributionOn the long-term chart of NASDAQ:NDX IG:NASDAQ , we are likely in Wave IV of the Supercycle, which appears to be unfolding as a running flat (rFL). The current decline may not be a mere correction, but a motive Wave C, potentially retesting the 2021 ATH zone (around 16,500–17,000) before a powerful new bullish wave begins.
Volume spikes at the top confirm the phase of global distribution, with institutional players gradually locking in profits and reducing exposure.
🧩 Base Scenario:
- We are in the final Wave C within the rFL structure.
- Once complete, a strong Wave V rally may follow.
- Key support zone: around the 2021 all-time high.
🧪 Alternative Scenario:
- This could be part of an extended Wave III of the Supercycle.
- Even so, a significant correction is expected in the near term before the next leg higher.
Structural Drivers for Long-Term NASDAQ Growth:
- 📉 Monetary policy easing from the Fed
- 💵 Fiat currency devaluation
- 🤖 Tech innovation boom — AI, biotech, semiconductors, Big Tech
- 🌍 Global digital transformation
- 🏦 Asset repricing amid structural macro shifts
📌 In conclusion, NASDAQ CME_MINI:NQ1! is entering a period of heightened volatility and capital redistribution — but its long-term upside potential remains intact.

SPY, QQQ, BTCUSD, TSLA & PLTR Daily Trade SetupsIn this update we review the recent price action in the SPY, QQQ, BTCUSD, Tesla & Palantir and identify the next high-probability trading opportunities and price objectives to target. To review today's video analysis, click here!

Bear Flags on Multiple Timeframes (Look out below!)Showing bear flags on multiple timeframes -- the technical setup is a popular one for a reason--it often does as you would expect.

Huge Buy for Gold XAUUSD (Trump announces tariffs of up to 25%)How Trump’s 25% Auto Tariffs Could Be a Huge Buy Signal for Gold
The proposed 25% tariffs on automobile imports to the U.S. by former President Donald Trump could have significant economic consequences, many of which could drive gold prices higher. Here’s why:
1. Trade War Fears and Market Uncertainty
A new wave of tariffs could escalate tensions with key trading partners, particularly the European Union, Japan, and South Korea, leading to retaliatory tariffs and a potential global trade war.
Uncertainty in global trade historically increases demand for gold as investors seek a safe haven from market volatility.
2. Higher Inflation and Rising Costs
Tariffs would increase the price of imported cars, leading to higher inflation in the U.S.
Rising inflation typically weakens consumer purchasing power and drives investors toward gold, a traditional inflation hedge.
3. Economic Slowdown and Risk of Recession
Automakers and suppliers may cut jobs or reduce production, impacting economic growth.
A slowing economy could trigger rate cuts from the Federal Reserve, which would lower bond yields and make gold even more attractive as a non-yielding asset.
4. Pressure on the U.S. Dollar
Trade conflicts can destabilize the U.S. dollar, especially if major economies reduce reliance on U.S. exports or retaliate with their own tariffs.
A weaker dollar increases the price of gold, as gold becomes cheaper for foreign investors.
5. Central Bank Demand and Gold Accumulation
If economic uncertainty rises, central banks may increase gold reserves, further boosting demand.
We’ve already seen major central banks accumulating gold at record levels, and new trade disruptions could accelerate this trend.
Conclusion: A Strong Bull Case for Gold
If Trump’s 25% auto tariffs take effect, they could trigger inflation, market volatility, and economic slowdown, all of which are bullish for gold. With central banks buying aggressively and rate cuts likely on the horizon, this could be a major buying opportunity for gold traders.
Would you buy gold in this scenario? Let me know in the comments! 🚀

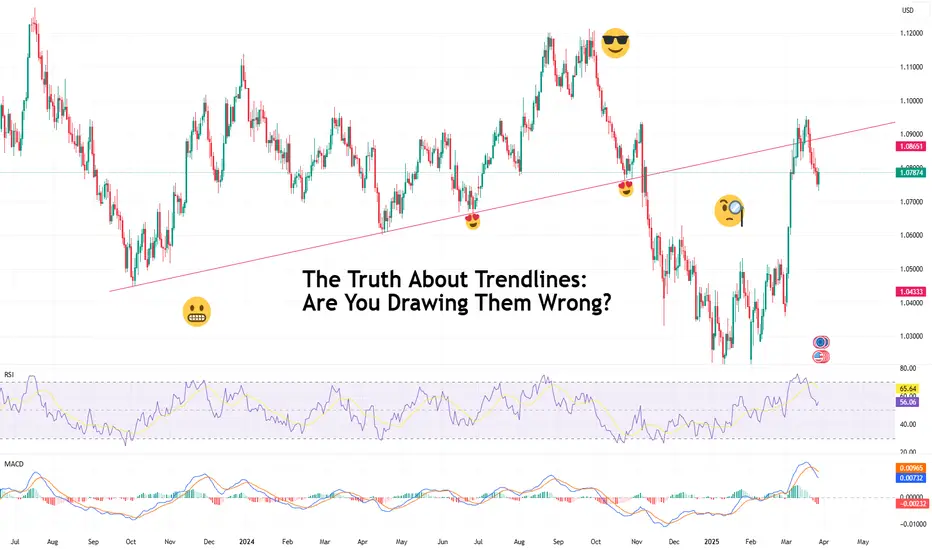
The Truth About Trendlines: Are You Drawing Them Wrong?If your trendlines look like a toddler took a crayon to your chart, we need to talk. Or if you draw them so much that your chart looks like a spider web, we still need to talk.
Trendlines are one of the most abused, misinterpreted, and downright misused tools in technical analysis. Used correctly, they can give you a structured view of market direction, potential reversals, and areas of interest.
Used incorrectly? Well, they can be your fast lane to bad trades, broken accounts, and questioning your life choices.
So, are you drawing them wrong? Let’s find out.
📞 A Trendline Is Not Your Emotional Support Line
This is big because it happens virtually every day across the charts. When a trade is going south, it’s tempting to adjust your trendline just to make your setup look valid again. That’s not technical analysis—that’s denial. A proper trendline should connect clear pivot highs or lows, not be forcefully manipulated to fit a bias.
Traders do this all the time. Price action no longer respects their original line, so they just… move it. As if shifting the goalposts somehow changes reality. It doesn’t. If your trendline gets broken, respect the price action and get out, don’t adjust the line because you risk dragging your account deeper in losses.
🤝 Two Points Make a Line—But Three Make It Real
Here’s where most traders mess up. They draw a trendline the moment they see two points connecting. Sure, two points technically make a line, but two random highs or lows do not make a valid trend.
A legitimate trendline should be tested at least three times to confirm that price actually respects it. Until then, it’s just a hopeful hypothesis. But we gotta give it to the early spotters — yes, if you see two points, pop open a trade and it pans out nicely, then you’ve chomped down on the good grass before the other animals.
The more times price touches and respects the trendline, the stronger it is but the risk of it getting overcrowded increases. Anything less than three touches? You’re basically trading off a hunch with a potentially higher risk-reward ratio.
⚔️ Wicks, Bodies, or Both? The Great Debate
Should you draw trendlines through candle wicks or just use the bodies of the candlesticks ? If you’ve spent any time in trading communities, you’ve probably seen this debate get heated enough to break friendships.
Here’s the deal:
If you’re trading short-term price action, drawing trendlines using candle bodies makes sense because it reflects where most of the market agreed on price.
If you’re looking at major trends, wicks matter because they show extreme liquidity zones where prices actually reached before snapping back.
⛑️ Steep Trendlines Are a Disaster Waiting to Happen
If your trendline looks more like a vertical cliff than an actual slope, you might want to reconsider its validity. The steeper the trendline, the less reliable it is.
A proper trendline should represent a natural flow of zigging and zagging price action. If it’s moving up too aggressively, it’s usually unsustainable. That’s why parabolic runs tend to end with painful crashes—what goes up too fast typically comes down even faster.
If your trendline is forming an angle sharper than 45 degrees , be careful. Sustainable trends don’t need a rocket launch trajectory to prove their strength.
🌊 One Chart, One Trendline (or Two)—Not Ten
Some traders draw so many trendlines that their charts get lost under the weight of too many lines. If you need to squint to see price action through the mess of lines, you’re doing too much.
Here’s a golden rule in drawing trendlines: less is more. Trendlines should highlight key structures, not overwhelm you with information. If you find yourself drawing trendlines at every minor high and low, take a step back. A clean chart is a tradable chart and one or two trendlines are usually enough to help uncover price direction.
🚩 Breakouts Aren’t Always Breakouts
One of the biggest mistakes traders make is assuming that when the price breaks a trendline, it’s an instant reversal signal. It’s not.
Markets (or well-trained algos) love to fake out emotional traders. Just because price dips below your uptrend line doesn’t mean the trend is over—it could just be a temporary pullback or liquidity grab (stop-loss hunting?) before continuing in the original direction.
Always wait for confirmation. A proper breakout should come with:
Increased volume (to validate the move)
Retest of the broken trendline (flipping from support to resistance, or vice versa)
Clear follow-through (not just a single candle wick that breaks and snaps back)
The market loves tricking traders into premature entries or exits. Don’t fall for it—instead, use some technical backup like looking for a double top, a head and shoulders or some other popular chart pattern .
☝️ The Only Trendline That Matters? The One The Market Respects
At the end of the day, trendlines are just tools—guides to help you structure price action. They’re not magical indicators. They don’t necessarily predict the future. They simply help visualize market tendencies.
If price constantly breaks through your trendline and ignores it, guess what? It’s not a valid trendline. The best traders don’t force a narrative—they adjust their view based on what the price is actually doing.
So next time you find yourself drawing, adjusting, or forcing trendlines into existence, ask yourself: Am I analyzing the market, or just trying to make myself feel better? Because the market isn’t wrong—so better check your trendlines twice.
Now off to you—are you using trendlines in your charts and do you wait for the third point to connect before moving in? Share your experience in the comment section!
Be the Choosy trader on Gold!Price is dragging on dropping. being very indecisive. Looks like the entire market is waiting on News to help give it a push. I need to see price break out of value before I can get a read on a sold move. in the mean time this is sclaping conditions. You can hold trades. Have to cut them short quick with this price action. Since we have some USD news tomorrow that indicates that the market might be waiting for that before proceeding on any decisions. Patience is key!

Nikkei short update: Short again for 3rd or C waveUpdated the wave counts for the down move and the subsequent move up. I believe we are going into a wave 3 (or C). So it is a good opportunity to short again.

NFLX & chilling until...Earnings. I have been bearish on this stock technically. Currently it is floating within the Bollinger Bands. Today (3/26) was pretty bearish on the market overall. I read that NFLX will be raising rates or creating alleged value within its ad tiers. I like commercials, so I'll keep watching them lol. Anyways... I just know that people will be affected by loss of jobs/income. NFLXing may not be top of mind for many. I also hear rumors of a stock split. That would be great. & if it happens, I'll still be looking for pullbacks. Will see how week and month close. Earnings 4/17.
***Side note... I remember when the original CD business launched during my college days. Oh how I wish that I was investor savy at the time. Sigh... Looking forward to earning some moolah on my trade ideas now.

AUDUSD triangle pattern suggests a big move is comingAUDUSD has been consolidating in a triangle pattern, suggesting a breakout is near—likely within weeks. A bullish breakout could target 0.6393, with potential for a 229-pip move. A bearish break is also possible but less clear. The setup offers strong risk-reward, with examples showing a 5.6x ratio.
This content is not directed to residents of the EU or UK. Any opinions, news, research, analyses, prices or other information contained on this website is provided as general market commentary and does not constitute investment advice. ThinkMarkets will not accept liability for any loss or damage including, without limitation, to any loss of profit which may arise directly or indirectly from use of or reliance on such information

Tips for Corrections & Dips with TradeStation: TradingView ShowJoin us for an insightful TradingView live stream with David Russell, Head of Global Market Strategy, as we dive deep into the latest market developments, including potential crashes, corrections, and the upcoming Federal Reserve announcement. We'll cover it all, LIVE!
In today’s session, we’ll explore the critical factors shaping the market landscape and how you can leverage the TradingView platform to stay ahead. Plus, we’re excited to share a major update to our broker integration with TradeStation, which opens up new trading opportunities and provides expanded options for your portfolio strategy.
TradeStation, a fintech leader since 1982, has built a reputation for providing institutional-grade tools, personalized services, and competitive pricing to active traders and long-term investors alike. Known for their innovation and reliability, TradeStation remains a trusted partner in navigating volatile market conditions.
For the first time, we've expanded our integration with TradeStation to include equity options trading directly on TradingView. This new feature complements our recently launched options trading suite, featuring tools like the strategy builder, chain sheet, and volatility analysis, helping you make informed decisions, especially in light of potential market corrections.
This session is sponsored by TradeStation, whose vision is to provide the ultimate online trading platform for self-directed traders and investors across equities, equity index options, futures, and futures options markets. Equities, equity options, and commodity futures services are offered by TradeStation Securities Inc., member NYSE, FINRA, CME, and SIPC.
www.tradestation.com
www.tradestation.com

AMD stock up over 20% off the lows- outperform NVidia?AMD is still cheap relative to its growth and still way down from all time highs.
Seeking alpha analysts expect 25-30% annual growth in earnings yearly. The stock is still in the low 20s PE. Stock can double and still be a good business worth owning for the long term and let compounding earnings work.
Low rsi and bollinger bands gave us the signal to buy, we bought with leverage, now we are in the shares unlevered.
Target would be all time highs over the next 2-3 years.
