TradingView Show: New Trade Ideas and The Leap TradeStationJoin us for a timely TradingView live stream with David Russell, Head of Global Market Strategy at TradeStation, as we break down the latest rebound in the markets and what it could mean for traders and investors. In this session, we’ll dive into:
- The upcoming Fed meeting and what policymakers might signal heading into the second half of the year
- Why the 10-year yield nearing 4.5% is important — and how to set alerts to stay ahead of key moves
- Summer trading strategies to navigate slower market conditions and spot emerging opportunities
- A closer look at Latin American equities, with names like Mercado Libre in focus
- The surprising strength in stocks that have doubled since the tariff-driven selloff
- How energy and oil markets are reacting to renewed geopolitical tensions in the Middle East
- And other trends that are shaping the broader investment landscape
Whether you're trading short-term setups or planning longer-term plays, this session will give you fresh insights and practical takeaways to help you stay prepared and informed through the summer months.
Bonus: Discover our latest broker integration update with TradeStation—now supporting equity options trading directly on TradingView. This upgrade brings advanced tools like the strategy builder, options chain sheet, and volatility analysis to your fingertips, making it easier to trade through uncertain market conditions.
This session is sponsored by TradeStation, whose vision is to provide the ultimate online trading platform for self-directed traders and investors across equities, equity index options, futures, and futures options markets. Equities, equity options, and commodity futures services are offered by TradeStation Securities Inc., member NYSE, FINRA, CME, and SIPC.
Disclosures from TradeStation:
tradestation.com/insights/etf-disclosures/
tradestation.com/important-information/
Community ideas

Major resistance ahead?The Aussie (AUD/USD) is rising towards the pivot which has been identified as an overlap resistance and could reverse to the 1st support.
Pivot: 0.6512
1st Support: 0.6466
1st Resistance: 0.6545
Risk Warning:
Trading Forex and CFDs carries a high level of risk to your capital and you should only trade with money you can afford to lose. Trading Forex and CFDs may not be suitable for all investors, so please ensure that you fully understand the risks involved and seek independent advice if necessary.
Disclaimer:
The above opinions given constitute general market commentary, and do not constitute the opinion or advice of IC Markets or any form of personal or investment advice.
Any opinions, news, research, analyses, prices, other information, or links to third-party sites contained on this website are provided on an "as-is" basis, are intended only to be informative, is not an advice nor a recommendation, nor research, or a record of our trading prices, or an offer of, or solicitation for a transaction in any financial instrument and thus should not be treated as such. The information provided does not involve any specific investment objectives, financial situation and needs of any specific person who may receive it. Please be aware, that past performance is not a reliable indicator of future performance and/or results. Past Performance or Forward-looking scenarios based upon the reasonable beliefs of the third-party provider are not a guarantee of future performance. Actual results may differ materially from those anticipated in forward-looking or past performance statements. IC Markets makes no representation or warranty and assumes no liability as to the accuracy or completeness of the information provided, nor any loss arising from any investment based on a recommendation, forecast or any information supplied by any third-party.

Bitcoin - Trend Shift Confirmed, Eyes on $102.8K LiquidityMarket Context
Bitcoin showed signs of exhaustion after a strong short-term rally within a clean upward channel on the 1H chart. Price action had been respecting the trend structure until a key deviation occurred near $108,500, where we saw an internal liquidity sweep that hinted at potential distribution.
Fake-Out Confirmation and Shift in Momentum
After taking out local highs around $108.5K, price failed to continue higher and instead reversed sharply, confirming the sweep as a classic fake-out. This kind of internal liquidity grab is typically used to trap breakout buyers before reversing and targeting previous lows.
Break of Structure and Channel Retest
The rising channel was broken convincingly, and price has now retested the underside of the channel, aligning with the 50% equilibrium of the entire high-to-low range. This reinforces the bearish bias and suggests the market has likely shifted from accumulation to distribution.
Downside Targets and Key Levels
Immediate support sits around $104.6K, which served as a consolidation base during the earlier run-up. If this level fails to hold, the next key target would be a sweep of the previous significant low at $102.8K. This area is marked as a point of interest and could offer a reaction or reversal.
Price Expectations and Trade Outlook
As long as price remains below the broken channel and under $107K, the bearish scenario remains in play. I’m watching for bearish continuation into $104.6K first, and a potential full sweep toward $102.8K if that support fails.
Conclusion
The internal sweep followed by impulsive rejection, combined with a clear channel breakdown and retest, shifts the bias to bearish. A move into the $104.6K region seems probable, with a lower liquidity target at $102.8K in sight if downside pressure accelerates.
Disclosure: I am part of Trade Nation's Influencer program and receive a monthly fee for using their TradingView charts in my analysis.
___________________________________
Thanks for your support!
If you found this idea helpful or learned something new, drop a like 👍 and leave a comment, I’d love to hear your thoughts! 🚀

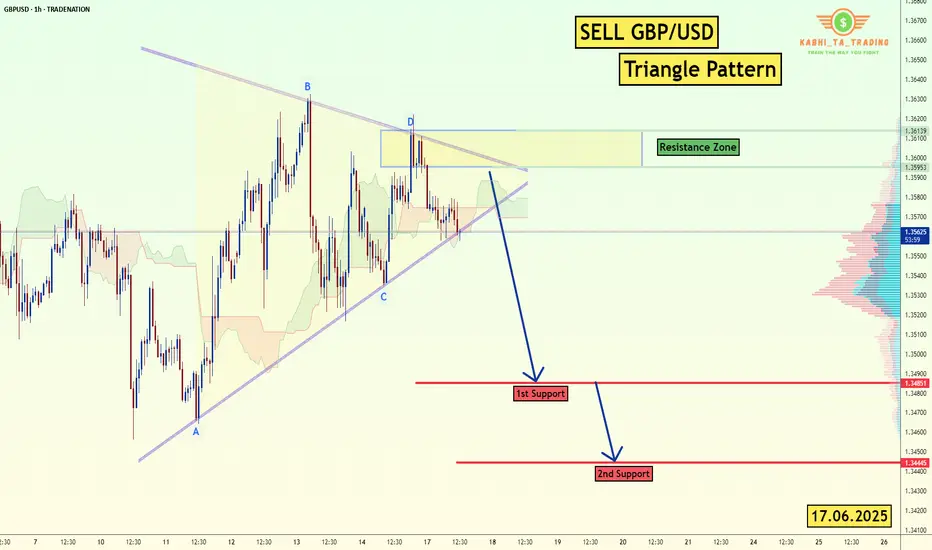
GBP/USD - H1-Triangle Breakout (17.06.2025)The GBP/USD Pair on the H1 timeframe presents a Potential Selling Opportunity due to a recent Formation of a Triangle Breakout Pattern. This suggests a shift in momentum towards the downside in the coming hours.
Possible Short Trade:
Entry: Consider Entering A Short Position around Trendline Of The Pattern.
Target Levels:
1st Support – 1.3485
2nd Support – 1.3444
🎁 Please hit the like button and
🎁 Leave a comment to support for My Post !
Your likes and comments are incredibly motivating and will encourage me to share more analysis with you.
Best Regards, KABHI_TA_TRADING
Thank you.
Disclosure: I am part of Trade Nation's Influencer program and receive a monthly fee for using their TradingView charts in my analysis.
Weekly Market Outlook: FOMC, Trade Deals and GeopoliticsIt is a holiday-shortened week, with the majority of markets halting early on Thursday, June 19, 2025, in observance of Juneteenth. See here for holiday trading schedule
Key Themes to Monitor This Week
Geopolitical Risks
Any outside intervention in the ongoing Israel-Iran conflict will likely be seen as a risk-off event by market participants. Despite Friday’s sell-off, markets shrugged off during the Sunday open and overnight sessions.
There are potential risks to trade routes and energy infrastructure, although disruptions seem unlikely at the moment. Amena Bakr at Kpler noted that, so far, there are no signs of disruptions in oil loadings from Iran. Without a supply outage, there is no pressing need for additional barrels to be brought onto the market.
Trade War and Trade Deals
There have been recent developments with the U.S. reaching key trade deal milestones with several countries. The baseline scenario remains optimistic, with expectations for an extension in negotiations and potential reciprocal tariffs for countries failing to reach agreements.
FED Week
This is a key week for U.S. monetary policy, with the FOMC decision, Summary of Economic Projections (SEP), and Chair Powell’s press conference scheduled.
Traders will be closely watching how the Fed’s inflation and growth expectations have evolved, as reflected in the SEP. All eyes will be on the dot plot to note how interest rate expectations have evolved since last quarter. Of note: Will President Trump’s continued calls for rate cuts influence Chair Powell’s tone or guidance?
Expectations for the Week Ahead
NQ futures have continued one-time framing higher, consistently creating higher lows since the week of April 21, 2025. A strong support zone exists below, anchored at the yearly Volume Point of Control (VPOC) and the Anchored VWAP from May 11, 2025, when markets gapped higher.
Key Levels to Watch
• yVAH: 22,690.50
• R2: 22,510
• R1 / Previous Week High: 22,322.50
• May 11 AVWAP: 21,672.25
• yVPOC: 21,660
Scenario 1: Market Grinds Higher but Stays Cautious
Despite several looming risk factors, the market could continue to grind higher. In this scenario, we anticipate a test above the prior week's high, followed by a potential pullback into last week’s range.
Example Trade Idea 1
• Entry: 22,000
• Stop: 21,930
• Target: 22,322
• Risk: 70 pts
• Reward: 322 pts
• Risk-Reward Ratio: 4.6R
Scenario 2: Pullback to Support, Range-Bound Consolidation
If the market pulls back, we expect the yearly VPOC and AVWAP from May 11 to act as key support levels. In this case, price action may remain range-bound within the previous week’s range, forming an inside week.
Example Trade Idea 2
• Entry: 21,672
• Stop: 21,600
• Target: 22,000
• Risk: 72 pts
• Reward: 328 pts
• Risk-Reward Ratio: 4.6R
________________________________________
Glossary
• VPOC: Volume Point of Control
• VA: Value Area
• VAL: Value Area Low
• VAH: Value Area High
• VP: Volume Profile
• AVP: Anchored Volume Profile
• Y: Yearly
• pWk: Previous Week

Meta & Microsoft: How Two Tech Titans Outran a Sinking Mag 7Forget about the Magnificent Seven and say hello to M&M — the only two winners of the year so far.
If you blinked during the first half of 2025, you might’ve missed it: the mighty Magnificent Seven are starting to look more like a Scraggly Five. While Tesla NASDAQ:TSLA fumbled its autonomy narrative and Apple NASDAQ:AAPL spent more time designing slides for the WWDC than in keynotes, two names quietly did the thing — created shareholder value.
Meta NASDAQ:META and Microsoft NASDAQ:MSFT
Both are up more than 13% year-to-date each, sitting comfortably at the top of the gains leaderboard. For comparison: Nvidia managed just 3% (and that’s with all the AI hype), and everyone else? Down. Flat. Or just ghosted by Wall Street. The iPhone maker? How’s 20% to the downside?
Let’s break down how Meta and Microsoft dodged the selloff.
📞 Meta: Not About That Meta
Meta NASDAQ:META came into 2025 like it had something to prove. Zuck had long gone full avatar with the metaverse. But now? Now he wants to win AI — and he’s putting his money where his data is. Meta’s latest foray into AI is a $14.3 billion investment into Scale AI.
A 49% non-voting stake in the AI darling isn’t for fun — but for function. It’s a full-court press to close the Llama-size gap between Meta’s in-house models and the heavyweights like OpenAI and Anthropic.
Scale AI, already one of Meta’s biggest vendors, processes and labels the data that fuels Meta’s large language models. It was only a matter of time before Zuck decided, “Hey, let’s just own a piece of the pipeline.”
And in true tech soap opera fashion, Scale CEO Alexandr Wang last week confirmed in an internal memo he’s leaving to join Meta full-time. For those keeping score: Wang, born in 1997, became the youngest billionaire in 2021. Now, he’s headed into the belly of the Menlo Park beast.
Wall Street seems to dig that. The stock shot up when the news leaked , as investors rewarded Meta for looking less like a social media giant and more like a serious AI player — even if it still serves your aunt’s minion memes.
👾 Microsoft: The OS of Enterprise Still Runs Smooth
Meanwhile in Redmond, Satya Nadella was out here quietly running the table.
Microsoft NASDAQ:MSFT hit an all-time high of $480 on June 12, pushing its market cap to a record-breaking $3.5 trillion. For about a day or two before that, Nvidia NASDAQ:NVDA was on top — and then Microsoft did what Microsoft always does: calmly pressed Ctrl+Alt+Delete on its competition and reclaimed its spot as Earth’s most valuable company .
How did that happen? Certainly not overnight.
Azure continues to gobble cloud market share, Microsoft 365 is still the gold standard for digital productivity, and Teams — love it or hate it — is now basically corporate law.
But don’t sleep on its AI game. Microsoft isn’t just throwing money at OpenAI, it’s embedding AI into everything it touches. Outlook, Excel, Word — all getting their Copilot upgrades. Want to finish that quarterly report faster? Let AI do it. Want it rewritten in pirate-speak? AI’s got you.
Microsoft isn’t just building tools. It’s establishing an infrastructure for the new AI economy. And traders see that. They understand that while Nvidia sells the shovels, Microsoft owns the mine.
👩🏻💻 Why the Rest of the Mag 7 Didn’t Make the Cut
Quick vibe check:
Apple NASDAQ:AAPL Still chasing the AI breakthrough. No one talks about the Vision Pro headset anymore, and the annual WWDC event wasn’t anything special. The stock is down 20% on the year.
Tesla NASDAQ:TSLA Robotaxis are coming ( maybe even this week ). But earnings pressure and margin squeeze made investors wish for more than tweets and timelines. The shares are underwater by 14% YTD.
Amazon NASDAQ:AMZN E-commerce growth hit cruise control, and its AI presence still feels more like an R&D lab than a monetized machine. The stock is staring at a 3.7% loss, largely thanks to Amazon getting slapped in the face from Trump’s tariffs .
Alphabet NASDAQ:GOOGL Search is still dominant, but Gemini’s bumpy launch and questionable performance has traders waiting for Google to actually ship something great, and not just strip the results from the iconic blue links . The stock is down 8%.
Nvidia NASDAQ:NVDA Yes, still the king of chips. And yes, it’s still delivering. But with valuation stretched like Lululemons in a CrossFit class and export bans weighing heavy , it’s getting harder to maintain the pace.
🍻 Trading Lesson: Leadership Rotates
If you’re a trader who’s been glued to Nvidia’s every tick or still buying dips on Apple because it “has to come back,” let this be your mid-year reminder: the market doesn’t care what used to lead.
Leadership rotates. Fundamentals shift. And sometimes, the best trade is the one hiding behind less hype and more function.
Case in point: While Apple’s been trying to find a catalyst, Meta just found a whole new business partner. While Nvidia’s been spinning plates on export rules, Microsoft’s just printing money off the back of Office subscriptions and Azure servers.
👀 What Happens Next?
With the second half of the year approaching, all eyes are on:
Meta’s AI ambitions — can the Scale deal accelerate model performance fast enough to close the gap with rivals?
Microsoft’s cloud dominance — can Azure continue its double-digit growth without hitting the regulatory radar?
Earnings, earnings, earnings — it’s almost the season again! Earnings reports kick off in about a month and things will get cracking.
Whatever happens, don’t bet the farm on what used to work. Watch the rotation. Track the strategy shifts. And for the love of charts — keep one eye on the Earnings Calendar .
💬 Final Thought
If Meta and Microsoft can shine while their peers flounder, what does that say about the real winners in this new AI economy? Maybe it’s not about who builds the flashiest model — but who actually knows how to monetize it. What’s your thought?

Why Recursion Pharmaceuticals RXRX Could Be the NVDA of BiotechRecursion Pharmaceuticals RXRX is rapidly emerging as a transformative force in drug discovery, leveraging cutting-edge artificial intelligence and automation to industrialize and accelerate the development of new medicines. Here’s why RXRX could be the next NVIDIA (NVDA) of biotechnology and why its stock could soar by year-end:
1. AI-Powered Drug Discovery Platform with Unmatched Scale
Recursion integrates AI, machine learning, automation, and advanced data science to decode biology and chemistry, dramatically reducing the time and cost of drug discovery.
The company’s proprietary BioHive-2 supercomputer, built with NVIDIA’s DGX H100 systems, is the most powerful AI computing system wholly owned by any biopharma company, enabling Recursion to process biological data at unprecedented speeds.
By reducing the number of compounds needed for clinical candidates from thousands to just 136–200 and shrinking development timelines to under a year, RXRX is fundamentally changing the economics of pharmaceutical R&D.
2. Strategic Partnerships and Industry Validation
RXRX has forged high-profile partnerships with pharmaceutical giants such as Bayer, Roche/Genentech, Takeda, and Sanofi, validating its platform and unlocking milestone payments that could exceed $20 billion over time.
The company’s collaboration with AI biotech Exscientia in a $700 million deal further cements its leadership in the AI-driven drug discovery space, creating a pipeline of 10 clinical and preclinical programs with hundreds of millions in potential milestones.
NVIDIA itself holds over 7.7 million shares of RXRX, making it one of NVIDIA’s largest biotech investments and a strong endorsement of Recursion’s technology and long-term vision.
3. Explosive Revenue Growth and Strong Cash Position
Analysts forecast Recursion’s revenue to grow at a 65% CAGR from $58.8 million in 2024 to $263 million by 2027, far outpacing the broader biotech sector.
The company ended 2024 with over $600 million in cash, providing a solid runway for continued investment in R&D, platform expansion, and clinical trials.
Wall Street analysts expect more than 50% upside in RXRX stock over the next 12–24 months, with multiple clinical milestones and partnership announcements as near-term catalysts.
4. Disruptive Vision: The “Virtual Cell” and Beyond
RXRX is building toward a “virtual cell,” where AI models can simulate biological processes with such accuracy that wet lab experiments shift from data generation to validating computational predictions.
This approach could dramatically improve drug development success rates, addressing the industry’s notorious 95% failure rate and positioning Recursion as the go-to platform for next-generation drug discovery.
5. Market Sentiment and Institutional Support
RXRX has caught the attention of growth investors and major funds, including Cathie Wood’s ARK Invest, further boosting its profile and liquidity.
Recent stock surges and high trading volumes reflect growing investor confidence in Recursion’s disruptive potential and the broader AI-in-biotech trend.

MGY: Technical Breakout + Fundamental Momentum = Quiet Winner?Magnolia Oil & Gas (MGY) is showing one of the cleanest technical breakouts in the energy sector — and the market hasn’t priced it in yet. After months of pressure, price has broken above both the 50-day and 200-day moving averages with rising volume, signaling a clear phase shift from distribution to accumulation. Recent candles confirm control shifting to the buyers, with a tight structure, rising lows, and bullish momentum building underneath resistance.
The fundamentals back the technical setup. In the latest earnings report, MGY delivered a 9.7% revenue increase, $110M in free cash flow, and continues to pay dividends with low leverage. UBS upgraded the stock with a $29 target, which aligns precisely with the post-breakout projection. Operationally, the company is expanding in key U.S. basins like Eagle Ford, while seeing growing demand from Australia and Latin America.
With oil prices pushing higher and geopolitical tensions rising, MGY stands out as a stable energy play in a volatile world. Holding above the $24.00–$24.30 zone keeps the breakout valid, with $29+ as a natural magnet for price. Most investors are still asleep on this name — but the structure is already telling a very different story.

EUR/USD: Euro Pops Above $1.16 in Four-Year High. What’s Next?The dollar wobbles, Trump talks tariffs, and the euro’s got its dancing shoes on.
The Euro Wakes Up, Stretching Its Legs at $1.16
Look who just rolled out of bed and decided to make a scene.
For the first time in four years, the euro has finally leapt out of its slumber and sprinted to $1.16 — all at the expense of the US dollar, which continues to shed value.
The FX:EURUSD isn’t just crawling higher. It’s flexing, fueled by dollar fatigue, political drama, and some very European stubbornness.
So what’s behind the move? Why is the euro soaring while the European Central Bank is actually cutting rates? And what’s the dollar doing? Let's unpack it all — one central bank, one tweet, and one inflation print at a time.
Trump’s Tariff Ping-Pong: Back On, Back Off
Let’s start with the one thing that never quite leaves the headlines: Trump’s trade policy.
Just when traders were catching their breath after some tariff reprieve on China, the market got pulled back into the mess. “WE ARE GETTING A TOTAL OF 55% TARIFFS, CHINA IS GETTING 10%. RELATIONSHIP IS EXCELLENT,” Trump posted on Truth Social late on Wednesday, reigniting fears that the trade war is getting heated up again. Especially after a US squad of negotiators touched down in London and walked away with some promising news .
Markets don’t love confusion. Investors especially don’t love a US trade policy that changes faster than the Nasdaq NASDAQ:IXIC during CPI week. This kind of noise erodes confidence in US economic leadership and — more importantly — in the dollar.
The world’s most important currency is starting to feel… less important, less relevant, and less reliable. And while it’s not collapsing, it’s definitely catching fewer friends at the FX party.
On the other side of the pond, the euro isn’t rising because Europe is crushing it (even though it’s doing pretty well against rival currencies, just check the forex heatmap ) — it’s rising because the dollar is slipping off its pedestal. So yes, the euro’s up. But this isn’t a standing ovation for Europe — it’s more of a polite shrug away from America.
US Inflation Creeps Higher — And That Means a Cut?
US inflation picked up to 2.4% in May but still left the door open for a cut by the Federal Reserve.
So what does the market do? It prices in a cut.
Lower rates mean lower yields on Treasuries, which means less incentive for global investors to hold dollars. And when the yield game turns dull, guess what gets more attention? Gold OANDA:XAUUSD — because if your asset doesn’t yield anything, at least let it be shiny.
ECB Cuts Again, and the Euro Still Rises?
Now here’s the riddle. The ECB last week cut its benchmark rate to 2% , hitting a two-year low. By all textbook logic, a rate cut should weaken the local currency.
Here’s why it’s rising instead:
Markets are forward-looking . The rate cut was expected and already priced in. What matters now is whether more cuts are coming (spoiler: not too many). Traders are betting the ECB is nearing the end of its easing cycle — and may turn neutral soon.
The Fed looks more dovish . Rate differentials still matter. Even if the ECB is cutting, the Fed is expected to cut more over the next 12 months. That narrows the gap between euro and dollar yields, making the euro more attractive in relative terms.
Eurozone data isn’t great — but it’s not falling apart either. While growth in the eurozone isn’t setting any records, it’s been just OK to support the currency. Inflation is cooling in line with ECB targets, unemployment remains low, and key sectors like manufacturing are showing signs of life.
Put it all together and you get a euro that’s rising despite rate cuts — a phenomenon that would make FX professors tear their hair out, but makes perfect sense when you zoom out.
Technicals: This Isn’t a Flash in the Pan
From a chartist’s perspective, the FX:EURUSD breakout above $1.16 was a big deal. That level had acted as resistance since November 2021. Now cleared, a flurry of algo buys and retail FOMO might fuel the next leg in either direction.
From the bulls’ perspective, momentum is picking up, and the euro looks poised to test $1.17–$1.18 if the dollar stays fragile (that said, keep your eye on any hot news coming out of the economic calendar ). RSI is not yet flashing overbought, and MACD is still screaming “more grounds to cover.”
Question is: How long can the euro dance before the music changes? And we’re asking you — share your thoughts on the euro-dollar pair and let’s see who gets it right!

ETHEREUM: THE NEW BOND OF THE DIGITAL WORLDPrice isn’t the goal. Price is the side effect.
Meanwhile, BlackRock - a black hole with a trust-backed logo - just absorbed 42,000 ETH more.
Yesterday, you may have read this "regular" headline:
BlackRock increases its Ethereum exposure to $4 billion, adding $109.5 million via ETFs.
But here’s what you missed: there are no random numbers on the market.
When a player like this moves - it’s not hype. It’s a blueprint for the future.
Ethereum is no longer an altcoin.
It’s no longer speculation. It’s a financial infrastructure, already recognized by law, exchanges, and institutions.
What does this mean?
💡 Ethereum is now a digital bond - with yield flowing from blocks.
Profit is no longer built on promises, but on the structure of the chain itself.
Trust lies not in faces, but in code.
Growth is not artificial — it’s architectural.
And here’s why this is terrifyingly beautiful:
While you sleep, they are building an era.
Each ETF purchase removes ETH from circulation - permanently. Because:
✅ This ETH is gone from the open market
✅ It won’t be panic-sold
✅ It becomes income-bearing collateral, not a speculative asset
Still waiting for an entry signal?
The big players are already in.
This is no longer crypto - this is cash flow infrastructure, embedded into the digital economy.
And when pension funds, insurers, and sovereign investors move into Ethereum - they will come via ETFs.
Not because it’s trendy, but because it’s regulated, stable, and profitable.
📉 When institutional demand meets vanishing supply - the price won’t simply rise. It will explode, not as growth, but as a structural liquidity shift.
Ethereum is:
💸 Staking = passive yield
🔗 Backbone of DeFi
🖼 Fuel for NFTs
⚙️ Millions of transactions per second
⚖️ A regulated ETF asset
This is the new digital bond system, where the bet isn’t on the dollar - it’s on ETH as an income-producing asset.
💥 While you're reading this, the game is already on.
ETFs are rewriting the rules of time-ownership.
No hype. Just filings. Just intention.
Best regards EXCAVO

Silver surge has more bullish upsideSilver is breaking out. Its strength is no accident. The US is running a structural deficit north of 6% of GDP in a full-employment economy. The bond market has absorbed the pain so far, but pressure is building. Investors are starting to look for insurance. Silver is one of the cleanest ways to play the dollar’s long-term debasement.
The metal is trading well above its 200-day moving average. The US$31.50-32.00 zone now acts as solid support. Any pullback into that range is likely to be short-lived.
Silver doesn’t move in straight lines. It runs, consolidates, then runs again, usually in 50–90 day cycles. The current setup fits that rhythm.
The gold-to-silver ratio is still near 100x. Historically, the average is closer to 60-70x. That gives silver more room to catch up. Traders can short gold and go long silver to play that mean reversion. Or simply buy silver outright and short the dollar. ETF inflows into silver have picked up, showing broader market interest.
The main risk? A sudden shift in Fed tone or falling inflation expectations. But that seems unlikely near term.
Silver isn’t just a trade. It’s a message. A hedge against fiscal irresponsibility and the cost of kicking the can too far.

Soaring platinum breaks a 3 year high at $1,152.50/ozChina, the world’s largest consumer of platinum, imported its highest amount in a year last month. Retail investment demand (bars and coins) in China more than doubled, overtaking North America as the top market for platinum investment.
Analysts at Bloomberg Intelligence predict that global platinum demand will exceed supply for the rest of the decade.
Key technical levels:
• Platinum futures hit a 3+ year high at $1,152.50/oz.
• Next resistance levels:
o $1,197.00 (March 2022 high)
o $1,281.40 (May 2021 high)
o $1,348.20 (February 2021 high)
• All-time high: $2,308.80 (March 2008)
The strong Chinese demand and lagging EV transition may fuel a sustained bull run in platinum prices. Investment opportunities may exist if technical resistance levels are broken, potentially retesting highs from 2021 and 2022 even aiming toward the 2008 peak. Supply constraints and investment interest make platinum a strategic metal to watch in both industrial and financial markets.

Elon Musk vs Trump: Who you betting on?Elon Musk and Donald Trump have recently had a public falling-out, with their feud playing out on social media and in political circles.
The dispute seems to have started over Trump's new budget bill, which Musk has criticized for increasing the national debt. Trump, in turn, accused Musk of being upset because the bill removes electric vehicle subsidies that benefit Tesla.
The tension escalated when Trump suggested that Musk had known about the bill beforehand and had no issue with it until after leaving his government role. Musk denied this, claiming he was never shown the bill and that it was passed too quickly for proper review. Trump then took things further by threatening to cut Musk’s government contracts and subsidies, which amount to billions of dollars. Musk responded defiantly on social media, calling Trump "ungrateful" and claiming that without his financial support, Trump would have lost the election.
TSLA violated key levels and will be looking for a sharp technical bounce off the $260-$257 zone

OptionsMastery: Inverse head and shoulders on UAL! 🔉Sound on!🔉
📣Make sure to watch fullscreen!📣
Thank you as always for watching my videos. I hope that you learned something very educational! Please feel free to like, share, and comment on this post. Remember only risk what you are willing to lose. Trading is very risky but it can change your life!

The MSCI World index sets a new all-time record!The MSCI World stock market index set a new all-time record during the trading session of Monday June 2, wiping out the entire stock market shock of February/March, which saw the global equity market lose 20%. This technical signal still needs to be confirmed at the end of the week at the next weekly technical close. If this bullish technical break were to be confirmed, then this would be a very positive signal for the global equity market, which is still hoping that trade diplomacy will lead to solid trade agreements between the USA and its main trading partners (China and the EU).
The chart below shows the weekly Japanese candlesticks of the MSCI World index.
1) Composition and calculation of the MSCI World index
The MSCI World Index (Morgan Stanley Capital International World Index) is a benchmark stock market index that measures the performance of large- and mid-cap equities in developed countries. Here are the main elements of its composition:
The MSCI World Index is a benchmark global stock market index that measures the performance of large- and mid-cap equities in 23 developed countries. Created by Morgan Stanley Capital International, it offers a global view of the equity markets in the most advanced economies. Among the countries included are the United States, Japan, the United Kingdom, France, Germany, Canada and Australia. The index comprises some 1,600 companies, with a strong dominance of the USA, which accounts for almost 70% of its total weighting. The most represented sectors are information technology, healthcare, financial services and consumer discretionary.
The MSCI World is calculated using a weighting method based on free-float market capitalization, i.e. taking into account only those stocks actually available for purchase on the markets. This means that companies with a higher market value and a larger free float have a greater influence on the index's performance. The MSCI World is updated regularly to reflect market developments and the entry or exit of companies.
Although it offers broad geographic diversification, it does not include emerging countries; these are covered by the MSCI ACWI index, which is also close to setting a new all-time record and is 13% composed of emerging countries (China, India, etc.).
2) Trade diplomacy and the FED's monetary policy outlook are key to keeping the global equity market bullish in the months ahead.
Trade diplomacy and the FED's monetary policy outlook are closely linked fundamental factors which have a direct impact on global equity market trends.
While the US inflation rate continues to trend towards the FED's 2% target, the FED is waiting for trade agreements to be signed to ensure that the risk of a second wave of inflation is averted, so that it can resume cutting the US federal funds rate.
These two fundamental conditions are essential if the global equity market is to confirm its new record highs over the coming months.
DISCLAIMER:
This content is intended for individuals who are familiar with financial markets and instruments and is for information purposes only. The presented idea (including market commentary, market data and observations) is not a work product of any research department of Swissquote or its affiliates. This material is intended to highlight market action and does not constitute investment, legal or tax advice. If you are a retail investor or lack experience in trading complex financial products, it is advisable to seek professional advice from licensed advisor before making any financial decisions.
This content is not intended to manipulate the market or encourage any specific financial behavior.
Swissquote makes no representation or warranty as to the quality, completeness, accuracy, comprehensiveness or non-infringement of such content. The views expressed are those of the consultant and are provided for educational purposes only. Any information provided relating to a product or market should not be construed as recommending an investment strategy or transaction. Past performance is not a guarantee of future results.
Swissquote and its employees and representatives shall in no event be held liable for any damages or losses arising directly or indirectly from decisions made on the basis of this content.
The use of any third-party brands or trademarks is for information only and does not imply endorsement by Swissquote, or that the trademark owner has authorised Swissquote to promote its products or services.
Swissquote is the marketing brand for the activities of Swissquote Bank Ltd (Switzerland) regulated by FINMA, Swissquote Capital Markets Limited regulated by CySEC (Cyprus), Swissquote Bank Europe SA (Luxembourg) regulated by the CSSF, Swissquote Ltd (UK) regulated by the FCA, Swissquote Financial Services (Malta) Ltd regulated by the Malta Financial Services Authority, Swissquote MEA Ltd. (UAE) regulated by the Dubai Financial Services Authority, Swissquote Pte Ltd (Singapore) regulated by the Monetary Authority of Singapore, Swissquote Asia Limited (Hong Kong) licensed by the Hong Kong Securities and Futures Commission (SFC) and Swissquote South Africa (Pty) Ltd supervised by the FSCA.
Products and services of Swissquote are only intended for those permitted to receive them under local law.
All investments carry a degree of risk. The risk of loss in trading or holding financial instruments can be substantial. The value of financial instruments, including but not limited to stocks, bonds, cryptocurrencies, and other assets, can fluctuate both upwards and downwards. There is a significant risk of financial loss when buying, selling, holding, staking, or investing in these instruments. SQBE makes no recommendations regarding any specific investment, transaction, or the use of any particular investment strategy.
CFDs are complex instruments and come with a high risk of losing money rapidly due to leverage. The vast majority of retail client accounts suffer capital losses when trading in CFDs. You should consider whether you understand how CFDs work and whether you can afford to take the high risk of losing your money.
Digital Assets are unregulated in most countries and consumer protection rules may not apply. As highly volatile speculative investments, Digital Assets are not suitable for investors without a high-risk tolerance. Make sure you understand each Digital Asset before you trade.
Cryptocurrencies are not considered legal tender in some jurisdictions and are subject to regulatory uncertainties.
The use of Internet-based systems can involve high risks, including, but not limited to, fraud, cyber-attacks, network and communication failures, as well as identity theft and phishing attacks related to crypto-assets.

USDJPY forms textbook head and shoulders patternOur last bearish call on USDJPY played out perfectly. Now, a new setup is forming. With US ISM data showing contraction and stock markets under pressure, the dollar-yen could be next to drop. Watch as we break down the textbook head and shoulders pattern and the levels to watch for a potential 600+ pip move. Target zones, risk-reward, and key breakout levels all included.

Do bulls have enough steam to drive gold higher?A lot of things to consider this week, a lot of data and geopolitical tensions. Will the economic uncertainty and potential bad US jobs data drive TVC:GOLD higher? Let's dig in.
FX_IDC:XAUUSD
Let us know what you think in the comments below.
Thank you.
77.3% of retail investor accounts lose money when trading CFDs with this provider. You should consider whether you understand how CFDs work and whether you can afford to take the high risk of losing your money. Past performance is not necessarily indicative of future results. The value of investments may fall as well as rise and the investor may not get back the amount initially invested. This content is not intended for nor applicable to residents of the UK. Cryptocurrency CFDs and spread bets are restricted in the UK for all retail clients.

Bull market scenario LITECOINAt this period, I'm speaking about LITECOIN, which currently has one of the strongest bull-looking charts on cryptocurrency!
We may see the price testing Fibo's higher levels very soon...
A bull market may begin, so I recommend focusing on higher price markings...
On another market, like BTC, Ethereum, or Pepe, we do not have vivid bull pictures.
That was one of the reasons for making this trading analysis...
Enjoy!

TRVG - Basic Analysis can lead to great trade ideas!This is as simple as it gets. See a taper, be a taper!
Good trade opportunity incoming if we prove a breakout of red strong selling and we can make our way toward a HTF purple tapered selling and ultimately prove a HTF buying continuation in orange.
Happy Trading :)

Rate Cuts and Risky Bets: When the Fed Rolls Out the Red Carpet🎬 The Fed’s June Meeting Is Around the Corner
Mark your calendars: June 17–18 is when the Federal Reserve's Federal Open Market Committee (FOMC) convenes next. With the benchmark interest rate ECONOMICS:USINTR currently holding steady at 4.25% – 4.50%, investors and policymakers alike are keenly awaiting any signals of a shift in monetary policy.
Market expectations suggest a cautious approach, with futures markets indicating a modest probability of rate cuts in the latter half of the year. That said, the upcoming meeting could offer some juicy insights into the Fed's outlook — yes, in this economy.
🤝 Trump vs. Powell: The Sequel No One Asked For
President Donald Trump and Fed Chair Jerome Powell recently had their first face-to-face meeting during Trump’s second term, rekindling a familiar tension. Trump criticized Powell for maintaining high interest rates, saying it puts the US at an economic disadvantage compared to countries like China.
Not too surprising, Trump’s tone, that is. As a matter of fact, it’s way softer than when the President called the Fed chair a “major loser.”
Anyway, Powell was holding back at the meeting, saying that the Fed is independent and that monetary policy decisions are based on objective economic data, not political pressure.
Despite Trump's public and private criticisms, Powell remains steadfast in his approach, focusing on long-term economic stability over short-term political considerations.
📉 Inflation, Employment, and the Tightrope Walk
Inflation has decreased significantly from its peak of 9.1% in 2022 to 2.3% in April 2025 , nearing the Fed's 2% target. However, the labor market remains robust, with unemployment rates at historically low levels.
The Fed faces a delicate balancing act: cutting rates too soon could reignite inflation, while maintaining high rates might dampen economic growth. This tightrope walk requires careful analysis of incoming data and a measured approach to policy adjustments.
🛍️ Market Reactions: Bulls, Bytes, and Bullion
If rate cuts are the rumor, the S&P 500 SP:SPX is already buying the headline. The index clawed back all of its early-year slump and now sits just above the flatline. Traders are clearly pricing in a friendlier Fed, even if Jerome Powell hasn’t sent out the official RSVP yet.
Gold OANDA:XAUUSD , meanwhile, has been doing what it does best — quietly flexing in the corner as uncertainty swirls. Prices bounced back above $3,300 in late May, reminding everyone that when central banks blink, bullion blings. A rate cut could weaken the dollar — and gold’s inverse relationship with the greenback suddenly looks like a playbook move.
Speaking of the dollar, the dollar index TVC:DXY has been wobbling like it’s just finding its feet. With inflation softening and tariff noise all over the place, the buck has lost some swagger . Traders are already rotating out of safe havens and into riskier plays, including…
Yep, Bitcoin ( BTCUSD ).
Crypto’s original bad boy is back on the move, orbiting near $110,000 after rewriting its all-time high book in May.
A dovish Fed can technically pour more rocket fuel into the rally, especially as sovereign adoption and ETF flows keep pumping ( $9 billion in just five weeks?! ). In the land of easy money, Bitcoin doesn’t just survive — it thrives.
The takeaway? Markets love a dovish pivot. Whether you're holding stocks, stacking sats, or eyeing gold bars, the Fed’s next move could be the difference between breakout and breakdown.
🧠 What to Keep in Mind
As the June Fed meeting approaches, traders should consider the following strategies:
Diversification: Maintain a diversified portfolio to mitigate risks associated with interest rate volatility.
Equity Exposure: Evaluate exposure to sectors sensitive to interest rates, such as the good old tech space and throw in some financials — banks love rate moves.
Inflation Hedges: Consider assets like gold or silver to hedge against unexpected inflationary pressures.
🧾 Conclusion: Navigating Uncertainty
The June Fed meeting isn’t just another calendar event — it’s a market-defining moment dressed in central bank jargon. With politics heating up and inflation cooling down, Powell’s next move could either pump more cash into the risk rally or throw cold water on the party.
Yes, the noise is loud. Yes, the data is messy. But through it all, one thing holds: staying nimble beats being early. Whether you're riding the S&P 500, hodl’ing Bitcoin, or hugging gold like a doomsday prepper, this is the time to trade the chart, not the chatter.
Off to you : Are you in the rate-cut camp or you think there’s more ground to cover before Powell and his squad tune the pitch down? Comment below!

Bullish Trigger Hit! Looking For Longs on the S&PLast time we spoke, I mentioned some key levels I wanted to see price drop to before considering a move to the upside. And what do you know — here we are.
In today’s video, I share an update on the trade idea and how we can position ourselves for the next big play.
Walk with me as I break down this price action, #OneCandlestickAtATime.

Does Bitcoin Keep You Up at Night?Just a meme I made this morning.
The Weekly All Time High Breakout has failed, twice, just like 2021...

Nvidia Posts Another Blowout Quarter. What Can Slow It Down?Hint: Not much.
🚀 Earnings So Good You Can’t Ignore ‘Em
Another quarter, another jaw-dropper from Nvidia NVDA . In what has basically become a quarterly ritual at this point (congrats to all who celebrate!), Jensen Huang’s silicon empire posted revenue of $44.1 billion , soaring past the $43.3 billion consensus.
That’s a 69% year-over-year gain, in case anyone’s still doing the math. Adjusted earnings of 81 cents per share also easily crushed expectations.
Shares popped 5% in after-hours trading Wednesday and then pulled back a little bit during the cash session on Thursday — not quite a moonshot, but a confirmation that even if Nvidia’s guidance was meh, this earnings report was meh’gnificent.
So what exactly is fueling this unstoppable juggernaut? And is there anything that could actually throw a wrench in the gears? Grab your chips (there’s your pun), let’s break it down.
💾 Data Centers: The Company’s Cash Cow
If Nvidia is famous for anything, it’s that it’s really able to see the trend before the crowds pick it up. From gaming, to crypto… and now? The star of the show now is data centers. But there's not just any growth. We’re talking $39.1 billion in data center revenue, up 73% from last year. That’s nearly 90% of Nvidia’s entire business. Not exactly fans of revenue diversification, are we?
Big Tech is gorging on Nvidia’s AI chips like it’s an all-you-can-eat GPU buffet. Amazon NASDAQ:AMZN , Google NASDAQ:GOOGL , and Microsoft NASDAQ:MSFT alone account for nearly half of that segment.
Basically, if you’re building anything with the words “large language model,” “AI agent,” or “sovereign compute,” you’re probably writing big checks to Nvidia.
🇨🇳 About That $10.5 Billion Problem
Thanks to Trump’s H20 export ban, Nvidia’s revenue from China is expected to take a $10.5 billion hit over two quarters. That’s an $8 billion crater forecasted for the current quarter, on top of a $2.5 billion gap in the previous one.
Is that bad? Maybe. Does anyone care right now? Not really.
Because here’s the kicker: demand outside China is so nuclear that even subtracting ten billion bucks over six months doesn’t materially derail the bullish narrative. Nvidia’s still forecasting $45 billion in revenue this quarter, which is basically flat — but considering what’s missing, that’s a win in disguise.
📦 Blackwell to the Rescue
The forward guidance may have missed the Street’s expectations — Nvidia projected Q2 revenue of $44–$46 billion, versus the $45.9 billion consensus — but CEO Jensen Huang already served the antidote: Blackwell Ultra.
These next-gen chips are already shipping to early customers. They promise to be leaner, meaner, and more power-efficient — basically, think McLaren but for AI accelerators. And they’re expected to ramp up aggressively in the back half of the year.
That means Nvidia has a new growth lever just waiting to be pulled. Some overly bullish analysts say it could eclipse the H100’s success.
💡 The Real Moat? It’s Not Just the Chips
What makes Nvidia such a rare beast isn’t just its hardware. It’s the ecosystem — CUDA, software stacks, developer tools, APIs, vertical integrations. It’s like Apple, but for the AI industrial complex.
Everyone wants to build an AI empire, but good luck doing it without Nvidia’s infrastructure. It’s not just expensive — it’s essential.
In the meantime, AMD NASDAQ:AMD and Intel NASDAQ:INTC are trying. There’s chatter about custom silicon from OpenAI (still a private company) and Meta $META. But for now, the moat around Nvidia looks more like a canyon.
🧨 So What Could Slow It Down?
But let’s not get carried away — there are still some real risks on the radar. Here’s what might actually trip up the AI king:
Geopolitical shocks: More export bans? Chinese retaliation? Taiwan tension? Any of these could make markets twitchy.
Supply chain constraints: As demand grows, so does pressure on foundries like TSMC 2330 . Any hiccups in advanced packaging or wafer starts could pinch margins.
Rising competition: AMD’s MI300 is no slouch. And Big Tech is building in-house chips to lessen reliance on Nvidia.
AI fatigue: If the AI hype cycle fizzles out or hits a plateau (remember the metaverse?), that could cool capital spending. It only takes 3-4 tech titans to pull their capex and Nvidia’s reign is over.
But until any of that materializes, the narrative for many is "Buy the dip — Jensen’s grip won’t slip."
💫 What’s Priced In?
The stock’s P/E is still sky-high, and the multiple implies several more years of 50–60% annual revenue growth. That’s hard to sustain indefinitely. But then again, so was becoming the second-largest company in the world… (and the biggest one, if only for a while ) and here we are.
Nvidia’s valuation is steep, but not unjustified — as long as it keeps executing. And judging by any of the previous quarters going back to 2023, execution isn’t a problem.
👩🏻🚀 More Than a Stock — Macro Theme
At this point, Nvidia has transcended chipmaker status. It’s now a macro story. Betting on Nvidia is betting on AI. It’s betting on infrastructure. It’s betting on the next industrial revolution in software, automation, and language models.
So… what can stop it? Share your thoughts in the comment section!
