NIFTY50 - Trendline Breakout StrategyWhenever i see a trend-line break , but not a follow-through move, i draw a parallel Trend line to the new low made.
And if the price break this new trend-line, then the chances of price follow through becomes high.
Hence nifty is sell below 8980 levels.
Do not follow blindly, please do your own research.
Strategy!

Blue FX Strategy vs. Technical AnalysisA video demonstrating that if your Technical analysis is accurate our strategy will catch the move anyway.
However, more times than not - it can hold you back and create barriers that may not exist.
Please have a watch and see what you think.
Regards
Darren

High time frame review and how to use the Strategy TesterHi All
Here we demonstrate the effectiveness again of the H4 timeframe - and also the Daily TF.
We also explain the 'Strategy Tester' Function - something that we are now working on for V3 based on ATR settings for SL and TP targets.
Regards
Darren

Spotting signals without staring at charts all day? [Advanced]Prologue & disclaimer, you can skip this:
[ I am not talking about a strategy. I call this advanced because someone that has only been around for 3 months should be busy touching and looking at everything, soaking up info, someone around for 6 months should be busy backtesting and coming up with a decent method or strategy supported by a sufficient knowledge base.
What the focus is here is how to generate ideas without wasting time. You're profitable or hoping to be, you've got a few years doing this, you're going to keep doing it for the next 30 years, you're not going to be staring at charts all day long just to spot something.
Profitable strategies are complex, I seriously doubt something any idiot picked off the street can do will make money in the long run. An essential part of the strategy is knowing where to look. I guess most pro traders don't even do this step since they are hired to be experts at 1 thing and 1 thing only. "Looking for an Oil trader in the London region". I've heard of offers for FX & something, but those are portfolio managers, or managers for traders. I don't know how many people this applies to. What do equity traders do? Read the news, keep their ears open, and focus on companies they heard about? Day trading is still stupid.
I thought I had a huge amount with 35 (4 commodities + ~10 currencies total of 31 pairs), and here investopedia is talking about building a primary database that contains between 300 and 500 stocks and a secondary list that fits on their trading screens. Haha ye sure ok. Scram.
A site interviews a stocktwits troll "My stock selection preparation is done more on a weekly basis. 90% of my watch-list is created on the weekend, for the week ahead. At any given time I have 50–100 stocks I’m eyeing daily for potential setups.".
The fact that 90% get rekt within months and quit, 9% barely make it and don't really know what they are doing, and 1% are complete autists and paranoid about losing their edge, makes finding that kind of info pretty hard.
My watchlist barely changes, I always have 35 symbols in it. You want it big enough that you filter filter filter and go for the juiciest setups only, but hundreds LOL!!! netpicks "I day trade a watchlist of 10-25 names I spend 5-10 minutes 3 times a day scanning the whole list". Hedge funds hold hundreds of stocks currencies etc. What is this? It's like I am an OTP with a massive watchlist of 35. One Trick Poneys are always absolute beasts. Especially when they one trick complex high risk high reward things that others struggle with. And it gets worse the more abstract it is. I like it. I like it very much 😊
End of Prologue ]
This is a marathon not a sprint.
Have you ever been carrying a backpack or grocery bags and thought "hey this is quite light" and rushed forward only to get tired and have a hard time after 20 minutes, losing breath, losing your grip, and running out of energy?
What about these trolls that sprint in actual marathons and lead the race... for about 50 seconds...? Then finish in 4-5 hours (Eliud Kipchoge holds the world record with 2:01:39 man grandpa broke the record at 34 years old, and he set the london record at 35, it's never too late max heart rate goes down with age but that's all, plenty of top marathon runners and bodybuilders are like almost 40, and those are physical activities, so imagine for mental activities that rely on experience and rational thinking NOT impulses, but excuse finders will always find excuses "I am too young too young to invest yet, and I have all the time in the world, and should focus on studies" followed by "I am too old now").
Absolute 😂😂😂
Short bursts are so much easier. Quick explosion and then you're done. Sweat alot and out of breath for a while, but done.
Marathons are painful!
Feels easy at the start but it gets difficult over time. That's enough explaining.
What you want is to make it as simple and as easy as possible because your short burst motivation won't last.
Myself, I want to have a focus that is small enough to stay performant and not exhaust myself, but I don't want it to be so small I miss out a ton.
I'm going to go throught my thought process and come up with something at the end of this idea:
I have a large watchlist...
Would I miss alot?
Solution 1: I keep my 35 charts and quickly look at them visually to get ideas, to get a quick "feel" of where the price is compared to where I want it to go.
Solution 2: I go for 12-15 charts and spend more time on each thinking of all the possibilities and looking for more.
You absolutely have to make it as simple as possible.
I could remove some pairs. USDTRY I don't really ever touch. I don't remember ever doing anything with AUDCHF.
But even if I reduced it I would want to keep 25 to 30 tickers in there.
I can't be constantly scanning it. I don't look at indices much anymore, but still a bit, sorta need too I guess, and it's interesting.
Looking at US indices and Bitcoin and Tesla breaks the routine, it makes it interesting, so that's part of the solution not the problem.
I don't want to drastically reduce my watchlist, and I don't want to spend 2 hours a day looking at chart in a repetitive way.
"2 hours work a day isn't much". Doesn't work like this. First of all it is repetitive and extremely boring.
Check.
Mate.
Let's say I am looking for price reaction around support levels after an ABC. The strategy is advanced but I can divide it in steps:
There's pretty much all I can think of here, not sure what else one would look at, maybe I missed something.
When I have a potential setup I know how to analyse it, but the problem is in what order, more importantly how to get an idea?
I can't spend 20 hours a day 7 days a week analysing every currency in depth.
What is the simplest?
1- Draw supports on 35 charts once a week, set price alerts and go in more depth when an alert pops?
2- Look for reactions and then check it?
3- Do an analysis on 35 charts then set price alerts on the few levels I am interested in?
4- Look at the central bank calendar, and only pay attention to currencies moving (there's periods with certain currencies offering lots of trades and other ones doing nothing, no point looking at the ones not doing anything special or predicatable)
It takes time but it is less boring than other ways. Imperfect.
5-
This looks like the more viable direction, so let's dig into it more...
==>
So then the question is, how often do I watch, and what alerts do I use?
Better look at another now.
Other examples of "dirty" ABC:
And another question? How to know what the macro trend is etc?
Can read news often but most Forex "news" is, going to use the correct word for it, retarded.
And boring too. Absolute load of rubbish. Just read central bank announcements?
I have yet to find an interesting media. Tried to post ideas myself but it's too much.
I don't know if this is clear but it doesn't matter anyway.
Just wanted to show the thought process.
I did plenty of backtesting (I just posted a couple of charts here but I did hundreds more, not counting those I traded and those I backtested without this particular problem in mind in other words my experience).
Basically I think the optimal lazy/reward ratio is with scanning my watchlist twice a week.
More is greedy and I just won't do it (and end up missing out more), less is starting to be a little too little and I might miss out really often.
You're not here to go and chase every little move. But you do want to grab some!
At some point maybe we're all supposed to tire of it all anyway and go long term hold, or hire people.
Going to fry my brain with too much thinking.
So anyway I think I came up with this:
This would make a decent template.
Then all you have to do is fill the box with your method, system, strategi(es), preferences.
What I need to keep in mind out of this:
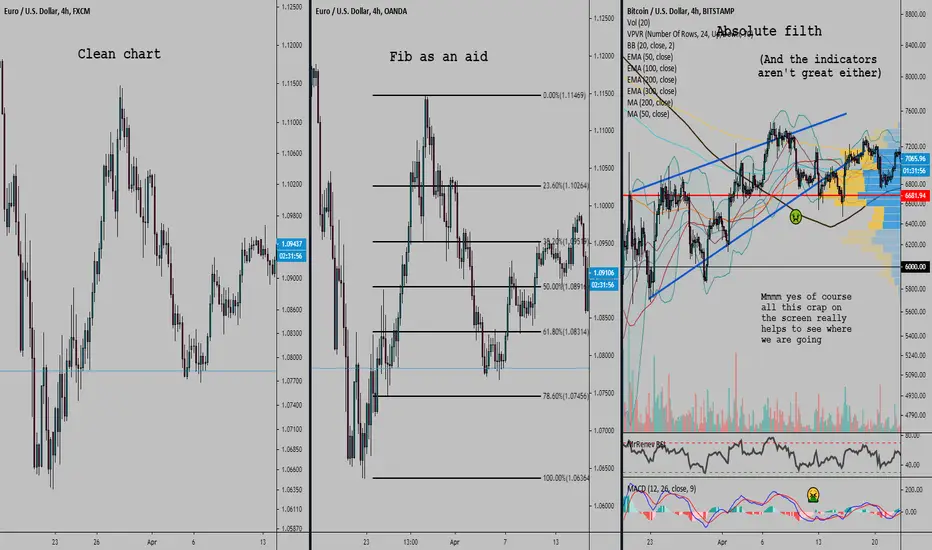
Step 1: Have clean charts with fib drawn (make a copy before vomitting all over it - I know I won't do it but I like to pretend)
Step 2: Sunday & Wed: When it's not Bitcoin tier and actually resembles something ⚠️, spot the area of interest (10 sec top chrono 🚨). Price alert early into.
Step 3: When I get an alert, that is a price alert ===> Then I go full TA. I have time. And it will take time. 90% filth ignored, rest gets a "reaction alert".
Step 4: When I get an alert, that is a reaction alert ===> Verify, and well I know what to do w/e. Very few to keep an eye on at this point.
If I spend too much time looking for an area to buy in then it's trash. The quicker I see it, the higher quality it is.
If I can't do this correctly, a solution is to rent an office. Easier to do pointless boring stuff regularly with an office. Just need to go twice a week.
But I really like this process. The NAZI lockdown makes it harder tbh, but with a semi normal life, following a process this simple is not a problem.
I don't even see how I can make it smoother and simpler I think I reached the limit.
That's all folks. Make it as simple and clean as possible. Good luck.
The best system in the world is the one you stick to.
EURUSD Review using our strategy since Nov 2019 - 83% win rate!!A review of EURUSD H4 timeframe since November 2019.
83% win rate, see how easy it is?
Regards
Darren

V2 is live - review of EURAUD (March and April) 14% gain!Hi all
Now Blue FX Trend Strategy V2 is live I wanted to demonstrate this on the charts.
EURAUD over March and April presented 16 trades. 10 winners and 6 losing trades.
2:1 Reward to risk - generating a gain of 14% on this one pair alone.
Enjoy!
Regards
Darren

4H Support / Resistance with RSI Day Trading StrategyRSI = Blue, EMA of RSI = Red.
RSI 14, EMA 45
Long Rules:
1) RSI > EMA RSI = look for long setups
2) Resistance is broken ( a new high )
3) Price rejects (pulls away) from the previous resistance
4) RSI > EMA RSI >> 50
Short Rules:
1) RSI < EMA RSI = look for short setups
2) Support is broken ( a new low)
3) Price rejects (pulls away) from the previous support
4) RSI < EMA RSI << 50
I typically like to place a stop loss at the top of the closest resistance (if going short) and at the bottom of the closest support (if going long) and TP 1:1.
Another method is to go for partial profit at the closest support/resistance and move the stop to breakeven to catch longer trades.
3/4 trade setups in the past month on AUDUSD
FLAGS:
*the setup on the 20th of March was a working short position, but the strategy is looking long.
*the setup on the 31st of March was not validated as the RSI is not > EMA of RSI

🧲If you want to be successful trader, you must read it🧲🌆Good night, guys!👍🏻 Each of us wants to be a successful trader! 👌🏻
🧷Just as a good technique doesn’t make a profit with the wrong tactics , the right tactics wouldn’t succeed if the overall strategy is wrong . 🧷
🏹With the help of tactics , battles are won, and strategy makes it possible to win a war. 🏹
🔗The strategy determines the opportunity: it doesn’t find an advantage on certain days, but establishes a common source of advantage in the market. 🔗
🧿Ideally, tactics are an instrument of strategy , just as technique is an instrument of tactics .🧿
🔺That’s can be imagined as a kind of pyramid.🔺
💪🏿💪🏿💪🏿Here some tips, how to become a successful trader:
📌focus on fully following your system on every trade;
📌think about weekly or monthly profit, and not about the results of individual transactions;
📌 monitor and analyze your performance;
📌at the end of every day, every week and every month, evaluate your actions and strive for greater success;
📌keep a positive mood;
📌avoid the negative effects of fear and doubt about your competence;
📌teach others how to maximize productivity and with the help of this, improve yourself.
If you liked my post, subscribe and put 👍🏻
💋It will be grateful for your feedback🐾
✍🏻Write in the comments topics, that you would like to read💕💕
Stay with me❤❤❤
Your Rocket Bomb🚀💣

Blue FX Weekly recap to dateAn overview of our strategy and the trades we have taken this week and why.
Great trades with members catching great pips.
GBPCAD 150-200 pips
EURJPY 100-150 pips
GBPCHF 100 pips
EURUSD 60-80 pips
USDJPY 150 pips
EURCAD / NZDCAD buys
EURNZD 100 pips
Gold 100-300 pips
EURAUD Sells (not mentionned in video, on Monday we were in sells! - 100 pips)
CADJPY / CADCHF sells
Its only Wed morning!
Regards
Darren

How did the Low Vol strategy do this month? Low vol is supposed to be better in times of high vol. (At least that is how a financial advisor explained it to me).
So let's see. This March was quite volatile. How did LOW vol do compared to your vanilla $SPY?
Turns out this month it did 2% worse.

How to trade the current markets!In this video I explain how you should be trading the current market movement and conditions. This video is more educational than anything else.

Make faster decision with RENKO OHLCOn March 3, 2020 TradingView started supporting OHLC for Renko charting. Prior to this, only CLOSE of candle was available. Using OHLC provides faster signal to get in and out of trade, compared to using CLOSE.
Renko chart using OHLC
Renko Chart using CLOSE
Happy trading!

200 EMA - best use for entries!I don't use indicators, they're not my style, they lag, they repaint; and in my opinion they don't work.
The 200 EMA on DAILY can be useful because of how slow it is. We can use it to filter the direction of which way we trade.
Price ABOVE 200 ema = ONLY BUY
Price BELOW 200 ema = ONLY SELL
Then drop timeframes for your entries via your strategy whatever that may be. If your strategy says go long but price is below EMA, don't take the trade etc...
Ignore the EMA on other timeframes lower than the daily. You want a slow daily direction indicator.
Don't blindly trade this, wait until price is clearly past the EMA and maintaining a good distance from it.
Use it as a guideline if you struggle working out fundamentals to help you filter a direction to trade.
NOT TO REPLACE FUNDAMENTAL ANALYSIS!!!

What should we do next with USDxHello Trader around the world, how about your last friday, did you trade?
Last friday I've trade the USDCAD and AUDUSD currency
For AUDUSD I Long and lost already
But USDCAD still at the big resistance and I have short already and put a stop loss at 500pip
I really want Monday to come fast as I can
Today I want to sharing all of you
learn about How the currency connect
Sometime maybe someone Long and Short position in the same time with same currency
It was no good
Long EURUSD and also Long USDCAD is wrong
But Long EURUSD and Short USDCAD is great
Cause if we look at USDx or Dollar index
And try to compare with any currency you will see something connect
First you shoud know that USDx will move same with USDXXX currency and XXXUSD will move converse in the same time
Example
Now USDx move up
USDCAD should move upward
EURUSD should move downward
For now about USDx you will see a price have break already
so if the price will continue to move up
Price should comback and rest at the old Resistance or new support
If you see a price move downward to support
Is mean that USDx move downward
Is mean that USDXXX move downward too
Is mean that XXXUSD will move up
Did you get it?
I hope that the things that I have learned around 3 years can help you and you will be a great trader if you can
Trade is a lot of things you have to learn
And we always have to update a strategy
Is didn't mean you know something and you will rich from it
You have learn a lot of things and use it at the right time, timing is so important
Just it, that's all for today
About how there r connect
Sorry for my bad English
Hope this week you will get a lot of money
Goodluck

30% WIN RATIO AND STILL PROFITABLE?-Trading psychology and Risk Hello traders!
-READ THIS DESCRIPTION FOR MORE INFORMATION!
-This tutorial is for people who are struggling with RISK MANAGEMENT and MONEY MANAGEMENT.
In this tutorial i will show you how to be profitable with 30% ratio.
But first i will explain you what is risk and reward.
-Risk is amount of money or percentage what are you willing to risk(lose).
-Reward is amount of money or percentage that you want to achieve.
When you decide to start trading or you are already trading but still struggling with risk and money management you should follow my advice to improve your trading.
I will give you few things to consider when you are trading forex markets.
I will give you 4 tips to follow to become more profitable:
1.Don't risk more than 3% of your total capital!
-Lets say you have 1000$ account and you want to start trading,you decide to risk 3% of your capital and that is 30$ with risk reward ratio 1:1 and you won 6 trades,you made +30$ of total profit.You have 60% win rate and you made only 3% of total return.WHY?I will explain in next paragraph!
2.Focus on RISK REWARD RATIO!
-With proper RISK REWARD RATIO you can win more % and more money while you have less than 60% win rate,let me explain!
Lets say you have 1000$ on your account and you decide to enter a trade.You are willing to risk 3% of your total capital BUT now your RISK REWARD RATIO is 1:3
What that means? That means that you are risking 3% to make 9% and with even lower win ratio you can be still profitable,you can survive this long term game!
-Lets say you have 60% win ratio like in previous situation but with 1:3 RISK REWARD RATIO.You won 6 trades and lose 4 BUT you lost 4% and you make 18% and at the end that is +12% of total return on your capital.You see same win ratio percentage but with way more better results than with 1:1 RISK REWARD RATIO!
-You lost 40$(4% of total account balance) and you win 180$(18% of total account balance).
-You put stop loss lets say 50 pips and you put take profit at 150 pips for example.
3.Let winners run and cut your losses at proper time!
-Lets say you put your stop loss 100 pips above you sell order and the price went strong bullish and you see that the price will hit your stop loss but you hope that trend will reverse or something like that,...Don't do that! WHY?
In trading you should be aware that your emotions will affect your final results!
-When trading you will feel lot of different emotions such as;fear,joy,hope,greed,impatience and so on.
Let me explain something about that emotions for you!
-FEAR-You face fear in few situations,first situation is when your trade is in profit but you have fear of losing that trade and you close with few pips in profit instead letting it run until profit target,...Second situation where you face fear is when you put too much orders of same pair and all pairs went in negative direction.
-ADVICE FOR YOU:Risk amount that you can cover with win trades,lets say risk 1 to get 3 and if you lose 3 trades you will cover your loses with that one trade and do not open to much same positions!
-JOY;Joy is good in life but in trading can be very very bad!WHY???
Lets say you won 3 trades in the row and now you feel very happy and you think that you are master of trading now,...In next trade you decide to put bigger lot and you lose that trade,What now? In one trade you lost all your profit from your previous win trades or even more!
-ADVICE FOR YOU:Sometimes you will win sometimes you will lose but that is part of the game,it is okay to celebrate your wins but you need to be aware that loses are part of the game too.Also when you win some trades do not increase your lot to much because you think you are now master of forex.
-HOPE;It is good to have hope in life(health,health of your family) but in trading hope can erase you all account balance!HOW?
-Lets say you put trade and you see that trade is going in wrong direction and you know that price will hit your stop loss but you HOPE that trend is going to change somehow but at the end you ended up with loss,and you known that you are going to lose and you did not cut off that trade because of HOPE!
-ADVICE FOR YOU;Cut off your losing trades and let your winners run!
-GREED;Remember this;BEARS WIN,BULLS WIN BUT PIGS ALWAYS GET SLAUGHTERED!-What that means?Pigs are greedy and greed will destroy your confidence and your account balance.
-ADVICE FOR YOU;Let your winners run and don not be greedy when you see little profit and you decide to close the trade,do not over trade,if you have bad day,you have more loses than wins,do not trade more because all you want is profit.You will have new opportunity tomorrow!
-IMPATIENCE:Impatience is big enemy of traders!Always be patient and disciplined about your trading!
4. 30% AND STILL PROFITABLE?-Do not focus on money focus on %
-I will show you simple formula how to calculate your RISK REWARD RATIO and this is how it goes;
-1:3 risk reward ratio with 30% win rate, so you have 7 loses and 3 wins if you take 10 trades.
= -7x1+3x3
= -7+9
= +2%
I will explain you why is like this;
-You lose 7 trades and per every trade you lose 1% so you lost 7 trades and that is 7%
-You won just 3 trades BUT with 1:3 risk reward you get for every win 3% in return so that is 3x3=9%
At the end you ended up with +2% in profit with just 30% win rate!
Lets do another example but with 1:4 RISK REWARD RATIO
-1:4 risk reward ratio with 30% win rate,you lose 7 and you win 3 if you take 10 trades.
= -7x1+3x4
= -7+12
= +5%
-Look at this now 30% win rate and you are still profitable!
-With 1:4 risk reward ratio you can lose 7 trades and win JUST 3 trades and you are still profitable!
-You lose 7(-7x1 ) trades but for every trade that you lose,you lose 1% and for every win trade you win 4% in return so that is 3x4=12
-At the end you ended up with +5% in profit with just 30% win ratio!
5.CONCLUSION
At the end i will tell you what you need to learn from this;
-Don not risk more than 3%
-Focus on RISK REWARD RATIO
-Do not let emotions ruin your trading
-Do not focus on money focus on %(total return at the end of trade)
THANK YOU SO MUCH FOR READING THIS TUTORIAL ABOUT TRADING PSYCHOLOGY!
-If you like this content please support me with like and follow me for more new tutorials and analysis!

Bitcoin - Big players are using these levels, so why not you? Before reading, please show me some love by liking and commenting! It's free, so why not?
In this post I want to show you the power of the Golden Pocket (0.618 -0.65 Fibonacci retracement). After one year in a downtrend, we finally saw that price increased and reached a high of $13920 on Bitmex.
But why did the price stop exactly at this level?
For those who think that TA is not working, here is the answer:
Fibonacci is a fantastic tool that works in all markets of the world, and when you understand how to use it, it make the difference between an amateur and a pro trader.
In this example, since we are looking for a short opportunity, we just took the high that we reached the 11 December 2017 and the low of 10 December 2018. And what do you notice? Yes, price stopped exactly at this Golden Pocket.
Is this a coincidence? Not at all.
Why this level is very important and why do you see price rejection most of the time at this level?
Because big players are using it, financial institutions with large capitals that have very complex trading algorithm use it every single day, whether it is for scalping, day trading or swing trading.
Now when using the Golden Pocket we don't want to blindly long or short at this level. What we are looking for is confluence with at least something else.
In this case, what made this trade a high probability one is the fact that the Golden pocket was sitting exactly at the previous weekly level of $13873 (previous support that became resistance) which is enough of a confluence to take the trade.
Big players are using those levels, so why not you?
If you love this content please support me by sharing, commenting and following me! Thank you and ...
Have an amazing day!

[ALCOA] HOW TO TRADE A CORRECTIVE STRUCTUREGood morning Traders!
This strategy is very simple and clear, it tells us "what to watch, entry, target and stop loss" .
Our idea of technical rebound must be confirmed with a first bullish leg (rally), so if this event does not happen, we will not go looking for a long position. If instead there will be a rally, we will wait for pullback (often around 50%/62%) and we will try to take a long position on the completion of the corrective structure (ABC). Stop Loss below the previous low.
To complete this strategy, you need to calculate an appropriate size (Money Management)
If you think our analyzes are useful, support us with a simple "Like", thank you and trade with care!
Cheers.

THE TREND IS YOUR FRIEND... but don't trend trade!!As you have probably heard do not trade against the trend. I'm going to assume you know what this means but if you don't read the bottom paragraph first.
Trading with the trend is obviously much more beneficial to us, and its clear why we shouldn't go against it. But have you tried being a trend trader? Aka a person who tries to identify trends and rides these huge moves out and scales in along the way?
For starters markets range 90% of the time, so only in 10% of market conditions are you going to succeed. Assuming you don't miss the big move because of all the previous losers and break evens you had in ranging conditions which filled you full of self doubt.
There are people who successfully trend trade, and I ask myself why bother??? It is such a struggle, you have to go through so many loosing streaks and keep calm and collected until that big move comes and you're in on it. For me that is too much stress and too much of a strain on my brain.
Trade with the trend when there is one of course. Only buy if there is a clear uptrend and sell if there is a downtrend. But in my advice I would steer clear of trying to follow the trend orcatch these big moves; you'll get chopped up hard in between!
I like it simple. See where people just got wiped out by the banks and follow the big boys.
Do you want to join our gang Haha?
You stay classy San Diego.
***** Trading with the trend is only buying in an uptrend, and only selling in a downtrend, if you do not know what a trend is, message me or google "How to identify a trend in trading" *****

VIX Swing Trade Strategy The swing trade logic in VIX focuses on long term historic price action. There is always going to be volatility in the market and the "bottom" is historically between $11.50 - $13.50. When the VIX drops below $13.50 we would want to go long with an options spread (such as the VVS options strategy) and when the VIX rises above $24.50 we would want to go short with an options spread (such as a credit spread).
We can also run a skewed Iron Condor when the VIX is below $13.50 with the same logic: skew the Iron Condor with the "risk" on the low side and a "breakeven" to the top side. This allows us to profit from a "sustained" low VIX while also protecting our trade from a top-side breakout. We do not need to protect our trade from a "downside breakout" and we can set the breakeven on the bottom near the $11.50 range.
VVS - unlimited top-side profit potential by developing a call debit spread with an added put option to finance our trade.
Skewed Iron Condor - "status quo" capped profit potential with "top-side" breakout protection
Bearish Credit Spread - Call Credit Spread focuses on selling into strength after a spike in the VIX , leaning on drag and time

The process to becoming a traderIntro:
Imo most hedge funds are bad, just marketters trying to get as much funds under management as possible.
Alot of traders are not speculators but execute orders for clients, sometimes arbitrage, etc.
Those that do speculate are often (most of the time?) degen gamblers that are in the red in their entire career but have some very green years where they get a big bonus and red years. So you end up seing them drive ferraris even thought they're not even profitable. Dumb system.
And once in a while you see rogue traders, they manage to lose millions to billions with all sorts of checks in place (maybe, just maybe, some are set up but some are clearly not for sure).
All the stock funds, they consistently under perform the Snp... so...
And most institution traders, when they try going solo, guess what? They fail.
Big banks get fined all the time for cheating.
They are actually mostly garbage.
Floor traders same story, when they had an unfair advantage and could front run their clients they were making tons of cash and once came electronic trading they all vanished. They were done. None was heard from again. I haven't heard of a single trader making money since then. Now robinhood hft clients algos do all the front running.
Lmao which reminds me of hearing people that waited 2 minutes to get filled on small orders on big volume companies, no suspicious at all XD It's actually hiralous. Like children. So obvious.
THESE ARE MY COMMANDMENTS. This applies to a new trader, in this order. But to every one too even profitable... just some steps might not be necessary anymore or can be fast forwarded. New traders are the ones that need it more but I just know profitable traders are the ones that look at this kind of info and care more about it. That's why they are profitable.
1- Thou shalt: Set your goals
Conserve Capital, Make Money, Increase Bet & Account Size.
Have realistic goals, try running the numbers to see if it is possible (example "I want to turn 1000 in 100,000 in 1 year oh for this I need to make nearly 10% every single week how much do I need to risk for that will I blow up oh yes I will with 99% odds therefore this goal is too ambitious and anyway I cannot take positions big enough for this").
1 of your goals will always be: be patient. This will take time so accept it.
2- Thou shalt: Spend several hours a day reading & watching videos.
Just absorb all the knowledge. You can make it fun. Social networks, youtube, articles, trading view, documentaries...
It's going to take a while anyway so take it easy. It's better of course if you have an absolute obsession and can't even get enough ;)
16 hours a day was a slow day for me when I started. I wanted MORE. Typically I slept 6 hours and read or looked at videos 18 hours. Idk what's wrong with me.
Well it's not like there is anything else to do in this pointless life is there, I think something is wrong with casuals that like to do nothing simply exist.
During this time have fun on a demo account or better a live one with micro lots. You will very probably lose money so have a tiny account with tiny sizes. Make sure whatever happen you won't owe 3 millions to your broker. EU has account protection now so whatever.
3- Thou shalt: Look at charts and backtest. A lot.
No skipping this. It may be boring but you ABSOLUTELY HAVE TO do it. I'm going to write a huge paragraph on this.
It shouldn't be too boring either, if it is, speculating is not for you, it's fine, go find something else there are plenty of other things to do, you don't even have to leave finance you can be an investor.
There is so much to look at. I recommend starting slowly because you can quickly get overwhelmed with too much info, too much ifs, trying to overoptimize.
I would personally recomment getting familiar with charts, looking at ideas, have fun just clic play, follow trades and see what happens, get a feel. This can go for a couple of months. You should not become stubborn in that time and be persuaded that some things work some things don't.
I have been backtesting for ever, but in particular in 2017-2018 I spent over 12 months looking at charts and noting what happened. I could not stop, I did it at home, I did it in the morning, I did it at night, I did it in the train I did it at work. There must have been a period of at least 6 months where I was completely addicted and just backtest charts more than 12 hours a day.
This is what it takes. I was looking for turn based video games just so I can alt tab and grind little by little without losing my mind.
I started just looking at charts but ultimately I filled excels with data, and I made it a little more complicated where I looked at a chart and noted the various levels the trend the EW count fib what drives the market etc. So it wasn't just checking a simple indicator or line and noting what happened but actually more advanced with "full" analysis, each example would take me 5 to 50 minutes (if I wanted to really dive in depth).
I just ran a search on a drive that contains such screenshots going from november 2018 to today. There is over 10,000 screenshots. I clic on a random one, an old one. Some indicators are on. Divergence + resistance. I noted how far past the peak it went, and how far down it went. This is how I know where to enter, where to set SL, what targets to aim for what to expect.
10,000 screenshot in a year. I haven't done much in 2019. That's 27 a day, but really more like 50 a day during 2018. 10 minutes each only would mean 8 hours a day which is more or less what I did in 2017 & 2018. And 8 hours watching videos etc.
THIS IS WHAT IT TAKES.
"It is harder than competing in the Olympics". This means something.
They don't say this just to mess around.
I can assure you less than 5% succeed, I believe it is less than 1%.
EU brokers say "78% of accounts lose money" this does not mean that 22% of new traders make money, it does not even mean that 22% of traders currently on the platform do. The 22% count takes into account all traders that have been active for a very long time, the 78% number is almost entirely made up of new traders that will soon quit. So for 100 traders on the platform you have 22 winners 78 losers even if we assume the 22 are making real money and not just short term lucky (which I KNOW is not the case) understand the 22 will still be here in the next 3 months but the 48/78 will be gone, and replaced by 48 new losers, then 3 months after 48 new losers then next 3 months 48 new losers and in a year you actually had: 22 winners, 78 + 48 + 48 + 48 = 222 losers.
In 10 years ==> 22 winners 2222 losers or 1% winners.
It's simplified just to make a point.
When I started I looked for data, I didn't want to go through the hours, but after a while, a few months I understand I just had to bite the bullet.
Let me guide you on the first steps:
Go look at Oil, draw every swing high & low and look at what the price did. A basic backtest like this might be easy to automate.
It takes seconds at first, when you just look at the basics.
You need a database to know what works what doesn't how often etc.
It's not that hard. At least start with the basics like this. Then you'll decide what next maybe you'll want to take it slowly if you can't be spending 8-16 hours a day doing this like insane people like me. I'm sure alot can be automated. If you want to be a discretionary trader like all the famous ones back in the day eventually you will have to go manual and do alot of thinking, what is good is you have the internet full of articles and other at your fingertip, you can know anything you want instantly, there is tremendous info on everything.
Empty your mind and do it. Do not overthink it or it will drive you crazeeeeeey. Focus on 1 pattern at a time. Over and over until you have stats with a sample size of hundreds and you became really comfy about it charts look less random already.
Depending on your own capacities, patterns might pop out often. History does repeat itself. Here I don't know how much you can work on this. Pattern recognition (Both as you backtest and in real time as they are created) is pretty much dictated by IQ. And then you need a good enough memory to remember what you backtested or experienced.
This is a big reason why I think an IQ of at least 110 is necessary. Anyway even research has shown it made a big difference. Warren Buffet says past 125 it doesn't make a difference for investing. Propably does but with diminishing returns for speculating. It's not like these patterns are rocket science either an IQ of 190 isn't necessary lol.
But the faster you see them... And memory access is as important.
OF COURSE REMEMBER: you spend alot of time analysing the market. You have time to remember etc. You don't just sit 1 hour a day look at charts and instantly guess what to do, this is what trading educators do. This is why they sell courses to make money.
You might have heard of Paul Tudor Jones that traded the 1987 market crash by comparing it to the crash of 1929. He saw the situation was similar and then analysed it in depth...
Doing this is what will make the difference. Being smart is an advantage, and necessary and those that say otherwise are idiots but it won't make the difference.
It is like boxing. The "purists" will not allow you to lift weight and force their trainees to focus on the technic, and yes, muscles is not what makes a champion, even thought they all have muscles. The best boxers are not the ones with the biggest muscles. (That said weight categories are there for a reason don't go suicide on someone 30 kilos heavier purists are right to make people focus on technic but they are a little crazy).
Put in the hours, the boring grinding work. This is where your gains will be made. Knowledge and a database of probabilities. I repeat myself it should not be TOO boring either.
This is the big secret. This is the big main thing that separates REAL trader from jokers.
Who has spent this much time (thousands of hours) doing this? Make sure you take money from others by putting in more PRODUCTIVE hours in than they did.
4. Thou shalt: Choose your tools.
You choose what markets you were interested in during steps 2 & 3. May I recommend futures? :D You do not care about scaling to billions on your 5000 bucks account, you can even trade orange juice. You also have an idea of what strategy you will use and your time frames (please no daytrading).
You probably already chose TradingView MT45 Ninja Trader or Sierra Charts for your backtesting. Investing dot com uses TV charting tools and has some tickers they don't (Nickel Zinc...)
Once your charting tool(s) is chosen, next you will choose:
- A solid broker with good reputation, commissions, execution. Not a scammer stop hunting and selling order flow. Price is important but quality before price. Your goal is to make money not zero comissions so you lose more slowly.
- News service: CNBC as a counter indicator, FT, Bloomberg, Twitter, Broker feed, fxfactory, forums, tradingview chat & ideas, WSJ, and so on. Get comfy.
- A good alert system (probably included with the charting one).
- Your setup: PC internet desk.
5. Thou shalt: Capital management.
- Choose how your money is spread around, how much is with a specific broker
I spread my money between brokers, and bank accounts. And even crypto wallets actually. It is almost impossible something crazy happens that way. I don't just mean a broker going bankrupt.
And it's convenient too, you can have a broker for your 12 hours to 2 week trades, another for longer ones multi months, and an account for holding stocks years...
- Choose how much you want to risk per trade.
- Choose how much you want to risk over a certain period (a month?)
- Allocate capital and risk per strategy/broker/timeframe
- Calculate and choose your drawdown for the per trade risk you have
- Set a max drawdown, what to do when you lose a certain amount, what to do when you win a certain amount
6. Thou shalt: Set rules, decide on how you execute.
Decide on what to do once you have decided your bias/goal for the month/week/day (please no no daytrading yikes):
- What technical patterns are you looking for or news you are waiting for, or Trump tweet ;)
- Where do you want to see this continuation or reversal pattern? (Typical answers: At a certain resistance or just below or just above)
- When do you want to see the pattern (not just before a central bank meeting, never)
- Where exactly - almost exactly - will you enter to have a risk reward that will make you profitable? NO FOMO.
7. Thou shalt: Plan your trade management. And your trade management system.
You're going to need a general method for managing trades once you got in.
And you're going to need a general method for managing specific trades you got yourself into.
What do you want to see? What do you not want to see? Do you exit as soon as Trump tweets? Do you trail your stop? What are your targets? How fast should they be reached? Etc.
Up to your and your backtest + experience.
8. Thou shalt: Learn to know yourself.
Know if losing 10 in a row makes you rage. Decide how to avoid raging. Do you have a hard time staying in trades, and get nervous when they reverse? (LOL COWARD WEAKLING)
This step can be skipped if you are a super alpha bodybuilding mastermind with an ego over 9000 and testicles so big you can barely walk. Umm your ego should not be making you risk 90% per trade thought.
But seriously, I don't have much to say on the "psychology" part. I am not sure it really is a big deal, just something "trading educators" say all the time. I just don't understand how people can become illogical and fail for no real reason just "their feelings"
Pretty sure all the best have zero psychology issues and those that say they sometimes might have, are just losers looking for excuses to bathe in their own mediocrity.
I am happy when I have a big winner that keeps going my way, and I get angry if I lose 10 or more in a row. Sorry but it has zero impact on my trading. ZERO.
Doesn't mean you can't be successful if you have some issues. By the way, I read somewhere psychopaths did not do very well, and why should they? Having no empathy and manipulating people won't help when dealing with the market. Ignore the "be a robot" nonsense it's coming from struggling try hards 3000 games still gold 4. Getting euphoric and angry makes it fun and keeps it interesting. Tyson was angry and still number 1 prodigee. Just don't lose control and start biting Evander Holyfield ear. If you have serious mental issues do not trade. If you attempted suicide in the past trust me DO NOT TRADE. I think being "emotionless robot" isn't even good, being healthy and balanced is optimal. Probably like what is asked of astronauts. Ok enough on this.
This is more important and makes sense:
Apart from the tender feelings aspect, you need to ignore your weaknesses and play on your strength. You can work on weaknesses but usually it's best to find a trick to ignore them (just don't trade at all) and really focus on what you naturally are good at.
9. Thou shalt: Have a routine.
All I can say is I usually look at all of my currencies (about a dozen currencies and 20 pairs) and futures (half a dozen) during the week end (on top of continuously following what is going on), set/reset alerts. Plan what I want to see for the week, I tag the 3-4 tickers I am interested in (such as AUDUSD and EURJPY I posted about and will never get filled on).
I have my habits and all but it's not all written down and I don't even know what I do apart from what I just said lol.
10. Thou shalt: Hold a journal.
I kept the best for last: Keep a log of all your bets.
This is not a suggestion.
Also screenshot your past trades after they are complete + you let a while pass.
Excel is good here. Note the pair, note the date, note a couple things. Was the trade a winner? Then it's up to you. You could write what EW extension it was. You could note if you bent the rules. You could not what pattern you entered on (hammer flag double top...). You could write what broker it was with. You could write what was the long/short positions. What was the market conditions (negative rates with bad unemployement news and price in sideways). And so on, figure it out.
Focus on doing what works, and the opposite of what loses money, breakeven has no edge. Note how the market evolves. Improve strategies. The journals help you know yourself.
You get to figure out your performance over hundreds of trades, if it's good enough maybe you can afford to increase the risk from 1% to 1.25% or something.
Think about noting the trades you missed out or decided not to take too. You will learn something from those too.
You will get so much out of it. Don't forget to go re-analyse your past trades and spend time learning from your journal.
Practice does not make perfect. You can practice for 10,000 hours and still remain at step 0 (go take a look crossfit idiots god I hate them so much, it's incredibly good at getting disabling injuries thought, look at pot belly "social gym activities" goers). Perfect practice makes perfect. This includes having a journal and analysing your results constantly.
11: The facts
Surprise bonus one.
Always look at the data... The facts... It's obvious and most don't do this.
Don't listen to "some dude" because you think he has authority because his grandpa called the 1929 crash. What is this? Divination?
There is no authority there is no consensus there is just facts.
Complete autists end up disconnected from everything and ignoring everything they call it noise.
If you need to do this I think it's too much and just no.
How hard is it? Form a clear logical reasoning using facts. Then intuition comes into play to here I can't help you if you naturally have a tendency to overly focus on bad news and act on it I'm sure you can work on this flaw a bit, but not sure you can be saved. You need "good" intuition. Ye I guess this is lottery at birth probably.
Just try your best to stick to the facts. Learn to.
Do what it takes: Write down a system, here is a random example (you'll want to add steps, detail, and write down your strategy for each step) ==>
Easier to do things right & to stick to facts when you have this. That's not the only advantage.
This is not going to have its own number.
I am still working on designing my own system. My problem is I want to grab as many good opportunities as I want but I can't be spending 48 hours a day analysing everything I don't have a time machine. And I don't even want to spend 12 hours aggressively hunting as fast as I can.
So for me, do I look for patterns on 20 charts every 4 hours? Or do I analysing charts tag a few and then look for patterns on these few? Do I make a bit of both?
It's very uncomfortable right now, really, giving me a headache, and I'm analysing the optimal procedure, that will make it more comfortable and efficient.
I used some inspiration from a Trader Dante (Tom Dante) video on youtube, it is certainly an interesting presentation. You can find it easilly. "A blueprint for Trading Success".

[b]USDCHF – USD pair is showing positivity over market[/b]USDCHF – USD pair is showing positivity over market -
Trend: Buy/ Neutral
Support/Resistance:
R3: 1.00704
R3: 1.00280
R2: 1.00094
R1: 0.99750
S1: 0.99491
S2: 0.99040
Price action:
In this case, when buyers will break first resistance, it is important to follow steps as correction and momentum flow before buy is confirmed. We are positive for buy in this case, but after our strategy will prove timing and risk management.
Potencial trade idea:
Bulls targets:
T1 = 1.00094
T2 = 1.00280
T3 = 1.00704
Bears targets:
T1 = 0.99040
NOTE – We are trading USDCHF via the preferred trading setups
Disclamer1: We have to wait for a currency pair to trade after news are reliased. This might be a short correction, or price will give us moving dirrection after news are reliased.
Disclaimer2: Martin's views on the Chart analysis is ment as a trading advice for education terms; Education terms include: trading consistency to everyone who is reading this blog; for every advance student and for every Elite student who is using this analysis for managing his equity by Elite strategy and custom indicator. This analysis is understandable and transparent for all Elite students. This is a free content which is based from Academy in term of transparency to support and following progress to everyone. We know that there is always possible way that market can pull you out even when you follow our analysis blog and advice for a trade. We don't publish where you have to have your risk management – Stop Loss, because, it would not be fair to Elite members, who learned this techniques in our Elite course.
ELITEFXACADEMY

GBPJPY: Case study. From start to finish. [Trading System]I am glad I (re-) found out retail traders have a losing edge, now I don't have to pretend I care about news / fundamentals moving the market like there is a secret :D
Only really important thing is getting the trend right and looking on the economic calendar at the days with a red circle next to them (unless you want a 3 ATR slippage).
Trading is cool (not really), it's like you are a detective analysing cases, and then you land on the mission area and you become a sniper carefully preparing his execution, and then bam take the shot. A detective with a snipar. Grrr!
In this case, first here are the support areas (every strategy expect maybe super short term and long term) need support at its core, well at least when it comes to currencies & hard commodities.
Requirements:
- Being aware of the high TF trend and patterns (weekly)
- Knowing what the daily trend is
- Having drawn the support areas via daily chart
- Having checked technicals, such as EW counts, fibs, trendlines, MA's etc...
- Noticing all the resistance above (low risk and buying probably gets absorbed)
- Having a plan in advance (what do I expect to happen what will I look at / look for)
- Being aware of events for the week (central bank decisions...)
- Noticing how the price is rejecting resistance ==> High probability
- Noting how far the next area of support is ==> Big reward / low risk
- Preparing your evacuation plan (targets, approximate SL mostly)
- Zooming in (look for a specific reaction to take the shot)
- Taking the shot like a boss
- Preparing for extraction (trail stop set a limit order etc)
- Running away with the tears of those that went opposite, and their money.
- Logging it all and analysing it...
Ok the list is long actually. But it's simple. When you know it all and have a few months of correct practice under your belt.
If you do not have a "strategy" / system already, note the list down, draw it if you like, add some steps / details if necessary, and follow all steps until it becomes second nature.
Every week (if you trade short term like me) review your charts and note your plan/expectations, then every day every few hours look at what the price is doing, etc.
Gets natural with time. Becomes a habit.
Having a system like this is not an option by the way.
I saw some people I think it was in prop firms they did this: they have a little paper every day where they write their expectations and plan for the day, and once the day is over (they do intraday) they note on the paper in a rectangle what happened what they did etc.
This is actually awesome.
Maybe I should do something pretty like this via trading view. Right now I use excel and screenshots.
I watch > 20 charts thought so noting my plan for each on this site might get boring, not sure how useful it would be...
I should do something more than just a few notes in excel and a post trade screenshot.
I did spend an awful amount of time on my past trades thought, the only thing I really missed was what I expected before the trade setup my general bias.

Why I do not like breakouts (even if they are great)As you can see on this chart there were a couple of great breakouts, that went straight in the right direction.
We also know that trying to catch tops & bottoms is a noob trap, with all the really ungifted new traders that are 95% certain to fail & quit obssessed with catching bottoms (go check the Bitcoin bull community they have a new bottom every 3 months).
So why don't I like breakouts that much? Here is my list of reasons:
1- Even after a couple of years, I prefer to stick to 1 group of strategies and really perfect them, become a sniper, rather than chase opportunities all the time and risk going insane (meaning overtrading).
That's definitely happening, a way or another.
2- The majority of us that do not work at citadel etc, are competing against traders with a big information and speed edge.
Not only are there directly connected to the exchange and can execute faster than lightning while your order goes throught the internet,
but they also have access to alot of the order flow (for forex banks legally simply just have it, and for stocks you got brokers selling their retail clients order flow in exchange for "free" commissions. Not sure about CME futures, might be the only ones "safe").
Your competition will KNOW FOR A FACT there is a breakout long before you. You might be able to set an order with your broker to buy a breakout but it's going to get executed like a turtle far after hft firms and other people using unfair advantages.
When you enter on a bottom if it break below you are out and don't have to worry, but in this case, winners have this tendency to go your way very quickly and you have to react fast. And of course your orders have to be set in advance no other way no one can be fast enough.
With a rounded bottom accumulation type, you have plenty of time...
Feels like a race, with a big disadvantage.
3- Which brings us to step 3. You will get scammed all the time.
Currency markets are curious, they love to go test levels before continuing in a trend.
Unless you want to have very wide stops and a bad reward to risk, the market will stop you out over and over and over and over and over before going in your direction.
I can just look at any chart and see it all over. Rather than whine about what a scam this is, why not simply take the opposite side? If the price breaks, then you place an order very far away in case it pumps like this... As close as free money we can make it without straight up profiting of a bug with a broker.
4- If you buy bottoms with the price pumping your way you are likely to experience POSITIVE slippage, with breakouts (in particular with cotadel front running you) you are likely to experience NEGATIVE slippage.
5- You will never get the whole meat of the move (but if you go for pullbacks and bottoms, you might)
Not a very important point because in practice you're not drowning in profits from giant winners with buying bottoms, but nonetheless...
6- I think it puts you in the wrong mindset, you can easilly find yourself chasing the market over and over, the strategy is literally buying into FOMO as fast as possible. Whereas if you wait for a pullback, for weeks, unless you lose patience and do something dumb, you are not going to be chasing anything but accepting what the market is going to give you.
So to sum up the main reasons for me are:
- I don't like the concept of buying into FOMO as fast as possible
- I don't want massive slippage
- I don't want to get scammed over and over with the price going against me in a minute, and my way the next
