EXAMPLE for creating a Strategy! How to make money with TA! #1Hey tradomaniacs,
most of all beginners out there (I was at this point aswell), don`t know how to create a strategy and trading plan and are not able to make money WITH the market.
At this point, I just wanna give you an example and tell you why it`s so important to have valid signals and a strategy you can trust in.
Emotions - The Cash-shredder
Emotions are the reason why 90% of all retrail-traders fail!
We, as a human being, are visceral still living in the Stone Age controlled by FEAR & GREED.
That`s why we need pre-conditions whose undertake these responsibillitys and determine our trading.
CONDITIONS are part of your Strategy and you should treat them like your BOSS telling you when to trade!
This picture does not includ important things like Stop-Loss, Take-Profit, Risk-and Moneymanagement and so on..
THIS IS one EASY example for a TREND-FOLLOW-StRATEGY, which is easy to use for beginners.
Don`t start with crazy shit like Gartley, S/H/S and other Patterns whose have extra conditions and things to know that you can`t know as beginners.
I will tell you more about this in another post it`s late here in germany! ;-P
I just want this to be an inspiration for lost beginners.
Peace and happy learning
Irasor
trading2ez
PS: Have at least 4 of 6 conditions!
Strategy!

Intermediate Trading Strategy - Part 1IMPORTANT NOTE: If you are looking for a shortcut then this is not for you! This is for individuals who are enthusiastic about putting in the time and effort but may lack the structure.
I plan out my trades through in depth technical analysis, risk management and market research. I believe that consistency is the most important factor in regards to trading profitably. A traders success is determined more by the consistency of their approach than it is by the quantity or quality of indicators being used.
Over the long run, a consistent process combined with a sound strategy will net a disciplined trader far greater returns than the market average.
If you have any questions then feel free to leave a comment or send a private message.
Click here for Sawcruhteez’ Trading Process
Before Making an Entry
Identify Trend
Higher highs and higher lows = bull market
Lower highs and lower lows = bear market
Lower highs and higher lows = triangle continuation pattern
Equal highs and equal lows = Consolidation/Range
Tyler Jenks’ Consensio
Price > Short term MA > Long term MA = Bull Market
-I like to use the 50 & 128 day MA’s by default for crypto. For traditional markets I use the 200 MA.
-For short term price movements (1 month or less) I like to use exponential moving averages. 12 & 26 EMA for crypto and for traditional markets the 9 & 21 EMA.
Welles Wilder’s ADX
If ADX > 25 then trending market
If ADX < 20 then no trend is present
If +DI > -DI then bull trend
If -DI < +DI then bear trend
In extreme circumstances I will bet against the trend. This will only happen when the risk:reward is too favorable to pass up.
Identify Time Horizon
Investment
Is this a 10+ year investment? If so then I will dollar cost average my way in and not even look at the charts or listen to the news. Investments are not meant to be babysat, they are meant to develop over time.
Bet it then forget it!
Position Trade
Buy/sell breakouts and attempt to hold on for the duration of the trend. This is done through technical analysis and trailing stop losses. If I am in a position trade I will tend to it daily by looking at charts and managing stop losses. It is not required to ‘baby-sit’ the position by watching it all day and this approach is actively discouraged.
Position traders do not concern themselves with intraday movements. Managing the position too closely will often cause traders to make mistakes they wouldn’t have otherwise such as: taking profit too early or adjusting stop losses in the heat of the moment.
This is my prefered method of trading for a number of reasons. Primarily it is because I like to live a balanced life. I like to be able to set my stop loss and forget about it while I am out playing golf, skiing or at the gym.
Time horizon for a position trade is often a couple months or even a year+
Swing Trade
“Markets do not go straight up, nor do they go straight down.” There is an ebb and a flow to the price movements. Swing traders try to capitalize on the daily - weekly price movements. Is price at resistance? Sell. Is price at support? Buy.
Swing traders have well defined price targets. They can trade within ranges or in trending markets but they generally do not hold through significant resistance in order to speculate on the price movement. If it does breakthrough resistance then they can re enter without as much risk.
Day trade
Mostly scalpers and high frequency robots. In traditional markets the price generally isn’t very volatile on an intra-day basis so most traders will use high leverage. This will allow them to 10X, 50X or even 100X a 1% price movement in the underlying asset.
In crypto the market is volatile enough for day traders to make a very handsome profit without using leverage. This approach is still the extremely risky.

How my strategy could have saved people on a huge short squeezeHey everyone, YoungShkreli here
Every now and again, I reflect on my trades and see if I can pull something from my past that will help you all in the future. So gather around the campfire, have some smores, papa Shkreli is going to tell you all a story.
The date is April 11th 2018. Tomorrow, there will be one of the biggest, if not the biggest, short squeezes in Bitcoin history. Everyone is bearish and just the day before, so was I. I thought that was the move that was going to take us down to $5,000 (I've been waiting to hit this number since December 2017). My feeling was that bitcoin was going to do it, it was going to hit $5,000 and I was going to increase my bitcoin stack by a ton. However, the ashi closed green after a long bear move and a low RSI reading, so instead of shorting like the rest, I went and bought bitcoin (unfortunately, I wasn't wise enough to go 1000000x long). Let's recap, my feelings were telling me to short, but my strategy was telling me to long. Which did I listen to? My STRATEGY.
Guys, this is not an article about how you have to be contrarian (although you should be), this is an article about sticking to the strategy that you know works. I can't stress this enough. A good trader is not someone who can guess where the market is going all the time (no one can, no one is a wizard). A good trader is one who has developed a winning strategy, controls risk, and knows when he is wrong. You can be wrong MOST OF THE TIME and still make a TON of money. Before I adopted my most recent strategy (which is levels above what I have used before and seen here or anywhere), I had the other two things and that was good enough for me. I remember during one bad run of luck, I got 8 TRADES IN A ROW incorrectly. That said, on each one of them, I controlled the loss so that they were all small. When I got to the ninth trade, I was right and I was right big. I was right so big that it cancelled out the previous losing trades by a cool 8%. If you are trading a big account, 8% is a big deal.
SUMMARY:
Trading is not about knowing where the market is going, you can't possibly know that. Trading is about being emotionless and being willing to be wrong, controlling risk, and hopefully always finding ways to make your strategy better.
If you liked this post, please like my work and follow me. It will help both of us: I can only really help people in a big way when I'm on the top trader list - I will sell software, strategies, write more etc. as well as continue to provide free material.
Notice that in addition to selling things for money, I will always provide a TON of free material until I die, why? Because I am only where I am today as the result of other people teaching me things for free. If it weren't for free resources online about bitcoin and trading, I would not have done that well for myself. Trading has changed my entire life because trading bitcoin got me into learning fundamental analysis for stocks, which got me reading finance books, which got me reading any type of book, which taught me skills, which got me into entrepreneurship etc. I don't care about money, I care about being successful and helping people. That is what life is about: taking care of yourself and those who support you.
Stay humble guys, we all stand on the shoulders of giants :')
-YoungShkreli
P.S. I already know what my next educational post is going to be about. I love trading, you guys. hint: it's going to be about code I wrote and Ray Dalio

My 10 Rules before Taking a Trade.1 : Dessiner les Niveaux clés et la Tendance.
(a) Trend and Supports/Resistances Majeures. (12-16x timeframe)
(b) Trend et Support/Resistance on shorter term(6 or 8 time short). Draw the most recurrent Fibonaccis retracements or/and extensions.
(c) Check Action Price on your trading timeframe. Draw short-term fibos.
2: Find a Signal
Only valid on KEY LEVEL.
Ideally respect the trend, with exception of reversal trades.
No signal. STAY FIAT.
Ignore Signals if :
-Low volume.
-Complex retracement.
-Sloppy action price.
3 : Find Confluences.
Is this scenario direction or targets the same if i use different projections? Different Bias? Does market profile validate my fibo support?
Confluences help classify your potential setups by quality and help reduce exposure and overtrading.
4 : Plan the trade.
We have the entries, the targets. Congrats that was the easy part, now you need to find invalidations, partial profit targets and when to rise your stops. For advanced trader, time to plan your time related stoploss, potential re-entries and how you plan to ladder your entries.
Reminder : The closer your stop is, the best is your ratio and so are your earnings, in the long game, ladder entries will boost your profits.
5 : Calculate your REALISTIC Risk/Reward.
No volume on the breakout of your triangle? no reaction on your fibo level? Trump is on a twitter fury and excite the dumb money.Most of the trades are not gonna go like you planned, you're gonna need to get out or reduce your exposure for many reasons.
Being optimistic is good day to day life, when trading it's the opposite. Be Honest and Pessimist.
6 : Define Sizings and Maximal Exposures.
Up to you, i personnally use 1% for my best setups, when i'm not so confident or trading an aggressive setup probably more like 0.3%. I usually ladder my entries with 4-10 positions. Still working on it.
Reminder : A drawdown >25% brings a risk of ruin between 0.5 to 1%. My 10 years experience in risk/reward management 2 cents. This one percent HAPPENS. A human common bias is considering small percentage as irrelevant. They are very relevant, get other this bias.
In my opinion :
<1% risk per trade is MANDATORY if your capital is consequently above your cash flow.
1-3% if you cash flow afford you to rebuild your capital quickly.
>3% if you are masochist.
7 : Mental check-up
Am i calm? Do i want to trade this setup logically or am i pushed by Greed or desire of Revenge? What are my recent results? Am i emotionally involved? What are my recent results?
Winning Tilt : Care of Overtrading, loose Stop losses, passing by mandatory partial profit.
Losing Tilt : Care of Stops too tight, freezing and undertrading.
8 : Accept uncertainty and pending loss.
A drawdown is normal even to very successful traders, for exemple with 50% success rate, you are gonna frequently have a 16 consecutive losing streak. Why this trade would be exceptionnal? Don't take this trade if you are not ready to lose 16 times your stop without blinking, without complaining. If you find yourself doing that, then it's a sign you are too exposed. you DON'T HAVE to risk 1% per trade, especially if you haven't proved you are a winning trader with a long history of profitable trades. Accept this trade is almost irrelevant and part a of a bigger picture. A lifetime of profitable trades that are going to increase your capital. No more no less.
9 Backtest before exposing yourself.
Is this trade part of my bigger plan? Am i in my confort zone? Am i factually profitable with that sort of trades? If yes, Green Light.
If no, don't panic, this work is not worthless. It is very valuable to open ourselves at other technical analysis, other instruments. But no so recommended to burn some bills on it. Time to Paper test this setup, or trade it on a demo account. Make stats on it, is it better than your actual strategy? Yes, you just made yourself richer? No?Smarter then..

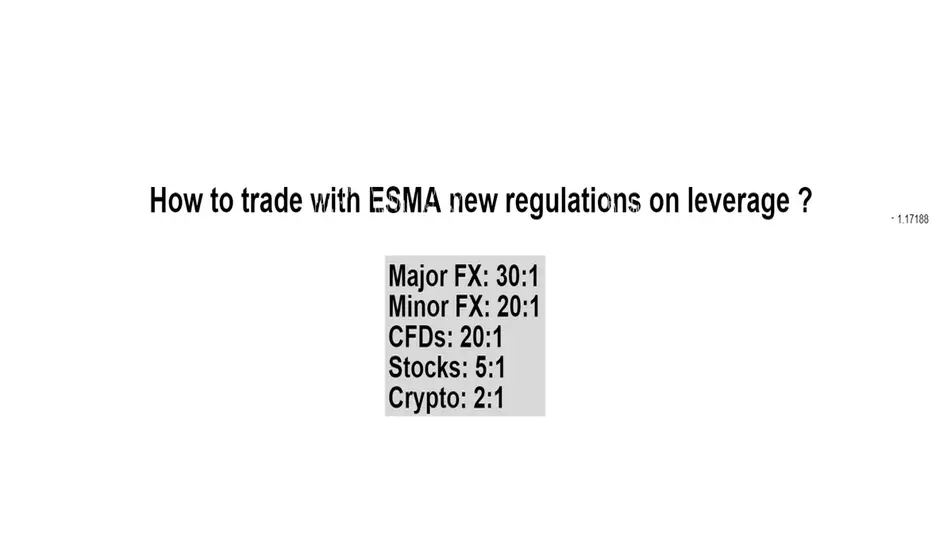
How to trade with ESMA new regulations on leverage ?Hi everyone,
Some of you may or may not know that big changes will take place on august 1st 2018 on Forex and CFDs market especially for retail clients.
ESMA for European Securities and Markets Authority decided to ban binary option and apply a drastic decrease on leverage on all financial instruments including forex, CFDs and crypto.
All UE regulated brokers are affected by these changes. Even non-UE brokers (I mean serious ones) are applying these changes. All clients from UE or not are affected by these changes. This a worldwide earthquake on trading planet.
New rules, new attitude... how to deal with these changes ?
First find below the new leverage :
Major FX: 30:1 (USD, JPY, CAD, GBP, CHF)
Minor FX: 20:1 (ALL OTHERS including AUD, NZD)
CFDs: 20:1
Stocks: 5:1
Crypto: 2:1
Before, a trader could start trading with $100 with leverage up to 400, a micro lot (0.01) required $4 margin average.
Starting august 1st a trader with a $100 account will need a required margin of $30 ON EURUSD for a micro lot (0.01).
EURUSD new magins on august 1st:
0.01 lot: $30
0.1 lot: $300
1 lot: $3000
Of course this post is not dedicated to criticize this new law but to provide ideas to deal with it and continue making money.
Normally I recommend using 0.01 lot per trade with a $1000 account but this rule can be adapted if we reduce drastically the number of opened positions simultaneously. For example, if you take only 1 trade a week in swing looking for 80 to 150 pips, you can obviously increase your lot size from 0.01 to 0.05 or even 0.1 for experimented traders.
Selecting carefully trading opportunities
The first consequence of the low leverage is the fact that you cannot open several trades simultaneously. You really need (and you won't have choice anyway) to be selective on trading ideas. Choose only opportunities with the best configurations and in which you have a really good confidence.
Strategy 1: If you have a $1000 account, you can decide to keep up to 4 trades opened at the same time with a reasonable stop loss.
If you risk 2% of your capital per trade , you could use 0.05 lot at $150 margin with a stop loss of 40 pips ($20). If you apply a risk/reward ratio of 2 or more then you can expect 80 pips ($40) on each trade.
With this strategy you must lose 20 trades in a row ($700 loss at 40 pips stop loss) before not being able anymore to place 4 trades simultaneously at 0.05 order.
You need to win 35% of your trade to be flat because of the risk/reward ration of 2 minimum. (See the attached post about risk reward ratio)
Strategy 2: If you have a $1000 account, you can decide to keep only one trade opened at the same time with a reasonable stop loss and with a bigger leverage. Assuming that you risk 5% of your capital per trade , you could use 0.1 lot at $300 margin with a stop loss of 50 pips ($50). If you apply a risk/reward ratio of 2 or more then you can expect 100 pips ($100) on each trade.
With this strategy you must lose 14 trades in a row ($700 loss at 50 pips stop loss) before not being able anymore to place a 0.1 order.
You need to win 35% of you trade to be flat because of the risk/reward ration of 2 minimum. (See the attached post about risk reward ratio)
Strategy 3: For scalpers, if you have a $1000 account, you can decide to keep only one trade opened at the same time with a reasonable stop loss and with a bigger leverage. Assuming that you risk 2.5% of your capital per trade, you could use 0.1 lot at $600 margin with a stop loss of 10 pips ($20). If you apply a risk#reward ratio of 0.5 then you can expect 5 pips profit ($100) on each trade.
With this strategy you must lose 20 trades in a row ($400 loss at 10 pips stop loss) before not being able anymore to place a 0.2 lot size trades simultaneously at 0.2 lot size. Obviously you really need to get a high winning rate to stay alive.
Hope you enjoyed this post.
Happy trading!
How I Trade BitcoinHi Traders,
Very rarely do i educate on public platforms, however i feel that this information will be hugely valuable to the wider trading community and help those who struggle to identify a trading zone.
Building a tick list of requirements prior to a trade not only provides you a higher probability of long term success, but also reduces impulsive and emotional behaviour.
In my opinion there is a huge misconception that 1 indicator is enough to become a consistently profitable trader, i feel building an area where price is likely to reverse based on multiple confluence factors will give you the 'edge' over the market that is required.
Be sure to swipe left to view all 8 trading opportunities.
Thank you for your continued support.
DISCLAIMER:
I am only providing my own trading information and basic techniques for your benefit and insight, you should apply your own due diligence and not take this information as a trade signal / strategy.

trend indicator for Binary Option 80% of profitable trades This trend indicator for binary options shows excellent results both on currency pairs and crypto currencies .
You can work on most currency pairs and on different T. F, but the settings are more adapted For M 5, M15
The indicator shows the price reversal in the form of red and green dots when the candle is closed .
buy signal.
a green/dot should appear on the indicator after the candle closes .
entering a trade at the opening of a new candle the time of the trade is one candle .
sell signal.
a red/dot should appear on the indicator after the candle closes .
entering a trade at the opening of a new candle the time of the trade is one candle .
If you strictly follow the recommendations and work within this strategy, the percentage of positive transactions is about 80 % .That allows you not to use "martingale" and stay in the black with minimal risk.
If you are interested in this indicator for access write to me in private messages ! ( comments rarely looking better to write in private messages )

Trading system for Binary Options 70-80% positive trades Hi Friends ! I decided to show how my strategy works . Quite well shows the turning point of the price .
This is a strategy for Binary Options . Perfect for those who are not much in a hurry and loves to trade on scalping (Strategy as simple and reliable)
The strategy consists of two main scripts and one auxiliary that allows you to use the free version of T. V
You can work on most currency pairs and on different T. f, but the settings are more adapted For t. f M5
Support and resistance levels are drawn and updated automatically, which is very convenient for beginners .
If you strictly follow the recommendations and work within this strategy, the percentage of positive transactions is about 80 % .That allows you not to use "martingale" and stay in the black with minimal risk.
But if you still like the martingale it is usually enough 3 rarely 4 steps. ( I advise you to use martingale only after two months of practice on this strategy )
Below are screenshots with more detailed recommendations .
How to choose the right entry point.
How to act with a false signal
As an example screenshots with statistics for 30.05.18 on EUR-USD Timeframe 5M.
If you are interested in this strategy to gain access to all three of the necessary script, please contact me in private messages !
( comments rarely looking better to write in private messages )

USDTRY - Be wary of Intervention ex-post Rapid MovesTraders layering into TRY potentially got burnt last week as the Turkish Central Bank intervened to halt the local currency's worrying devaluation by raising interest rates by a whopping 3%
Whilst i tend to let the majority of fundamental data pass me by , it often pays to atleast maintain a health awareness of key macro factors that might have a direct impact on any currency pairs you are trading or tracking (this is different to following any random commentator's subjective opinion)
While I do not like setting upside targets , it can pay to trail stops at healthy profit levels during large abnormal moves so as not to give back profits (we saw this in crypto in Dec 17) adn if we miss the big move initially wait for natural pullbacks / consolidations rather than chase an entry. There will ALWAYS be a pullback or another instruments that will offer the next big move. Worst thing to do is chase an entry through FOMO , get burnt and then be paralysed the next time a big opportunity presents itself.
Stay rational, stay calm and nimble

An Efficient Strategy Using RSIHi guys, This my first video and I wanted to share with you a simple strategy I use to find opportunities with RSI.
This strategy gives amazing results in scalping and daytrading in order to grab 15 to 25 pips per trades.
Hope you gonna like it. Do not hesitate to like it or give comments.

Scalping strategy for Binary Options 70-80% positive tradesHi Friends ! I decided to show how my strategy works . Quite well shows the turning point of the price .
This is a strategy for Binary Options . Perfect for those who are not much in a hurry and loves to trade on scalping (Strategy as simple and reliable)
The strategy consists of two main scripts and one auxiliary that allows you to use the free version of T. V
You can work on most currency pairs and on different T. f, but the settings are more adapted For t. f M5
Support and resistance levels are drawn and updated automatically, which is very convenient for beginners .
If you strictly follow the recommendations and work within this strategy, the percentage of positive transactions is about 80 % .That allows you not to use "martingale" and stay in the black with minimal risk.
But if you still like the martingale it is usually enough 3 rarely 4 steps. ( I advise you to use martingale only after two months of practice on this strategy )
Below are screenshots with more detailed recommendations .
How to choose the right entry point.
How to act with a false signal .
As an example screenshots with statistics for the last week on the EUR-USD Timeframe 5M.
statistics
14.05
15.05
16.05
17.05
18.05
If you are interested in this strategy to gain access to all three of the necessary script, please contact me in private messages !
( comments rarely looking better to write in private messages )

Lesson 5: Stop-Loss Strategy | A must needed for tradersHello Traders,
I am back with yet another helpful lesson for y'all. This one is a must needed for any trader, and it is extremely important to get this right. A lot of people face a situation when they buy a coin at a higher price, and it just starts going down, and you just hold it in the hopes that it will go up soon. But instead, it just keeps going down more and more. Believe it or not there are many people out there who are still holding that coin because of just one mistake. They did not had a stop-loss order opened after they bought a coin. If they had a stop-loss order opened up, they would have been out at a minimal loss rather than waiting few months for the coin to come back up. If they had set up a stop-loss order, they could've bought the coin at its lowest, and then earned all those profits in lesser time.
Don't you worry. I will go over this in a simple way so you can understand this topic really well. Keep in mind this is extremely important to cut your losses especially when we are not sure about the direction that BTC is heading in.
Below are the topics we will go over today:
What is a Stop-Loss Order?
Strategize your Stop-Loss order price
Advantages of Stop-Loss
Disadvantages of Stop-Loss
Note: For the above topic, please refer to the BTC chart above.
Lets go over the topics now.
What is a Stop-Loss order?
A Stop-Loss order is an order set by a trader which will sell the coin if its price reaches below a set price (Stop Price) in this case. Basically if we buy a coin at $10, and you set a stop price at $8. Now, if the coin goes below $8, and if you have a Stop-Loss order up, it will open a Limit Order at the limit price you gave once the price reaches below your set Stop-Loss price.
In simple terms, lets look at an example below:
i0.wp.com
Coin Buy price: 23000
Coin Stop: 20000
Coin Limit: 19000
Refer to the link above to see a image of how stop-loss looks like on Binance.
Now lets say you buy a coin at 23000, and after you buy it, you set a stop-limit sell order with a Stop price of 20000, and sell (limit) price of 19000. So now once your coin goes below 20000, the system will automatically open a sell order at your set limit price which in this case is 19000. The benefit of this is that it cuts your losses if the coin keeps going down from that level.
I know what you might be thinking right now. What if the coin doesn't keep going down from that level. This would go against you then. You are correct, but it is extremely important at what price you set your stop loss order at. We will discuss that strategy in the next topic below.
I hope it is clear to you so far. That was just the intro on what Stop-Loss actually is. Now we can look at what sort of strategy we can use around it.
Continue reading below....

Strategy for Binary options Profit 70-80% Statistics for 10.05Hello friends ! I decided to show how my strategy works.
Fair enough shows the turning point of the price. This is a strategy for Binary Options. Perfect for those who do not hurry and like to trade on scalping (the strategy is as simple and reliable as possible). The strategy consists of two main scripts and one auxiliary (indicators "Scalping Pro1, 2, 3") that allows you to use the free version of T.V .
You can work on most currency pairs and on different T.F, but the settings are more adapted for T. M5.
Support and resistance levels are drawn and updated automatically which is very convenient for beginners.
If you strictly adhere to the recommendations and work within the framework of this strategy, the percentage of positive deals is about 80%.
That allows you not to use Martingale and remain at the same time with a minimum of risks.
But if you still like martingale, then usually enough 3 rarely 4 steps. (I advise you to use martengail only after two months of practice on this strategy). As an example, a screenshot with statistics for 10.05 on the EUR-USD currency pair, Timeframe 5M.
Below are screenshots with more detailed recommendations .
How to choose the right entry point.
How to act when a false signal .
If you are interested in this strategy to gain access to all three necessary script write to me in private messages !
( comments rarely looking better to write in private messages )


Binary Options.Entry point.Ready Strategy 70-80% Positive tradesHi Friends ! I decided to show you how my strategy works . Quite well shows the turning point of the price, you can make both short and long transactions .
The strategy consists of three indicators. ""Scalping Pro 1,2,3 can be run on the free version of the site .
Scalping strategy working timeframe not lower 5M (15M,30M) gives 10-15 signals per working day on average.
detailed recommendations below in the photo.
Anyone interested in my strategies, write me a private message, I will tell you how to get a strategy " Scalping Pro"
I also conduct training and advice on trading .

The "Scalping Pro" strategy Shows the price reversal point BTCHi Friends ! I decided to show how my strategy works on large timeframes and crypto-pairs . Quite well shows the turning point of the price, you can make both short and long transactions .
The strategy consists of three indicators. ""Scalping Pro 1,2,3" can be run on the free version of the site .
below are screenshots with more detailed recommendations .
Entry point.
false signal as to act.
Anyone interested in my strategies, write me a private message, I will tell you how to get a strategy " Scalping Pro"
I also conduct training and advice on trading .

Using Renko Candles with 'Ninja Signals' Buy/Sell Alerts ScriptGetting some promising results on backtesting using Renko candles with our 'Ninja Signals' buy and sell alerts script and wanted to share the idea with the TradingView community. Some traders prefer traditional candles, some prefer Heikin-Ashi candles, while others are currently testing Renko candles to find the most profitable configuration. There's so many styles of trading available with this script, the possibilities are truly numerous, especially if you take into consideration adjustable variables such as stop loss, minimum profit per trade, RSI < 70 buy filtering, downtrend buy filtering, pyramid buying, and other options. You can check out the 'Ninja Signals' buy/sell alerts TradingView script and backtesting strategy at the links below. Comments, questions, and feedback are encouraged and appreciated. Best wishes and happy trading everyone!
'Ninja Signals' v1.0 (SCRIPT)
'Ninja Signals' v1.0 (STRATEGY)
'Ninja Signals' v2.0 (SCRIPT)
'Ninja Signals' v2.0 (STRATEGY)
Vires in Numeris

Simple and Profitable Cryptocurrency Trading StrategyNew Simple, easy and profitable Cryptocurrency trading strategy. The chart I've used to demonstrate is Ethereum but I use it across all of the major cryptocurrencies (BTC, XRP, BCH, DASH, etc). The chart shows daily timeframe but it is profitable on lower timeframes (I haven't used/tested below 4hr so try that yourself)
Indicator List
WWV_LB (5) = Weis Wave Volume by Lazybear with lookback setting of 5
Blue EMA = 8, close
Red EMA = 8, open
Coloured Boxes
Red = Profitable sell
Green = Profitable Buy
Yellow = Losing trade
Weis wave volume indicator is essentially showing when there is a turning point of control over the previous 5 timeperiod (here 5 days), from either bears to bulls or vice-versa. Meaning it is very good at showing the start and end of swings.
The EMAs are used to filter the weis wave volume indicator so that you dont enter on small pullbacks and it allows to visibly view the trend (pointing up/down) and when market is stagnent.
Rules
Buy
1. Look to buy when the weis wave volume indicator switches from red(bears in control) to green (bulls in control).
filter
2. EMA 8, close must be above ema 8, open with daylight between the indicators. Without daylight then for me it doesnt represent a strong move.
Sell
1. Look to sell when the weis wave volume indicator switches from Green to red.
filter
2. EMA 8, close must be below ema 8, open with daylight between the indicators.

Strategy for B.O 70-80% of Profitable trades.Statistics for24.04Hello Friends ! report for 24.04, traded on EUR-USD -0.06% Timeframe of 5 minutes .
My working time frame 5 minutes trading plan day at least 5 + . I work as a fixed amount of the transaction without the participation of "Martin"
Results of the day for 5 hours of trading 7 + 1-with the return of the asset 80% net profit was 5+
The plan for the day fulfilled. below is a screenshot of the graph .
24.04
read more about the rules of the strategy.
Scalping strategy working timeframe not lower than 5M (15M,30M) gives 10-15 signals per working day on one pair on average .
is in currency pairs EUR / USD , GBP-USD , USD-JPY , EUR-NZD , BTC-USD . as well as other currency and crypto pairs.
Expiration time = (1 candle) Detailed description can be found below .
How to choose the right entry point .
False signal. How to act.
Wishing to test strategy write. I'll give you access. and will also help to understand .
I also conduct training on binary options trading

Strategy for Binary options 70-80% of positive tradesScalping strategy working timeframe not lower than 5M (15M,30M) gives 10-15 signals per working day on one pair on average .
is in currency pairs EUR-USD , GBP-USD , USD-JPY , EUR-NZD , BTC-USD . as well as other currency and crypto pairs.
Expiration time = (1 candle) Detailed description can be found below .
How to choose the right entry point .
False signal. How to act.
My time frame is 5 m of the trading plan for the day at least 5+. I work as a fixed amount of the transaction without the participation of "Martin" statistics 23.04. 9+and 2-with an 80% return on the asset, the net profit was 6+. Below is a screenshot of the deal at 23.04.
Wishing to test strategy write. I'll give you access. and will also help to understand .

Unconventional weapons and strategy for an unconventional war.I say this is a parabolic war!! Bitcoin taught me a lot about this. Well, I say the US30 is a parabolic situation. If they don't wanna play fair, why should I approach the market with conventional weapons?
No! This is a strange war. So - I'm not gonna play by conventional rules. I don't think that's gonna work.
Overall in trading, the issue is not winning a few battles. It is about winning the whole war. So with Wall Street (US30) I decided that they can have back what equity I've gained but they're not going to put me into a loss once I've caught the equity.
My plan is to build an equity base to fight them at their own game, if/when volatility really gets going lower down.
I'll use whatever it takes. They're not gonna categorise me as trend follower, harmonic trader, scalper etc. Why? Because I'm all of that and more. I'm like Muhammed Ali!! Amma dance around them and show them I can do this in a way they don't expect!
I'll win anyway! How? If I don't lose equity, I've won! That's it! How can I win without winning? See here .

Strategy for Binary options 70-80% of positive tradesScalping strategy working timeframe not lower 5M (15M,30M) gives 10-15 signals per working day on average.
is in currency pairs EUR-USD , GBP-USD , USD-JPY, EUR-NZD , BTC-USD . and other currency pairs
Expiration time 5 min (1 candle) in more detail in the description of the script.
Wishing to test strategy write in personal messages.
below is an example for 5m Statistics for the week 50+ 19- =31+ profit. with a yield of 80%, the net profit was 26+ (I work as a fixed amount of the transaction without martingale ) .
09.04.18
10.04.18
11.04.18
12.04.18
13.04.18

Strategy for Binary options and Forex 70-80% of positive tradesScalping strategy working timeframe not lower 5M (15M,30M) gives 20-25 signals per working day on average.
is in currency pairs EUR-USD , GBP-USD , USD-JPY ,EUR-NZD, BTC-USD . and other currency pairs
Expiration time 5 min (1 candle) in more detail in the description of the script.
Wishing to test strategy write in personal messages.
below is an example for 5m Statistics for the week 58+ 18- =40+ profit.
26.03
27.03
28.03
29 03
30.03
