HOW TO: Find the money making stocks, cryptos and FX pairsToday I'm going to be looking to something a little bit different than our normal analytics!
We're going to dive into the tradingview screener! The Forex Screener specifically, but everything I do talk about does also apply to the crypto Screener and the stock Screener. What I want to explain is how I use it to find pairs, stocks and cryptos which are setting up the way I want them to, in order for me to day trade. I show how I use a range of different Bollinger bands to moving averages to overall technical aspects, like growth statistics or reaching all time highs.
The Forex Screener and the tradingview tools that they offer is top of the range stuff. I recommend trying to figure out how to use them and how to utilize them to benefit you in your trading.
Have a listen. Have a look yourself through the Tradingview screener and the different technical aspects in which you can change. I guarantee it'll streamline your process in finding the right pairs that you're going to choose when it comes down to day trading.
I hope you enjoyed it. If you did, please leave a comment and a like. As always, have a very successful week of trading guys. Thank you.
Trading Tools

How to understand your Brain In Trading? (educational post)What does this have to do with trading? Everything. Trading is mental.
Before continuing make sure to like and save this post.
Your trading errors don't come from the market , they come from your own perception and reaction about the market information.
Neurons are what transmit information to different parts of the brain. The stimulus starts in the amygdala and then move into the neocortex. Your brain and memory react with past information. These neurons will start to associate themselves to respond accordingly. Between stimulus and response there is a space. In that space is our power to choose our response. In our response lies our growth or stagnancy. Choose wisely
Trading examples :
[/list
In trading you will fell the pain that you experienced from that previous loss and that will make you feel afraid for the next decision. You won't be able to execute once the edge appears in front of you.
If we had a major win, then these neurons will start to associate themselves to the pleasure that you experienced from those profits.
However, neurons do not have a mind of their own, and they are simply doing their job by transmitting information. That Information can either be right or wrong! We can develop false or negative neuro-associations throughout life.
For example:
smokers will associate pleasure to the inhalation of a cigarette, instead of the pain that could be caused by cancer.
Some people associate pain to falling in love if they have experienced a bad breakup, and the begin to create a negative neuro-association to entering into a new unique relationship.
Some will associate fear to every dog they see in the street if they have experienced a dog attack
Drug addicts will assimilate pleasure by consuming desctuctive substances
But how does all this apply to trading financial markets?
Almost every trader has suffered after a massive losing streak , only for the market to show a entry that could have been able to make us back the money lost but we did not had the courage to take the trade
Almost every trader has experienced the pleasure of making a large amount of profits, only for the market the reverse and it becomes a big loss.
The brain will create a neuro-association that will link pain to a normal retracement in price. You will begin to equate a retracement to pain, and thus create a false neuro-association. You are going to close your trades with a simple pullback. It requires a mental process called neuro-associative conditioning. The negative neuro-associations must be turned into positive neuro-associations.
For example :
Do you have hope when a losing trade runs and you wait it to turn back into profit ? Do you feel despair when the market is redistributing your profits with one single retracement ? then change that and do the opposite. feel despair when a trade is running in loss and feel hope when a trade is running in profit. This is a change in your neuro-association; a negative one to a positive one.
Is the market retracing ? Do not associate this with 'the market is taking my profits back!' but rather 'the market may be presenting me with an opportunity to add to my position'. This is a change in your neuro-associations; a negative one to a positive one.
Did the market hit your stop loss ? Do not associate this with the pain of losing money, but rather associate it with the fact that the probability of the next trade being a winner will stay because of your profitability. This is a change in your neuro-association; a negative one to a positive one.
Do you feel great after a massive win ? then change that and feel protective about what you collected. this is a change
. Hope this post was helpful .
Now let me know if you have another example about bad neur-associative conditionning that can be turned into This is a change in your neuro-association; a negative one to a positive ones ?

RuckSack Time Highlighter This tool allows you to highlight specific blocks of time which help to cut down noise in 24 hour markets such as Forex or Crypto. This can be very useful for spotting trends that occur during traditional market open and closing hours as traders look to enter or exit their main position for the day. The tool includes two user inputs, one for the pre market and one of the after hours session. The block of time highlighted can also be customised with colour and transparency so you can achieve a look that suits your chart style.

I was today years old..Did you know when you have one or many indicators on your charts and whilst trying to zoom in or out the chart using the mouse the indicators take up half or even more of screen realestate especially in case of pivot lines indicator??
Well there is a solution to all this madness so that you can zoom in and out of price chart only and IGNORE all indicators on your screen's realestate.
Here's how to do it:
0. Keep all your indicators ON on the chart
1. Right-click on the price scale
2. Select "Scale Price Chart only"
3. You'll thank me later ;)
Cheer's 🍻

How to trade by using EMA Ribbon ?Hello traders 🐺 .
this is an educational idea and it's about the EMA Ribbon .
In this idea I want to talk about how to using EMA Ribbon in trading so make sure to read this idea until to the end if you are one of the Moving averages fans .
I like to start with an example of trading by using the EMA Ribbon , then I explain more about the EMA Ribbon and how it's work :
in the chart above we have 3 different examples of trading by using the EMA Ribbon ; as you can see in the chart above , we have 3 different pattern and the last one which is the symmetrical triangle is actually the current pattern of the BTC and I want to ask you about your prediction for it so leaves your comments below this idea and share your view about the BTC , after learning of how we can trade or in the other words how we can use the EMA Ribbon in our trading .
let's start with the ( first example ) :
my first example is rising wedge pattern , I try to cover all 3 types of the market conditions in this idea , because it's important to learn to trade in the any direction ; the first example is a bearish pattern :
As you can see in the chart above , BTC price after creating the rising wedge pattern started a very long down trend , by how we can trade it ?
if you look at the chart you will notify that the every line of the EMA Ribbon acts as a support or a resistance and the more deeps price can penetrate to the Ribbon , the chance of the reversal is higher .
For example , look at the rising wedge , during the pattern when the EMA Ribbon was in the bullish mode or in the other word , when short term EMA is above the long term EMA , when price finally success to penetrate to the last line of the EMAs which is the long term EMA ; price was faced to the more stronger support and this is shows us that if price can break below the all of the EMAs , there is strong chance for the changing the trend .
but finally when price break below the Ribbon , BTC was started a very long term bear trend , if you are a trader you must know that this bearish pattern after the very long bullish trend could indicate the bear market signs , and if you want to use EMA Ribbon for trading this is good chance , so let's see how we can use it ?
first of all when price break below the EMA Ribbon you must wait for the confirmation signs , this is means that you must wait for the EMA Ribbon to flip from bullish to the bearish mode which means that the short term EMAs goes below the long term EMAs , and after the retest of the Ribbon you can say that , thing are looking bearish from the EMA Ribbon sight ; and you can set your short trade based on your trading strategy .
but what's the problem of the EMA Ribbon ?
let's talk about the EMA Ribbons problem after checking all of the examples , until that please think about it and imagine how we can fix this problem if you find out the problem , if you can't , wait for the end of this idea and also don't forgot to support me with your likes and comments .
let's combine the example 2 and 3 together for better understanding :
as you might know , the moving averages are trend chaser indicator which means that they are work perfectly when market have a specific trend , for example in the chart above when BTC created a falling wedge pattern and break above the EMA Ribbon and retest it as a new support start a bullish trend , and as you can see when market started to retracement , BTC created a bull flag pattern and after the break out BTC continue the bullish trend .
in the bull flag , you can see that price break below the EMA Ribbon and also retest it as a resistance , but price can't continue the bearish trend ; so why this happen ?
did you remember that in the example one , I asked you about the EMA Ribbon , could you find the problem yet or not ? if you can't find it wait for the end 🙄🤷♀️ .
now we arrive to the last example which is the symmetrical triangle , but I gonna talk about it in the next idea because this is an educational idea and not for the analysis purpose , so make sure to follow me to find out what gonna happen for the BTC in the next coming weeks .
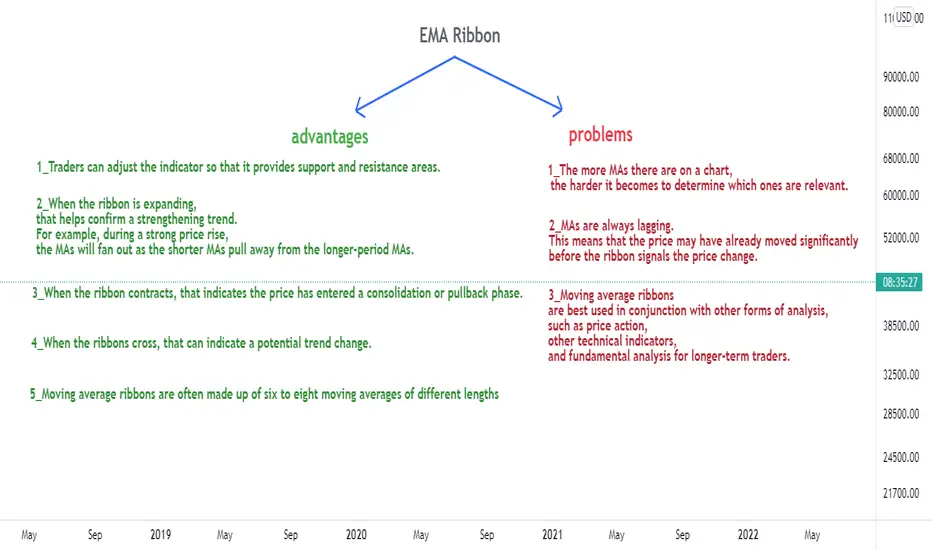
now it's time to show you the EMA Ribbons advantages and problem in one clear picture :
Did you remember that in the example 3 (bull flag) I said that the EMA Ribbon flipped to the bearish and also the price retest it as a resistance but price didn't break below again and after that BTC was breaked to the upside , this is what I mention the reason in the problem number 3 :
3_Moving average ribbons are best used in conjunction with other forms of analysis, such as price action, other technical indicators, and fundamental analysis for longer-term traders.
you must know that it's better to use EMA Ribbon in conjunction with other indicators for example , personally like to use it in conjunction by the RSI and TSI and also the price actions .
in the example number 3 , the overall trend is still bullish and price is above the support structure and also it's on the bullish pattern , so there is strong chance for goes above the Ribbon again .
now it's seems to we reach to the end of the idea and I must appreciate you my friends to read my idea , don't forgot to leaves your idea about this symmetrical triangle and help me with your likes and comments ; thank you for reading my idea .
How To Trade Divergence
Divergence simply means separation.. When two similar things things---get separated and start going different directions, you have to consider which direction to follow. That's exactly the concept of divergence. When trading, and you spot a divergence, you want to be sure to understand what they are trying to tell you. In this video, I explain the concept of divergences, how to trade them and what to do when you sight one. Be sure to like, follow and comment.
I want to see those div trades!

Here is why I suggest you should use the SUPER TREND!I see the weekend is here. A new week is about to begin, and it's time to get organised, reflect on your progress so far, and learn something new to help you achieve your trading goals., and boost your profitability.
Let's be honest, I am someone who normally likes to follow the trends. A lot of the trend following indicators I've encountered along the way in my professional and career growth haven't made sense to me. Moving averages, Average Directional Index, Moving Average Convergence-Divergence, Parabolic SAR etc. I always had a lot concerns with the indicators being able to swiftly follow the price movement, as well as identify a clear reversal of the underlying trend. However, I came through to find this SUPER 'super trend' indicator some while ago, and by testing this and adding it to my intraday trading strategy, I finally see that I could rely on one single indicator to help me identify the trend quickly and more efficiently (never 100% of course it is still not a holy grail!) but the results were good enough for me to write down this post to you guys.
What is the Super trend indicator?
'Super trend,' as the name implies, is a trend-following indicator, similar to moving averages and MACD. It is plotted on prices, and the position of the prices reflects the current trend. When we build the Super trend indicator, the default settings are 10 for the ATR and 3 for the multiplier. The average true range (ATR) is important in 'Super trend' since it is used to determine the indicator's value and it indicates the degree of price volatility, which is one reason why this indicator beats Moving averages, which disregards price volatility.
Super trend Indicator Formula
The super trend indicator computation is illustrated below–
Up = (high + low / 2 + multiplier x ATR)
Down = (high + low) / 2 – multiplier x ATR
Average True Range = / 14
The number 14 represents a period in this context. As a result, the ATR is computed by multiplying the previous ATR by 13. Add the most recent TR and divide it by the time.
As a result, ATR is an essential component of the supertrend technical analysis indicator.
How to Use Super trend Indicator to Identify Buy and Sell Signals?
Super Trend, as a trending indicator, performs well in trending markets (both uptrends and downtrends). When the indicator flips over the closing price, it is easy to identify a buy-sell indication. When the Super Trend closes below the price and the colour turns to green, a buy signal is issued. A sell signal is generated when the Super Trend closes above the price and the colour of the Super Trend changes to red.
There is no such thing as a 100 percent accurate technical indicator, and Super Trend is no exception. It also produces erroneous signals in sideways markets, however it produces fewer false signals than other indicators. As a result, you may use Super Trend in conjunction with other indicators to provide more accurate trade signals.
Follow my daily analysis posts on my account to check out how to combine it with other momentum indicators as well as use it for multi-time frame analysis!

USDJPY, (240) SQUEEZE INDICATOR Hello, this indicator is called Squeeze momentum indicator (Lazy bear) you can check on the indicator search engine. This indicator is simply to use and highly effective, when there is a change in color , and smaller bars that signifies change of trend while the small black crosses within he momentum squeeze bars signifies incoming trend reversal.
Share with me your ideas.
Jesus loves you ❤️

Elliott Wave Theory - Motive WavesElliott Wave Theory , developed by Ralph Nelson Elliott, proposes that the seemingly chaotic behaviour of the different financial markets isn’t actually chaotic. In fact the markets moves in predictable, repetitive cycles or waves and can be measured and forecast using Fibonacci numbers.
The very basics of Elliott Wave Theory ;
The Elliott wave principle at its core consists of motive waves, movement in the direction of the larger trend, and corrective waves, any correction against the main trend. Market prices alternate between a motive phase, and a corrective phase on all time scales of trend.
Wave analysis offers insights into trend dynamics and helps you understand price movements in a much deeper way and offers the trader a level of anticipation and/or prediction when searching for trading opportunities
Motive Waves
Motive waves in general can be categorized as Impulse and Diagonal waves
a- Impulse Waves
Impulse waves consist of five sub-waves in the same direction as the trend of one larger degree.
Elliott proposed that financial price trends, the waves, are created by investor psychology or sentiment and the waves can be measured and forecast using Fibonacci numbers . In adition to using fibonacci retracments and extetion to forcast probable targets, channeling technique is also presented, where channeling technique is used to forecast wave formations and targets using price action .
Disclaimer: besides the rules, the below presented figures displays guidelines that elliott waves may form. Guidelines are tendencies, not set in stone rules
b- Diagonal Waves (Wedges)
Another form of motive waves are diagonals, they appear in the beginning of a larger trend, called leading diagonal and at the end of the larger trend, called ending diagonal
They are five-wave structures in the direction of the main trend within which wave 4 almost always moves into the price territory of (overlaps) wave 1, breaking the rule of impulse motive wave
Diagonals take a wedge shape within two converging lines
Elliott was careful to note that these patterns do not provide any kind of certainty about future price movement, but rather, serve in helping to order the probabilities for future market action. They can be used in conjunction with other forms of technical and fundamental analysis, including technical indicators, to identify specific opportunities.
Technical Indicators
Using various technical indicators among elliott wave practitioners is not so common, except few, probably the common one used is a kind of momentum indicator, such as RSI or MACD , to detect divergencies
Fibonacci retracement and extension drawing tools are essential for elliott wave practitioners. In todays computerized era many of the darawing tool's auto indicator versions are availabe on the trading platforms, such as Auto Fib ( where and how tp apply )
Elliott Wave Oscillator ( EWO ) , is inspired by the Elliott Wave principle and helps counting the waves
Volume and Volume Profile ( Vol / Vol Profile ) combined with price action is esential in technical anlaysis and for elliott wave practitioners helps to identify impulse and correction phases
Other indicators that are referred among elliott wave practitioners
Pitchforks ( how to apply ), Pitchfans , FibFans ( how to apply ), FibChannels ( how to apply ), FibTime , LinReg Channel ( what it is ), Raff Regression Channel ( what it is ), etc

Trading Alphabet: Friday FundayHey, wizards! Happy time of the day.
It's Friday, so we have decided to have a little bit of fun and put out a Trading Alphabet, or in other words, which trading-related tools, securities, phrases do we associate with each and every letter in the Latin alphabet.
Do you agree with the list? What would you add or modify?
Happy upcoming weekend and big love to you all!
Investroy

The Level is Good Until it's Not (A Lesson in Supply and Demand)G'day, Traders! Despite wars and rumors of wars there are always opportunities to be had in the financial markets, particularly the Energies markets.
The purpose of today's trade example is to demonstrate that once a level of Supply and Demand are created in the financial markets, the rule of thumb is that a level is "good" until they are not... that is, until all the unfilled orders inside them are processed. No matter how old a level may be, they do not go "stale".
Let's look at a trade which closed in the opening minutes of the market at 6PM EST on Sunday March 27, 2022:
A long opportunity became available to us on the 4-hour chart on Crude Oil Futures in the wee morning hours of Wednesday, March 5 (2:36am to be exact!). That morning (after having the required coffee and bacon as part of one's trading routine) there was plenty of time to evaluate the trade setup using Supply and Demand analysis. When a trade like this appears and meets your rules-based qualification system, you can then give yourself permission to take the trade.
The destination (a.k.a, Target) needs to be an opposing level of qualified Supply. The interesting part, and hence the jist of this article, is that no matter how old a level is, "a level is good until it is not." The level of Supply identified was from July of 2008 – almost 14 years ago! It is treasure chest full of sell orders that was created in 2008 and hasn't been touched since!
As you can see from the chart, price entered that Target level and ricocheted right away like a cat on a hot stove! If you drill down to the 1-minute chart you can see that price stayed at that level for a full two minutes until all the Buy Orders were exhausted and the sellers were back in control, driving price back down.
When trading via Supply and Demand, don't worry about how old a level is... if it meets your criteria of being a quality level, take it!
As always, Trade Well!

One divergence indicator to rule them allGreetings Traders,
We are continuing with our (mini) series in which we break down the (seemingly endless) features of The Divergent indicator.
Today we are going to discuss the various oscillators The Divergent supports detecting divergences on.
In contrast to other divergence indicators on TradingView, The Divergent comes with oscillators built-in. This means you won't have to add it on top of other indicators on your chart; it is completely standalone. Why is that a good thing? It is because The Divergent respects your indicator quota - it will only use up a single slot on your chart.
The Divergent ships with the following oscillators:
MACD (Moving Average Convergence Divergence)
RSI (Relative Strength Index)
CMF (Chaikin Money Flow)
Stochastic RSI
MFI (Money Flow Index)
TCI (Trading Channel Index, aka. WaveTrend)
Balance of Power
CCI (Commodity Channel Index)
Awesome Oscillator
Each oscillator is fully customisable, allowing you to tweak them the way you desire. To choose another oscillator, simply open The Divergent 's settings panel, and select a different one from the list.
A further benefit of having the oscillators built into the indicator, is that it opens up the possibility to apply various filters to the detected divergences. For example, if you have the RSI selected, you can configure The Divergent to only signal those RSI divergences, that manifest under the oversold or above the overbought areas. These filters will be introduced in detail in future articles.
To learn more about The Divergent , please see the related ideas linked at the bottom.
If you liked this post, please don't forget to give it a thumbs up!
If you have any questions, please feel free to ask in the comments section below.
Thank you for your attention!

A Trading Strategy using Ichimoku CloudsThis chart contains an explanation and breakdown of a trading strategy I've been following with decent success. The basic idea of the strategy is that in the few days following the event of a ticker meeting all entry requirements, there is likely to be a pop of at least a few %. By taking a long position when the conditions are fresh, we can hope to capture a nice move up and then take profit quickly, moving on to another symbol and repeating the process.
Just in the month of November 2020 I have completed over 70 trades with this system, yielding a win rate of 83% and average win size of 1.89%; during this time I grew the account by 20%. I created the linked indicator (soon to be updated) to help find the entries and set appropriate stops based on recent volatility. The basic method of finding entries on TradingView is to set up the screener with columns for Last, Ichimoku Cloud Conversion, Ichimoku Cloud Base, Ichimoku Cloud Leading Span 1, and Ichimoku Cloud Leading Span 2, plus whatever columns you would like to use to filter the stock universe you want to apply this strategy to. Then set filters in the following configurations:
1. Last crosses up Ichimoku Cloud Leading Span 1 + Ichimoku Cloud Conversion above Ichimoku Cloud Base
2. Last crosses up Ichimoku Cloud Leading Span 2 + Ichimoku Cloud Conversion above Ichimoku Cloud Base
3. Ichimoku Cloud Conversion crosses up Ichimoku Cloud Base + Last above Ichimoku Cloud Leading Span 1 (or Span 2, whichever yields fewer hits)
Flipping through the results from these filter sets with my indicator script on will show you potential entries for this strategy.
There is a lot of room to personalize the strategy to your tastes as well, such as how recently do cloud crossovers and conversion/base crossovers need to be or other ways to set the stop conditions. You can also modify the Ichimoku Cloud parameters, but I've been having good results with the defaults of 26 and 52.
Please feel free to let me know of any successes or issues you have, and I am happy to answer questions about the strategy or the indicator script. Thanks for checking out this tutorial! This information is for educational purposes only.

Power of pitchfork using Andrews pitchfork in intraday trading....
how to get perfect entry in your trade at intraday levels...

Measured Move ToolThis is just a quick tip on creating a measured move tool. If you're like me (having to work things out alone the slow way by trial and error) then you probably messed around with trend lines making a mess of the chart and it always being a faff to work out measured moves, which I use pretty religiously in setting profit targets and goals.
However, no more faffing needed. The Fib Retracement Tool can be re-appropriated as a measured move tool. Simply double click the tool settings and change all of the nonsense measures that come in the pre-sets (I don't use Fib Retracement in my trading). In my adapted Fib Tool I simply change the settings to 0, 0.33, 0.5, 0.66, 1, 2, 3, 4. I also grey out slightly the 0.33 and 0.66. I find 0.33, 0.5 and 0.66 are great for measuring pullbacks.
And that's it. Measured move tool hack complete. Enjoy.

How to capture chart snapshot in tradingview-telegram alert botHello traders,
In the last video we learnt How to create simple web-hook to send alerts to telegram . In this tutorial, we will try to build a bit more on it and to also include chart snapshots along with plain alert messages.
Webhook code is updated in the replit repository here: replit.com
Once, setup, run the repl and capture base URL
⬜ Webhook API
Webhook post request URL format below:
https:///webhook?jsonRequest=&tblfmt;=&chart;=&loginRequired;=
jsonRequest - true/false. Set it to true only if you are sending alerts in the form of json. If set to true and the alert message is not in json format, it will throw error
tblfmt - Values taken from python library tabulate . Defines how to display the json message in tabular format. Applicable only if jsonRequest is true
chart - Chart URL from tradingview for which snapshot need to be captured
loginRequired - true/false. Use this only if you are using a private non shared chart for snapshot or if your chart contains invite only scripts which needs to be shown in the chart snapshot.
⬜ Capturing Chart URL
Note: Make sure you create different chart for different instruments which you are trying to get alert. Also make sure your chart is saved and all the indicators are in palce.
⬜ Testing on postman
⬜ Creating the alert

How to guide ? Hide INPUT values of indicators From ScreenHide INPUT values of indicators From Screen
There is a very common cluttering issue that can happen when adding indicators.
All input values are shown on the chart next to the indicator name, which is not really helpful in most of the cases. The values are input settings selected for the indicator, which is of very little use to just see selected values. So if you have long strings as input, or multiple inputs, you will see a long line of text, even hiding the indicator name itself. Further it blocks the chart and looks very bad when taking screenshots.
Fortunately there is an option available from trading view itself, that many people are unaware of. This option enables you to hide all input values, leaving just the indicator name.

Combining both Trailing Stop and Stop Loss in percentagesBoth a trailing stop and a stop loss are necessary tools for every trader, for locking in as much profit in any given trade, while on the other hand minimizing the risks involved in trading.
I started to write this scipt to give an answer to many traders who wanted these two tools combined, but didn't find any way to program this.
TV has some shortcomings in the built-in functions regarding this topic. You can use 'stop' and 'limit', or 'loss' and 'profit' and even functions with trailing stops. But all of these lack the flexibility of the use of percentages.
I used many ideas of the community, and with this scrip I want to give back to the community.
The strategy is just a simple crossing of two Exponential Moving Averages, so do not start trading based solely on this script.
Also keep in mind that no two assets are the same, and adjustments should be made in the configuration for every asset.
This script should be viewed as a template, just take out the chunks of code you need. A savvy programmer can undoubtedly implement a 'take profit' of 50% halfway down the trade.
The features are:
-Everything is easily adjustable through the configuration section
-2 EMA's which form the strategy to go Long or Short
-Trailing stop, which adjust itself every bar according to the configuration
-Stop loss, which uses the entry price of the trade and stays at the same level according to the configuration
-The chart provides a visual reference for the levels of both stops
Happy trading!

MOVING AVERAGE | 4 Efficient Methods To Apply
Hey traders,
The moving average is one of the most popular technical indicators.
It is applied in stocks/forex/crypto trading and proved its high level of efficiency.
There are hundreds of trading strategies based on MA.
In this post, we will discuss the 4 most popular ways to apply the moving average.
1️⃣The first method is applied to identify the market trend.
While the price keeps trading above the MA, one considers the trend to be bullish and looks for buying opportunities.
Once the price starts trading below the MA, the trend is considered to be bearish and a trader is looking for shorting opportunities.
2️⃣The second method applies the combination of 2 MA's: preferably a long-term one and a short-term one.
The point is that once a short-term moving average crosses above a long-term MA, with high probability it signifies the initiation of a bullish trend.
Alternatively, a crossover of short-term and long-term MA's to the downside indicates a start of a bearish trend.
3️⃣The third method applies MA as a structure.
While the moving average is lying above the price, it is considered to be a dynamic resistance.
Staying below the price it serves as a strong dynamic support.
Perceiving MA as the structure, one applies that for trade entries.
4️⃣The fourth method is aimed to track the crossover of the moving average and the price.
The idea is that a bullish violation of the MA by the price gives an early signal for a possible trend reversal.
While a bearish breakout of the MA by the market indicates a highly probable bullish trend violation.
Backtest different MA's inputs and learn to apply that for predicting the future direction of the market and for trading it.
Do you use MA?
❤️Please, support this idea with like and comment!❤️

Candles vs Heiken Ashi (Average Bar) CandlesHeiken Ashi Candles is one tool to help with conviction for day and swing trades. These candles use averages to show strength and continuation of a trend. Using the $AMD chart as an example, the upward and downward trends are more obviously displayed than with the traditional candles, leaving less doubt on whether or not the trend is likely to continue.
Heiken Ashi can also be used on smaller time frames for day trades and scalping.
"Heikin-Ashi, also sometimes spelled Heiken-Ashi, means "average bar" in Japanese. The Heikin-Ashi technique can be used in conjunction with candlestick charts when trading securities to spot market trends and predict future prices. It's useful for making candlestick charts more readable and trends easier to analyze. For example, traders can use Heikin-Ashi charts to know when to stay in trades while a trend persists but get out when the trend pauses or reverses. Most profits are generated when markets are trending, so predicting trends correctly is necessary.
The Heikin-Ashi Formula
Normal candlestick charts are composed of a series of open-high-low-close (OHLC) candles set apart by a time series. The Heikin-Ashi technique shares some characteristics with standard candlestick charts but uses a modified formula of close-open-high-low (COHL)."
Investopedia.com

📚🎬💎#e08 : An Ultra Bond Future💍Married To The⛪💫An Education🎓
Series Continuation
Prior Episodes Found
In The Content Below
❔ What Are Bonds
Bonds Are The Foundation
Of A Debt Based Monetary
System
Bonds Define The Cost Of
Money Over Time
Put Simply Bonds Are
Future Dollars
Read That Again🔂
US Treasury Bonds Are
Future US Dollars Deliverable
At A Specified Time
In The Future I.e
30 Years Henceforth
By Purchasing A
US Treasury Bond
You Enter Into A
Legal Contract With
The Treasury Wherein
You Will Receive
The Principle Or
"Face Value" Of The
Bond Plus The Rate
Of Interest Specified
At The Time Of Purchase
❔ A Traders Role
To Make Money I Hear You Say
Well Yes Of Course
Money
But What Exactly As Bond Traders
Are We Getting Paid For ?
To Provide A Service
Our Collective Actions
Expressed Through The
Trading Of Bond Instruments
Determine The Cost Of Money
The Cost Of Money
Cost Of Money
Yes💡
Regardless Of Your Trading
Size We Are All Interacting
With The Free Market
Our Role :
To Correctly
Price The Value
Of Future Money
When We Trade Bonds
Profitably
We Win The Game
We Have Kept The
Flame🔥
We Have Served
A Most Important
Mission
We Fulfill A
Founders Vision💜
d-MR96nBa
nvrBrkagn
❔ Why Else Ultra Bonds
Low Operation Costs
Regardless Of Trade Size
Only Pay Spread Fee
As Futures Contracts
Zero Overnight Cost To Carry
Quarterly Rollover Spread Only
Operation Costs Will
Kill A Trader In Time
On Time
Every Time
Same As Any Business
Ventured
C4L
📔 Rules Of The Rodeo
Trend Is Dearest
Life-Long Friend
Bond Bull Market
40 Years Strong
So We Will
Mostly Trade Long
Positions Actively
Managed
Entry Orders Executed
At The Market
Trading 0.01 Unit
At A Time
Slow Drip💧
ℹ️ CME Group Official
Ultra Bond Trader Site
www.cmegroup.com
Keep Your Bond⚔️
Watch Your Loyalty⌚
Buy Freedom To🔥
0.96 % x Cost ♋
Behold.. The
Ultra Bond Future 🗽
☔
📚#e07🩸GG :
📚#e⏭️06 :
📚#e04 :
📚#e03 :
📚#e02 :
📚#e01 :
CBOT:UB1!
TVC:US30Y
Pluto 🛰️
Hndrxx 👩🏻🎤

TIME & PRICE CONCEPT - PTATiming is of great importance to any trader because you don't want to enter the market at the wrong time. Your setup might be correct and everything looks good but the time we pull the trigger matters.
Kindly like and comment for more educational contents.

HOW-TO: FibDev Indicator This tutorial is to explain our FibDev Indicator using AMD 15m chart example.
Overview of the daily zones:
-- Starting with red zones, these are our daily supply zones. We expect these zones provide resistance and act as potential pivot points for the price to reverse
-- The yellow zone is the neutral zone, when price is in this zone we expect that it will continue to chop around until it has chosen a direction for the day.
-- The green zones are demand zones. Similar to the supply zones, we expect these zones to provide support and act as possible pivots for the price to rebound
-- These zones are built based on previous daily price action and ** the zones will be the same on all time periods for any given day **
Overview of the intraday clouds:
-- The upper cloud (red outline) is where we expect to encounter an overbought condition, and that price may reverse down
-- The lower cloud (green outline) is where we expect to encounter an oversold condition, and that the price may rebound upwards
-- These clouds are built based upon ** the time period of the chart that is selected **. Thus the 5m clouds will be different than the 15m clouds.
Overview of the automated signals:
-- These signals are printed when we expect there is a chance of trend reversal. It should be noted that trading against the trend is very risky.
-- They do NOT serve as buy and sell signals, they are merely indications that price has entered a place of possible reversal.
Our thoughts on how to use this data:
--The main way we like to use this is by looking for scenarios where we have a wick or close that has broken above or below the intraday cloud at the same time that it is testing a supply or demand zone. Looking at this AMD example here, you can see a few scenarios where it wicked or closed into the lower cloud (some creating Bull signals) and was also testing a demand zone. This provides a layer of confluence as it's not only testing a daily demand zone but it's also testing the faster, intraday oversold zone (the lower cloud).
-- A secondary way to use this data is similar to the ORB strategy, where you essentially chase (or ride the momentum) the price once it has broken to the upside or downside of the yellow neutral zone. With this strategy, your potential profit zones would then become the supply or demand zones depending on which way the price moved.
Conclusion:
-- Ultimately it's up to you and how you choose to use this data and confluence it with other TA tools is completely up to you and your trading strategy.
-- For more information on using this indicator, please send us a message here or on Twitter (link found in our profile).
Thank you!
Great Blue Trading Team
