GBPUSD SHORT - TradingView to MT4 BotAlmost got stopped out on this one lol
Side: Short
Risk: 10%
SL: 70 pips
SEND SIGNALS FROM TRADINGVIEW TO MT4
www.tradingviewtomt4.com
POSSIBLE COMMANDS
Open Orders
buy_SYMBOL_SLinPoints_Risk%
sell_SYMBOL_SLinPoints_Risk%
buy_SYMBOL_SLinPrice_Risk%
(can be used for dynamic values)
sell_SYMBOL_SLinPrice_Risk%
(can be used for dynamic values)
buy_EURUSDi_150_0.05 = opens a buy order on EURUSD with an SL 150 points away with 5% risk if SL triggers
sell_EURUSDi_1.10200_0.03 = opens a sell order on EURUSD with an SL at 1.10200 with 3% risk if SL triggers
Close Orders
close_SYMBOL_%toClose_none
close_SYMBOL_%toClose_break
close_SYMBOL_%toClose_(price)
(can be used for dynamic values)
close_EURUSD_50_none = closes 50% of an open order and SL stays the same
close_EURUSD_0_break = closes 0% of an open order and SL moves to breakeven if trade is in profit
close_EURUSD_25_1.10200 = closes 25% of an open order and SL moves to price that is stated
Update Orders
update_SYMBOL_SL1_SL2
(can be used for dynamic values)
The logic of this command differs slightly and serves as a trailing stop between two dynamic values if your indicator provides that.
For example, if current trade is a BUY, after sending this command, it will move Stop Loss to SL1, if it’s a SELL, it will move Stop Loss to SL2.
update_EURUSDcn_1.10300_1.10100 = If we are in a BUY, Stop Loss would be updated to 1.10300. If we were in a SELL, Stop Loss would be updated to 1.10100.
If you used dynamic values in trading view, the command would essentially look like this: update_EURUSDcn_{{plot_3}}_{{plot_4}}
SEND ALERTS FROM TRADINGVIEW TO MT4
www.tradingviewtomt4.com
WHY RISK MANAGEMENT?
Trading can be very lucrative, we all know that, hence; why we became traders in the first place. Whether you found an awesome indicator script on TradingView, an Expert Advisor on MT4, or whatever other strategy that got you excited about trading in the first place; you will lose no matter how perfect a strategy works.
I started trading with a strategy that had over 60% win rate and still lost half of my account. You may think I’m an idiot. I just didn’t understand it’s more important to know how much you can lose rather than how much you can make. So from now on, forget about gains. If your strategy’s win rate is above 50%, focusing on how much you can lose will always be more important. The gains will come on their own after that.
Risk management is simple and only involves basic math. So let’s start with that: To understand the calculator in it’s entirety, you must know how to calculate profit from a winning position. We’ll use a FOREX example.
Let’s say bought 1.00 Lot of EURUSD at 1.00100, a couple hours or minutes later, you closed it at 1.00200. First you subtract Close Price from Entry Price to get the amount of points you gained:
1.00200 - 1.00100 = 0.00100
100 points gain or 10 pips
To calculate dollar profit you multiply by Lot Size and multiply again by 100,000.
0.00100 * 1.00 * 100,000 = $100
Gain * Lot Size * 100,000 = $
Great, so you made $100! If your balance was $1,000, you just made 10% return, amazing! But.. what if the trade had gone wrong? How do you even calculate how much you might lose? Well first, you have to choose a Stop Loss, this varies depending on your strategy. One of my 30m strategies has a Stop Loss between 150-200 points, while a 4hr strategy might have a Stop Loss between 600-650 points.
Let’s say you’ve made up your mind and you’re going to choose a Stop Loss at 150 points, which means if price is at 1.00150, your stop loss would end up at 1.00000 on a Buy Trade. The key thing first is deciding what % of your balance you’re willing to risk. If I have $1000, you might be okay with losing 5%, which is $50. Now you use the formula above:
Gain * Lot Size * 100,000 = $
In this case, we would substitute Gain with Stop Loss value instead.
Stop Loss * Lot Size * 100,000 = $
150 * Lot Size * 100,000 = $50
As you can see, we have to solve for Lot Size because we don’t know exactly how much to trade yet if our trade hits our Stop Loss, we’ll only lose $50. I won’t go into the algebra, so here is the final formula:
Lot Size = 1 / (SL in Points / (Capital x Risk%))
Lot Size = 1 / (150 / ($1000 * 5%)) = 0.33
Trading 0.33 lot size with a hard Stop Loss of 150, we’ll only lose $50 or 5% of our balance.
That’s basic risk management, and it’ll save you headaches from losing money on your trades. Don’t worry about doing the math yourself though, use our bot that auto-calculates your position based on your risk. Happy trading!
SEND TRADES FROM TRADINGVIEW TO MT4
www.tradingviewtomt4.com
Trading Tools

EURUSD SHORT - TradingView to MT4 BotSide: Short
Risk: 5%
SL: 20 pips
SEND SIGNALS FROM TRADINGVIEW TO MT4
www.tradingviewtomt4.com
POSSIBLE COMMANDS
Open Orders
buy_SYMBOL_SLinPoints_Risk%
sell_SYMBOL_SLinPoints_Risk%
buy_SYMBOL_SLinPrice_Risk%
(can be used for dynamic values)
sell_SYMBOL_SLinPrice_Risk%
(can be used for dynamic values)
buy_EURUSDi_150_0.05 = opens a buy order on EURUSD with an SL 150 points away with 5% risk if SL triggers
sell_EURUSDi_1.10200_0.03 = opens a sell order on EURUSD with an SL at 1.10200 with 3% risk if SL triggers
Close Orders
close_SYMBOL_%toClose_none
close_SYMBOL_%toClose_break
close_SYMBOL_%toClose_(price)
(can be used for dynamic values)
close_EURUSD_50_none = closes 50% of an open order and SL stays the same
close_EURUSD_0_break = closes 0% of an open order and SL moves to breakeven if trade is in profit
close_EURUSD_25_1.10200 = closes 25% of an open order and SL moves to price that is stated
Update Orders
update_SYMBOL_SL1_SL2
(can be used for dynamic values)
The logic of this command differs slightly and serves as a trailing stop between two dynamic values if your indicator provides that.
For example, if current trade is a BUY, after sending this command, it will move Stop Loss to SL1, if it’s a SELL, it will move Stop Loss to SL2.
update_EURUSDcn_1.10300_1.10100 = If we are in a BUY, Stop Loss would be updated to 1.10300. If we were in a SELL, Stop Loss would be updated to 1.10100.
If you used dynamic values in trading view, the command would essentially look like this: update_EURUSDcn_{{plot_3}}_{{plot_4}}
SEND ALERTS FROM TRADINGVIEW TO MT4
www.tradingviewtomt4.com
WHY RISK MANAGEMENT?
Trading can be very lucrative, we all know that, hence; why we became traders in the first place. Whether you found an awesome indicator script on TradingView, an Expert Advisor on MT4, or whatever other strategy that got you excited about trading in the first place; you will lose no matter how perfect a strategy works.
I started trading with a strategy that had over 60% win rate and still lost half of my account. You may think I’m an idiot. I just didn’t understand it’s more important to know how much you can lose rather than how much you can make. So from now on, forget about gains. If your strategy’s win rate is above 50%, focusing on how much you can lose will always be more important. The gains will come on their own after that.
Risk management is simple and only involves basic math. So let’s start with that: To understand the calculator in it’s entirety, you must know how to calculate profit from a winning position. We’ll use a FOREX example.
Let’s say bought 1.00 Lot of EURUSD at 1.00100, a couple hours or minutes later, you closed it at 1.00200. First you subtract Close Price from Entry Price to get the amount of points you gained:
1.00200 - 1.00100 = 0.00100
100 points gain or 10 pips
To calculate dollar profit you multiply by Lot Size and multiply again by 100,000.
0.00100 * 1.00 * 100,000 = $100
Gain * Lot Size * 100,000 = $
Great, so you made $100! If your balance was $1,000, you just made 10% return, amazing! But.. what if the trade had gone wrong? How do you even calculate how much you might lose? Well first, you have to choose a Stop Loss, this varies depending on your strategy. One of my 30m strategies has a Stop Loss between 150-200 points, while a 4hr strategy might have a Stop Loss between 600-650 points.
Let’s say you’ve made up your mind and you’re going to choose a Stop Loss at 150 points, which means if price is at 1.00150, your stop loss would end up at 1.00000 on a Buy Trade. The key thing first is deciding what % of your balance you’re willing to risk. If I have $1000, you might be okay with losing 5%, which is $50. Now you use the formula above:
Gain * Lot Size * 100,000 = $
In this case, we would substitute Gain with Stop Loss value instead.
Stop Loss * Lot Size * 100,000 = $
150 * Lot Size * 100,000 = $50
As you can see, we have to solve for Lot Size because we don’t know exactly how much to trade yet if our trade hits our Stop Loss, we’ll only lose $50. I won’t go into the algebra, so here is the final formula:
Lot Size = 1 / (SL in Points / (Capital x Risk%))
Lot Size = 1 / (150 / ($1000 * 5%)) = 0.33
Trading 0.33 lot size with a hard Stop Loss of 150, we’ll only lose $50 or 5% of our balance.
That’s basic risk management, and it’ll save you headaches from losing money on your trades. Don’t worry about doing the math yourself though, use our bot that auto-calculates your position based on your risk. Happy trading!
SEND TRADES FROM TRADINGVIEW TO MT4
www.tradingviewtomt4.com

Position Sizing in Trading - Educational VideoHello traders. In this Educational video I will talk about Position Sizing in trading. You know as a trader that the first part that you have to do when you're ready to get into a trade is how much you are willing to risk per trade. Position sizing refers to the number of units invested in a particular security by an investor or trader. An investor's account size and risk tolerance should be taken into account when determining appropriate position sizing.

Renko Dynamic Index and Zones - Video 3Continuing on trade ideas from video 2 for Renko Dynamic Index and Renko Dynamic Index Zones using a few simple rules.
Other indicators powered by the Renko Engine :
Renko RSI
Renko Trend Momentum
Renko Weis/Ord Wave Volume
Renko MACD and Renko MACD Overlay
Strategies:
RSI-RENKO DIVINE™ Strategy

Renko Dynamic Index and Zones - Video 2I start getting into how I trade the Renko Dynamic Index and Renko Dynamic Index Zones using a few simple rules. I introduce some new coloring schemes and trade direction discovery algorithms.
Other indicators powered by the Renko Engine :
Renko RSI
Renko Trend Momentum
Renko Weis/Ord Wave Volume
Renko MACD and Renko MACD Overlay
Strategies:
RSI-RENKO DIVINE™ Strategy

Do Robots (including Expert Advisors) work?> Robot you code yourself
-> Risk Taking
-> Market making/arbitrage
In both cases the robot will likely not be overly simple. You will need to know a thing or two about programming.
Learning to trade is like getting a degree, learning to code is like getting a second one.
-> Risk Taking
This may very well work. I do not know of anyone that does this and is profitable over more than just a few lucky months, but does not mean it does not exist. I have heard of people that tried it, even people that told me they would let me know how it went they swore they cracked it, have not heard a word since then. Also, myfxbook is full of automated systems that end up blowing up.
If it is possible, you have to monitor the market all the time, be careful about events, look for evolving conditions.
I do not see how a fully autonomous robot - you can go to holidays and come back and find money in your account - could be programmed. Would be so complex...
Are there any profitable traders that are interested in this?
-> MM & Arb
There are plenty of hft and quant firms out there. Among other things they buy order flow from Robinhood and soon other "zero commission" brokers. Old market makers that did not want to move to algos just quit and did something new.
I see them mostly as mm or parasites. They can be so anoying. I used to market make on crypto 2 years ago, the parasite would just jump in front me all the time. Any order I place he'd hop 0.0001 higher/lower. Front running bots. It's not all front running bots of course. Soros & Jim Simons (I think) run statistical arbitrage funds. Computer farms to treat a ton of data help.
It works obviously.
For stat arb you will need: Learn the basics about the market (6 month course), an intermediate programming degree (1 year), a statistics phd (8 years). Good luck.
For market making you will need: Learn a bit more than the basics about the market (1 year, don't need the speculating course), a programming degree (1 year). I am being nice with the numbers I think.
> Fully automated robot you purchase
Pros and Cons
Also,
I don't even know how it is legal, it's pretty dangerous. They sell you some fairy dust and also you get advised to "hold on" "do not be emotional with fear just hold" "be strong during drawdowns they are normal" it's actually risible.
New traders that might be a little gullible, a little greedy too will end up with some fairy dust that is guarenteed to bring their account to zero, they do not understand the markets, AND to top that, they hear that they should not panic about losses and just persevere because drawdowns are normal and they are just experiencing fear, this is what will make them lose, and this is what the robot is here to fix. "Just trust".
What you have here is a recipe for disaster.
> Robot that executes for you/semi automatic
Why not?
I see a few possible uses:
- You want to buy alot of shares of a small company long term, you set a bot to purchase some each time the stock has a strong down momentum with volume (fills you without moving the market)
- You want to sleep / take a few days off, you run an algo that will move your stop loss each time the price goes up, would not be too hard to say "use the smallest of EMA 20 0.236 ATR something else, if consolidates move closer, if price == .... then do this, ifelse the price surges then move my SL closer" etc.
- You could have a feel for the market and be very bullish, just set a bot to buy an inside bar bull break with a couple of conditions, or a pullback of a certain % but still above a certain level/MA followed by a pin bar. Sets and trails the stop loss too until you intervene because conditions have changed and you do not want to stay in or whatever reason.
- Big one: monitors correlations for you. I'd actually recommend that. A robot to warn you of your global portfolio correlation, maximum risk, and makes some recommendation (shows what are you most correlated positions making a problem, and lists stocks/currencies/futures that are uncorrelated or negatively correlated)
> Robot that alerts you
Plenty of people use that. Makes perfect sense. Something just warns you when the price does something particular or whatever. I myself mostly use trading view price alerts. I just set an alert on Bitcoin MA50 & MA200 makign a death cross, should fire up by Halloween.
I would not go overboard on this for "advanced" things, because it could get complicated, and a quick glance is even better anyway, you want to focus on what pops out "obviously", you want to see what other people are seeing on the chart.
You may want to be long on certain currencies, the bot could tell you when the price is starting a pullback...
> Indicator (sold)
There are people that dish out indicators and show people "See? Here, here, and here, my indicator fired a signal right before Bitcoin went up", and people actually get excited by it and want to purchase... And guess what? It works extremely well with crypto enthusiasts that invested in imaginary magic internet beans. Who would have thought they were gullible and dreamt of easy money fall out of the sky? The coders use the right combination of indicators, for example EMAs and candlesticks, to generate great signals IN THE PAST.
I made such an indicator myself just to show it's bollocks. I think some people still used it seriously.
Black box "predict the future" nonsense ==> Obvious scam.
So watch out for those. If you are interested in something, make sure you understand WHAT IT DOES.
Example: If the indicator provides you with order book info and idk things like this that you don't have with your broker and charting service, it obviously has value...

Chế công cụ đo Risk Reward bằng Fibonacci RetracementVui lòng xem video, do mic bị hư nên không có tiếng, nhưng video đã rõ cách cấu hình, lưu lại template.
Lưu ý số 3 là tỉ lệ RR=2, không được như bên MT4/MT5.

Every market is very different. You have to be a specialist.There is a good reason firms hire people to trade a single asset class (oil, cocoa, us bonds...).
And at the other end of the spectrum: Fresh retail traders start following a signal newsletter, they don't care about learning how markets work, they could not care less about history, fundamentals, etc. They follow some dumb service that pumps out signals on 50 FX pairs, 50 cryptocurrencies, and 20 futures. They chase trades, "as much as possible", and get rekt. This is different than baghodlers that buy something and hold it to zero they are another category. The 2 groups (noob retail short term gamblers and noob bagholders): They DO NOT WANT TO MISS OUT.
You're not going to compete by looking at a hundred different charts.
I am all for diversification thought, I don't think watching a single chart is the only way to go.
And what are going to do when your 1 asset is not going anywhere?
It's best to start with only one, till you know what you are doing.
Then add another and get comfortable with it, and another. That's my opinion.
A way to still be rather focussed while having a large watchlist, is to have your watchlist made of things that work similarly, that you understand the ins and outs of, have some experience and backtested it, AND just 1 strategy (including variations).
Also, the shorter term, the less you can work on. Don't day trade, it's stupid. 98% lose and those that win make $3000 a year on average, something like that.
Are there any merchants that throws his wares in the bin every evening? Even restaurants don't throw everything...
And are you going to analyse 50 different currencies in depth every week? Even if you don't lose your mind, I have my idea about the quality of those 50 analysis.
The only people I know of that do that and make money with it are:
A- Trading educators that tell you it works and you can turn $500 into $500,000 in 2 months with no risk.
B- Signal providers, robots sellers, copy traders.
There were some people that looked at businesses and they found something like less than 1% of their products made 90% of their profits, and the rest was just a waste of money.
Are you going to spend 99% of your time working on things that don't work and paying comissions? Which eliminate anything you made with the remaining 1%.
Here are my watchlists, which I analyse every weekend, set price alerts, and then during the week I will go in more depth on 1 to 5 of them (out of 22):
I like big things, all volumes are above $10 billion.
My typical holding duration is pretty short, 3 days to 2 weeks.
I also look at indices because can't ignore this, and Bitcoin because that's what every one talks and cares about (we are very early thought).
I find 22 charts (with alot of similarities) manageable, but this amount is too much for most people.
I consider myself to have capacitites to process alot more info than other people in a short time. I have an informed opinion on all of the 10 currencies I watch (17 pairs made of 10 currencies) as well as 5 commodities.
And I spend my entire days every day looking at the newsflow on these currencies and commodities. Got nothing else to do.
And even then 22 charts might seem much, but alot of them share the same fundamentals/news.
Pound pairs all intersect with pound news and the associated major news (GBPAUD + AUDUSD + GBPUSD...).
Plus remember I really only have 1 very specific strategy (there are variants but it works the same), will set price alerts on support, and then I will spend alot of time on the handful of charts that pop an alert.
I call myself very smart with big capacities, people say it's arrogant, no one complained when from school to work I was always misunderstood, I had to dumb down my ideas, people found me weird.
No problem then, not a single person complained about me being called weird, my ideas "too far fetched", "distorded mind", but if I dare call myself a genius "WHO DO YOU THINK YOU ARE".
It just makes me cringe when average Joe Schmo the struggler that had so much difficulties understanding basic maths at school, think he's going to land here, with his day job, part time day trade 30 currency pairs and 20 cryptos with his stupid indicators and signal service, and think he is going to beat the top brains of wall street and most exceptional individuals in the world. LOL XD The delusion is too much to handle XD
With all my my watchlist, Elliot Waves work great. Also trends, support and resistance, and bottom patterns.
Now I will quote St Louis Fed on FX stocks & commodities:
Personally I do not think agri is not to be included in "commodities".
They have infinity repeating patterns, but my uneducated guess is what drives them most is "news" (trade taxes...) and the weather.
I will link my source for once: files.stlouisfed.org
They say that perhaps the returns are not proof of market inefficiency but compensation for risks taken.
Market efficiency. Seriously anyone that thinks markets are efficient is a friggin moron.
Humans are way more stupid than they think. They have to be the most delusional creatures in the entire universe.
When european indices in japan trade for 5 times the price, it's efficient?
Price to earning wildly fluctuating is efficient? Wat? How?
Just show those people ignorance.
"It's impossible to make money, I tried and failed, if it was possible it would mean I am an imbecile, this is impossible".
Drop the 70 charts. A handful of uncorrelated currencies or commodities or stocks is all you need.
I would advice starting in the first 1-2 years with 2 or 3 different charts and get to know them.
You could work your way up to a dozen, but if they are all completely different that's too much even for a genius (which you very probably are not).
The lower amount of charts you look at, the more patterns you will recognize (but I think having a decent knowledge on more than just 1 is important), you will know what the long term charts are like without having to check all the time, you will know the entire news history of it, as well as how the price reacted, and so much more. Good luck just remembering the weekly chart for 50 different currencies and indices.
All the famous betters are known for getting very much in details on a few select commodities currencies or stocks, and making big winners.
All Jesse Lauriston Livermore was trade Union Pacific, short the stock market which made him rich, and deal with cotton right? He did not touch alot more than this did he?
George Soros is famous not only for trying to destroy the world (I think I understand what his reasons are), but also for making big bets on currencies.
He finds one he does alot of research on it, there is not stupid robot pissing out random signals every 10 minutes. Well actually now that he does quant...
But that's different.
William Delbert Gann only focussed on agri commodities (correct me if I am wrong but the full list is Grains Cotton Lard not even sure he traded all of those).
Richard Dennis ==> Chicago Commodities
PTJ ==> Stock Market
Warren Buffet & his sidekick ==> A few stocks, and some fixed income. In their whole life they only ever really owned a few stocks.
Charlie Munger "See your whole life decisions as a punchcard with 20 holes in it..."
Apart from trading educators there is NO ONE that got anywhere by being a machine gunner firing from the hip.
All the successful traders in the world have, are, and will always be, snipers with devastating power & precision.
(Not saying you should not supplement your core analysis with watching other markets that have an impact - big indices for examples are important to understand the big picture).
Stop following machine gunners, learn to obtain lazer focus, understand the ins and outs of a few select instruments, and you will see your performance go up, as well as should have a much clearer mind and be more "relaxed" (which in turn will give better results).

4H BTC Waves+ Signal charting, full blindFully blind signal charting followup for Waves+, BTCUSD 4h.
All horizontal lines/signals were plotted with the candlestick chart hidden and not visible. Additionally, this time, all directional trades and exits were determined with the chart hidden.
Additional signal explanation and rationale is detailed in yellow text, annotated on the chart/indicators.
8/10 Trades closed in profit (green checkmark). 2 Trades marked with red X were below 2% profit margin, and are considered a loss unless high leverage is used.
Setup/configuration:
Initial setup with Waves+, DOSC (Derivative Oscillator) with signal line disabled. 1-2 bar delay on signals to provide accurate/realistic demonstration of entries/exits (on bar close).
Waves+ has the LSMA line enabled (dark blue).
Waves+ is a hybrid wavetrend fibbonaci oscillator.
Waves+ components:
Light blue line = Waves line
Dark blue line = LSMA line
Red line = Mmenosyne follower (fib line with medium speed)
Green line = Mmenosyne base (fib line with slow speed)
Shaded yellow zone = Explosion Zone warning (Ehler's Market Thermometer)
Red/green center dots = TTM Squeeze Loose Fire(red), TTM Squeeze Strict Fire (green)
Lower dotted line = 38.2 fib line
Upper dotted line = 61.8 fib line
Lower dashed line = 25 wavetrend limit
Upper dashed line = 75 wavetrend limit
Blue 1/2 height block = suggested TP from short/drop incoming 1-2 bars
Orange 1/2 height block = suggested TP from long
Chart markup:
solid green = buy/long signal
solid red = sell/short signal
dashed red = early sell/short signal
dashed green = early buy/long signal
dashed orange = suggested exit from long signal
dashed blue = suggested exit from short signal
Trades closed in profit/loss, no stops, marked up on chart:
Trade closed in profit = green checkmark
Trade closed at a loss = red X.
Trades that are less than 2% in profit will be considered a loss for scalping unless leverage is used.
Incremental for this blind signal test will be documented below/updated as part of the trade idea/post.

Release: [AU] Waves+Plus version of Waves with components from both Waves Advanced and Mnemosyne. Essentially, Waves+ is highly configurable hybrid wavetrend oscillator and Fibonacci oscillator.
Pictured to the left are the various indicators that represent incremental steps/advancements toward the development and eventual refinement of a hybrid wavetrend fib oscillator.
Waves+ is available as part of the AU indicator set - contact for trial availability and pricing.

Can you make money by understanding indicators? -- on the core s
Often hear everybody say, my skill is not good, lose money again, teacher, can you recommend a useful index? Or talk to me about a metric and how you can modify it to make yourself invincible. Whenever I hear such questions, I feel helpless. In the past, I've said more than once that making money has nothing to do with technology.
Have you ever wondered if the people who invented the metrics would all be billionaires if their technical analysis skills were directly proportional to their earnings? Even if not all indicators work well, should the inventors of the magic metrics that the market is talking about be very rich? Because we all think they're good at it, they're the inventors, they're better at it, but I think the answer is no. By now, I know trading geniuses who try to sum up their experience into technical metrics, but the inventors of rare metrics become billionaires with their metrics. If so, I believe he is first and foremost a top trader.
This as a good coach is not a good player of logic, the deal itself is independent of the work, he needs the quality is not based on the technical condition of the single, but a more comprehensive psychological factors, many top gambler, they are not highly educated scientists, leamer, is the most typical case, a person's intelligence and education not proportional, many successful people, not through the system of learning, of course, we don't deny the importance of system study, but first of all, if you have enough intelligence quotient, such ability.
Back on technical analysis, I often say, analysis and trading are two levels of matter, my analysis is one of the upper level should be, but I don't think he is a good trader, because I don't have trading quality - courage, a lot of people can make money, that is not based on technical analysis, but based on their boldness, at a crucial moment can be an determination, this is one of the best traders. If you are a decisive person in daily life, learning trading skills, the success rate must be higher than technical analysis very good, but lack of courage.
Therefore, in large institutions, analysts and traders are two departments of people, who play their respective expertise to achieve a win-win goal. Of course, in reality, there will be people who combine analysis and trading, but such people are rare, not everyone can do it.
As far as I am concerned, I prefer to spend time on the technical analysis, because that is my hobby and expertise, and do a person want to make money, you should think about, whether I should be a focus of traders, because most people cannot be the combination of the epoxy resin, it is the best in a make a trader can you make money in this market is the key.
So we can see that the level of technical analysis is not necessarily related to making money, so what is the core technology of making money?
I think should be the point of view, a lot of people said that, I also know the up here, I also saw the risk, but I can not control myself, want to win so afraid to lose, is based on our state of mind, because we are born with human greed and fear, cannot be wiped out, unless you can attain buddhahood, also need not deliberately blame yourself otherwise.
In my community, usually I like to say a word, is to tell you that my analysis level are not much higher than anyone, but my mood is very good, because I can stay out of my character, relatively rational and objective to analyze things, like the poem said: not looks like, the good luck body is in the mountain. Most of the time, your attitude is based on your position. It has also been said that the position determines the position, when you hold the chips, you will automatically look long, even after professional training, not anyone can do not be affected. So don't deliberately force yourself to do the impossible task, as to do their own more expertise.
One of the things that I do in the community is to constantly alert people to the risks, to warn them, to control their mindset, which I think is the best help I can do, far more meaningful than a correct analysis.
So I think we can also try this way, don't try to look for any advanced technology, what only makers know secrets of indicators, who is but you are not confident performance, a top traders, must first have good state of mind, can be in a bad hand, lose don't even less, while a good hand to a big win. Such a trade, in the long run is completely able to beat the market. We all know that warren buffett is a master investor, and if you look back over the last 30 years, he became a master not because he made more money in the long market, but because he lost less in the short market.
The accumulation of wealth must be seen in the short board of the barrel. The hardest spear may not keep the warrior alive, but a good shield may bring a longer life.
If you can look at every trade, as a turn-around, round and round, believe that you can become the winner of this market. Remember that a good trader is not necessarily a good analyst, nor is he the one who makes the most money at one time, but a person with a strong ability to make money consistently, a person who trades with a normal heart.

XBT Dancing the Contango and Farewell to XBTU19 data?This idea is to expand on my recent observations while trading Basis (spread) of futures contracts for XBT, and how recently Contango and Backwardation have been a good timing indicator for XBTUSD. For more detailed explanation, please check out my indicator script the XBT Contango Calculator in related link.
Typically I have noticed that Futures premium/discount primarily flow along with price movements. For example, when price goes up, premium goes up and vis-versa.
However, what i found most interesting over the last few weeks is there was a divergence in XBTUSD price and XBTZ19 futures premium (blue line), which i noticed for the first time. Additionally, this happened right before the BREAK See below
A primary objective of this post, is to see if publishing this idea in Tradingview will keep the XBTU19 data (orange line) plotted by the XBT Contango Calculator. I have found that charts of expired Bitmex Futures are not available on Tradingview after expiration. Studying XBTU19 September futures has been very useful for trading over the last few months and hope this post will stand as a record on how Contango and Backwardation in XBTU19 contact affected price action (assuming data doesn't disappear after 9/27). If anyone knows a way to plot historical Bitmex data, please help me out. I believe it can be pulled via API from the following link, but I am not able to figure it out.
www.bitmex.com
THE FOLLOWING ARE TWO REASONS WHY I WANT TO STUDY HISTORICAL DATA FROM PREVIOUS BITMEX FUTURE CURVES. I think both of these scenarios could represent the two directions we have at the current moment. As you will see, if past futures curve data was available from these time periods, it could be helpful in deciding which direction to trade.
EXHIBIT A - Mid November 2018, price drop after consolidation triangle
EXHIBIT B - Mid July 2017, price pullback and continuation after consolidation triangle
Let me know your thoughts?

Crypto Trading Terminal for Binance coming soon!Hello!
My name is Alexander Orel, I am the founder of the TradingPanel.pro.
Since 2017, my team and I have been doing private testing of trading on Binance and Bitfinex.
For 2 years we got excellent results and it was decided to build trading platform for everyone.
In October, we plan to launch the service, but now you can register on TradingPanel.pro.
For all registered now there will be pleasant bonuses.

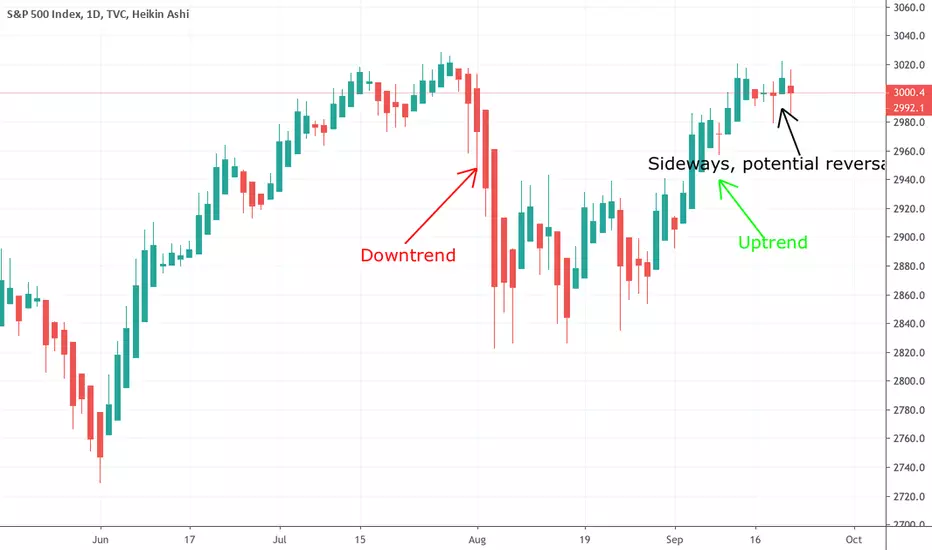
Heikin-Ashi CandlesA new candle type that I think I prefer to use because it does a better job showing trends and potential reversals than regular candles. If nothing else its another tool to help other than the usual indicators I use. I am going to start posting more educational material. We can all get the same team and help each make more money.
The formula for these candles are:
Close 1/4 (Open + Close + Low + Close)
(Average Price of Current Bar)
Open 1/2 (Open of Previous Bar + Close of Previous Bar)
(Midpoint of the previous bar)
High = Max (High, Open, Close)
Low = Min (Low, Open, Close)
EToro stock watchlistsA new generation of investors is starting to approach trading thanks to new user friendly platforms like eToro. These platforms offer an easy to user interface and a basic charting tool.
However, after gaining some experince, many investors feels the need of more advanced charting/screening tools like the one offered by TradingView (Etoro does not offer any screening tool, as today).
Trading view is a great tool but I noticed that eToro just trade a very limited subset of stocks and using the trading view screener can be very fustrating because there is no way to filter only the stocks available on eToro.... until today.
I created a list of watching list containing all the stocks traded by eToro. You can download them freely from the repository in my sigature (I don't have the needed reputation to add external references in this idea).
Be aware that some symbols code are different between eToro and Trading view: I did my best to find the right symbols, but please double check before to use these lists.
This is how you can screen your watch list:
1) Go to the watchlist you want to screen
2) Right-click in the watchlist and choose “Flag all symbols from this list only”
3) Go to the Screener and select “Show flagged symbols only” in the ticker column
4) You can now start screening the symbols from your watch list
I will try to keep the watching list updated. Please feel free to report missing/wrong codes here, so I can correct them.
Have a nice trading

Renko MACD and Renko MACD Trend IntroductionI introduce the Renko MACD and Renko MACD Trend indicators.
Other indicators powered by the Renko Engine:
Renko RSI
Renko Trend Momentum
Renko Weis/Ord Wave Volume
Strategies:
RSI-RENKO DIVINE Strategy

HOW TO READ THE BTC DOMINANCE CHART AND WHY YOU SHOULD USE IT!So, the title is obvious. Why should you be using this chart. Well unless you want to keep your Bitcoin, pin your ears back.
When BTC dominance is going up and keeps going up it means only one thing. Bitcoin is moving faster than alt-coins meaning your alt holdings are bleeding BTC at a heavy rate.
Too many people think they are winning in this industry because USD is up... When in actual fact they have lost a couple of BTC without noticing.
So take note of the dominance chart. Set an alert within a trend. If it is going down, look at altcoins to trade. If it is going up hold Bitcoin.


Options Trading Basics [Part 2]Continuation of Part 1. Recap of last video plus a lot more focus on how you would actually trade options.


Dropping Nuggets to Help You Win More in the MarketsIn this educational tutorial I cover key areas to help you succeed in your trading. You will see from my shares that I do capture hundreds and sometimes thousands of pips weekly. Please enjoy this and I hope this helps you as you trade the markets. At the end I give you information on how you can obtain free materials to help you learn this skill of forex trading, namely price action trading and naked forex.

A quick template for forex trading with EasyBee59Copying is the fastest way to have an investment chart setting into your own TradingView account. The chart like one on this page can be copied for your usage immediately by clicking on the megaphone (Share) symbol under it, then click on "Make it mine" button. This template is suitable for forex trading.

Beat the Crypto Market & Earn Bitcoin by Trading Trends!Welcome to Crypto Stanley Trading!
Our success over the last year as a group has been predicated on trading our tried and true group algorithm bot. Since the beginning, we have preached that in order to consistently beat the market, a trader must remove his or her emotions from the trade. By using the Crypto Stanley Trading signal bot, you can effectively remove your biases and trade mechanically, thus improving your overall odds of success.
For those seeking to become a Crypto Stanley trader, you Crypto Stanley Trading System is a position based, trend trading strategy that looks to capture the “meat” (~80%) of a trend and ignore intra-day volatility. Its premise is simple: enter when the prevailing trend seems to be shifting and add to your position as you get additional confirmation of the trend reversal.
From the start we aspire you to take action and trade the way YOU want to trade. Already a seasoned vet and want to take advantage of our trend trading signals? Do it. Eager to learn the complete trading system that has taken people with zero experience and turned them into full-time traders? Do it. Want access to the indicator in order to develop your own trading system? Do it.
Our group is open to ANYONE and EVERYONE willing to put in the time to change their financial lives.
If you're interested in learning more, please message us for an invite to our Discord server!
