Beat the Crypto Market & Earn Bitcoin by Trading Trends!Welcome to Crypto Stanley Trading!
Our success over the last year as a group has been predicated on trading our tried and true group algorithm bot. Since the beginning, we have preached that in order to consistently beat the market, a trader must remove his or her emotions from the trade. By using the Crypto Stanley Trading signal bot, you can effectively remove your biases and trade mechanically, thus improving your overall odds of success.
For those seeking to become a Crypto Stanley trader, you Crypto Stanley Trading System is a position based, trend trading strategy that looks to capture the “meat” (~80%) of a trend and ignore intra-day volatility. Its premise is simple: enter when the prevailing trend seems to be shifting and add to your position as you get additional confirmation of the trend reversal.
From the start we aspire you to take action and trade the way YOU want to trade. Already a seasoned vet and want to take advantage of our trend trading signals? Do it. Eager to learn the complete trading system that has taken people with zero experience and turned them into full-time traders? Do it. Want access to the indicator in order to develop your own trading system? Do it.
Our group is open to ANYONE and EVERYONE willing to put in the time to change their financial lives.
If you're interested in learning more, please message us for an invite to our Discord server!
Trading Tools

You need to create your own Market Profile.Market Profiles allow you to understand the structure of price action, you can alter your profiles to be specific for buying or selling. Having a universal plan shows you where price is going to range, if it sticks to principles of bullish action (Higher Highs, Higher Lows), you can deduce where the next levels of interest are and vice versa.
Interest areas - the orderblock levels - are areas to consolidate at or reject from. They are created during up moves by selling and during down moves by buying. Any time you see price stall and move around, creating anxiety and confusion, that's an orderblock level. The orderblocks appearing on higher timeframes have more strength than lower timeframe ones, this is the same for all aspects of trading.
The IV Zone is the last call before price structure breakdown, this area of the structure holds all the weight as this is the only area which can reject or validate price action.
Breaking out of the IV Zone will always be tested, the time is the variable which decides that.
Rejecting from within the IV Zone return price to the test the opposing IV Zone.
To explain the last point further:
If price rejects from the top IV Zone, the highest price paid, it goes to test the lowest amount willing to be paid, the bottom IV Zone. This is what gives markets their ranging/sideways action, this is where a lot of money is made by skilled traders and coders, they're providing liquidity and being compensated for playing the range.
I made this for myself, you can study this and try it for yourself to see if it helps you understand price flow better.

My TOP 10 Posts! Must Reads for Beginner Traders!I wrote more than 1200 posts in TradingView. The majority of them are trading ideas and market overviews. Even if they helped you to make tons of profit, I think their value is much lower than the few educational posts I published.
I am a person who believes that knowledge and experience are the main elements of success. No matter in which field, if you know what to do and if you have experience - one day you will reach your goal.
Trading signals are just one tool which can't make you a successful trader if you don't have knowledge and experience.
I would like to collect all my best posts in this one, just in order to tell one more time to novice traders the which are the important things in trading. You can read my best posts, of course from my point of view. I did the best for adding value to this community. And I hope the real value, from my side, can be seen in these posts.
This is Why Beginner Traders Lose Their Capital – 1. No Strategy
This is Why Beginner Traders Lose Their Capital – 2. Risk/Reward
This is Why Beginner Traders Lose Their Capital – 3.Trade Volume
This is Why Beginner Traders Lose Their Capital – 4.Overactivity
WHEN CAN YOU START TRADING FOR A LIVING?
90% of Traders Lose Their Money! Do You Really Want to Succeed?
The Key Elements to Succeed in The Financial Markets
Trading Signals Won’t Make You Rich!
Trading Signals Won’t Make You Rich!
Spoiled Community and How to Become Successful
Good luck in your journey in the financial markets!

The Key Elements to Succeed in The Financial MarketsIt was expected that the main message which I tried to pass to you in the last educational post would not be so popular. I tried to talk about things which are not catchy and their effect will be shown only in time. Work hard and reach your goals. Work hard and become a profitable trader. Work hard in order to get access to new opportunities. But at the same time, I got an additional confirmation of why 90% of people fail in trading. Why «gurus» and «legends» are so popular and why the community was spoiled by pushing forward simple solutions which can make millionaires from everyone. On the other hand, not too many millionaires here, so it seems the quick and easy route, as expected, does not work.
We have to understand that the majority of people in any trading community is made out of people who don’t have an interest to become successful and change their life to the better. They want to become rich as soon as possible and, for them, sweet dreams have higher priority than hard work with real results. For those, who could get the message correctly, we will move further and in this post.
Let’s talk about the key elements which any successful trade must have.
Let’s talk about the basis of success!
Let’s try to make the clarification of what you must have for profitable trading and which tools to use.
It’s pretty simple – there are 3 key elements.
KNOWLEDGE, EXPERIENCE and TOOLS - are everything you need to succeed in the financial markets!
There are no other ways or magic tools which can bring you to success.
Only these 3 elements will become the solid basis for reaching your goals. Let’s talk about them with more details.
KNOWLEDGE - you should be very naive thinking that you can become successful without knowledge.
But it is not sufficient and you can’t stop half way: knowing just a part of what is required won’t be able to move you to the top in any field.
Knowledge is what separates novices from professionals. The level of knowledge makes the difference between failures and success.
Look around...
How many people you can find who become successful without knowledge in their field? I guess not so many.
I guess Elon Mask reached his level only because he is smart guy and he spent many hours learning something new. That’s why he holds 2 degree in physics, one in economics one in business and a PhD in energy physics. I’m sure his level of knowledge allows him to think out of box and create the things which can change the World.
Mark Zuckerberg had good knowledge in programming and it helped him to create Facebook. I want to know, could someone create something big, interesting and useful, or just reach the top without knowledge? I think we all say - it’s impossible and it will be the correct answer. An attempt to build something or reach a goal must be supported by the knowledge in that field. And it’s logically. And what is illogical then? Novice traders deciding to base their decisions on little knowledge or none at all.
Why when you start trading you decide to skip knowledge and you don’t want to waste your time and efforts on acquiring it? How are you going to become rich without the most important element?
Knowledge plays a very important role. It gives you the solid basis for your growing as a trader or investor.
Knowledge helps you to understand what you are doing and how you can reach your goals.
Knowledge allows you understand where you are right and where you made mistakes.
Knowledge helps you become better.
Day by day reading about trading, you grow as a trader. With solid knowledge you have a solid support behind you which helps you move in the right direction and reach your targets. The Real World is open for everyone who wants to improve himself and become smarter. The Internet provides tons of knowledge. You get any answer you want just by typing the question in Google. And you just need to make this step and start learning what you have to know for successful trading. When I tell you - you must work hard for become successful - think about it as you have to put all your efforts for getting new knowledge in the field where you know nothing. Everyday try to learn something new. Try to understand what you did yesterday and how it effected on you. Get knowledge from books, articles, videos, courses and become better day by day. I started 12 years ago and to this day I still invest regularly into new knowledge and I will continue to do so in the future as well.
Start each day thinking - Knowledge is Priceless! Try to spend each day a bit of time to learn something new. Find the time, put your mind to work and put efforts in learning how to read the financial markets. Even if you spend 30 minutes or one hour per day in some time you will be able to create a solid basis for the next 2 elements which you need to reach your goals.
EXPERIENCE - the 2nd element after knowledge. Probably you already know how experience helped you in your life. How it helped you to avoid mistakes or do something in the right way. Experience in all activities plays a very important role too and the same goes about trading. If you passed through some situations, there is a good chance that in the future passing through the same situation you will do things faster and better and in a correct way. Experience allows you to do things properly and in combination with knowledge it creates something really powerful. With these two elements you will know what to do and how to do it.
Let me give you a simple example:
You started trading without knowledge and you blew up your money. Which experience did you get from this? If you don’t care about knowledge and experience – then you would not have paid attention or learned any lesson from this. You would repeat again the same actions and by no surprise you will meet again with the same result.
But for those who would like to really succeed in the financial markets you should take some lessons from the previous scenario:
- you lost money because you made something wrong, analyze what that was
- you made mistakes because you did not know how to trade properly, now you know how to avoid blowing up your account if you will be in a similar situation
- if you do the same next time and change nothing, you will get the same result.
So next time, you will try something new based on your knowledge and experience, and expect a better outcome. The past experience can protect you in the future and help you to avoid mistakes. Also the past experience can help you to improve yourself in order to get better result. Knowledge will give you the ideas which you will apply in order to become better. Experience will remind you when to apply which knowledge for which particular situation. It’s a very simple example of how experience in combination with knowledge can make better results for you. But there are millions of different situations which can be useful for you and can help you to become better too. You just need to gather your priceless experience and combine it with your knowledge in order to become better.
The problems of all novice traders are:
- they don’t understand the future effects of their actions in the present
- they don’t have the necessary experience to know why not trade without stop orders or why they need to follow the proper money management strategies.
Knowledge can explain these simple things, but not all of us like to follow the theory without trying it by ourselves. Probably we must test it in order to trust it, and that’s ok it’s human. That is why personal experience plays such an important role. When I told you - work hard – I meant that you have to spend time and put efforts to combine your past experience, make your analysis, understand it, learn from it and use your newly gained experience in the future.
You can get experience from everywhere. Every trade can give you a piece of experience and it does not matter if it was a winning or losing trade. Both scenarios are good teachers. Every mistake which you made is priceless for your future. Every new market movements can give you insights on how to act in the same conditions later. Everything which can be learnt from experienced traders should be taken by you in order to grow your personal experience faster.
TOOLS – the third element, and the one which is the most popular among the novice traders. TOOLS combine everything which helps you to trade and make money in the financial markets - trading signals, trading strategies, trading robots, market overviews - all these make up the tools we use. Novice traders like to think that they only need a profitable trading strategy or profitable signals in order to start making money.
Unfortunately no. That is so far from real trading. Trading Strategies and trading signals won’t make you rich because of several reasons.
Trading signals like trading strategies are only a tool.
Can you imagine that you will become a good musician only if someone can give you a good musical instrument?
Can you imagine that you will become a good photographer only if you can buy a good photo camera?
There are many example which can be taken confirming the main idea - tools are just tools. If you don’t have the knowledge and the experience to use these tools, they will be unworkable and useless for you. That’s why the same situation we can see with novice traders, when they search for and get tools, but know nothing how to use them correctly.
Not all tools can be suitable for you and your goals.
For example, if you want to create music, probably a photo camera is not the best tool for you. If you want to build something, probably a guitar is not the best tools for this.
The same goes about the trading. If you use the wrong tools which are not suitable with your lifestyle, nature, conditions and your goals – what makes you think you will succeed?
I know good examples when traders bought trading strategies for day trading, but they could not follow them because they had to work full time every day. They broke the consistency of these trading strategies and got results which were far from expected ones.
I know examples when traders started using trading signals which were focused on long term trading and big capitals. Having small capitals and breaking the rules of proper money management – their results were not amazing either.
The same goes about traders who wanted to trade following trends, but they used range strategies or trading signals based on such strategies and all these were against the nature of the movement. These traders started having negative results and lacking the knowledge and experience they were usually pushed out of their comfort zone and this feelings further made them make more mistakes and break more rules. It’s all downhill from there.
As a result, using workable tools in wrong conditions which also don’t match your lifestyle, nature and goals is never a good idea. If you do this, you will be as close to failure as possible. Don’t be surprises if you results will be far from expected ones.
In order to understand all this, you need to have knowledge and experience. Trading signals, trading strategies, trading robots won’t make you rich if you don’t have the knowledge and the experience to use them correctly. But combining these three elements, they will give you everything you need for successful trading.
When I tell you - work hard - I mean you have to put a lot of efforts trying to find the workable tools for you. But the best variant is the one where you gained enough knowledge and experience to be able to design the tools which will match all your nature, lifestyle, conditions and goals.
CONCLUSION
In this post I tried to explain to you why knowledge, experience and tools are the main elements of successful trading in the financial markets. It won’t be possible to reach your goal having only 1 or 2 of the elements. They must work together, like the legs of a tripod, 3 parts supporting each other make the solid base together.
Working hard, you will be able to gain and control these 3 elements which will help you to reach your goal in the financial markets. If you are lazy, keep searching for trading strategies and trading signals thinking that they will make you rich.
In the next post, we will talk about - what do you need for profitable trading in the financial markets.
You will learn 5 different things which every trader must have in order to make profit in long run.
If you like my work, please support it by your LIKE.
If you have something to add, ideas, thoughts, please leave them in comments. I will be glad to discuss with you. Don’t forget to read the other posts about trading, they will help you to understand better where you are now and what you have to improve in order to start heading towards the 10% successful traders.

"Make It Mine" to get your own "Honeybee59-stock 2.0" quickly.Copying is the fastest way to set a chart setting into your own account. The chart like one on this page can be copied for your usage immediately by clicking on the megaphone (Share) symbol under it, then click on "Make it mine" botton.

Time, Periodicity and Repetition in the crypto marketsIn this video I talk about how to add the component of time, periodicity and repetition in your trading. Becoming a master at observing patterns and fractals is key to success. Finding similarities between coins that pump and make the connections. I go through various coins like Komodo, Groestlcoin, Dmarket, CVCoin, Ren, Litecoin, Monetary Unit, Zilliqa and Ontology.

DXY - Monthly - Multi-Timeframe Analysis Series 1Continuing with another episode of Multi-Timeframe Analysis Series 1, I'd like to break down the DXY.
The DXY being weighted as follows:
EUR - 57.6%
JPY - 13.6 %
GBP - 11.9%
CAD - 9.1%
SEK - 4.2%
CHF - 3.6%
As you may imagine, there's a lot more interest in using the DXY for a correlation / confluence tool when trading the EURUSD. The EURO equates to over half of the overall weight of the index, meaning there's a majority interest in the EUR vs USD.
We can use this to our advantage, alongside the USDOLLAR INDEX, to add positive or negative trade factors when considering positions across USD pairs and commodities.
Comments
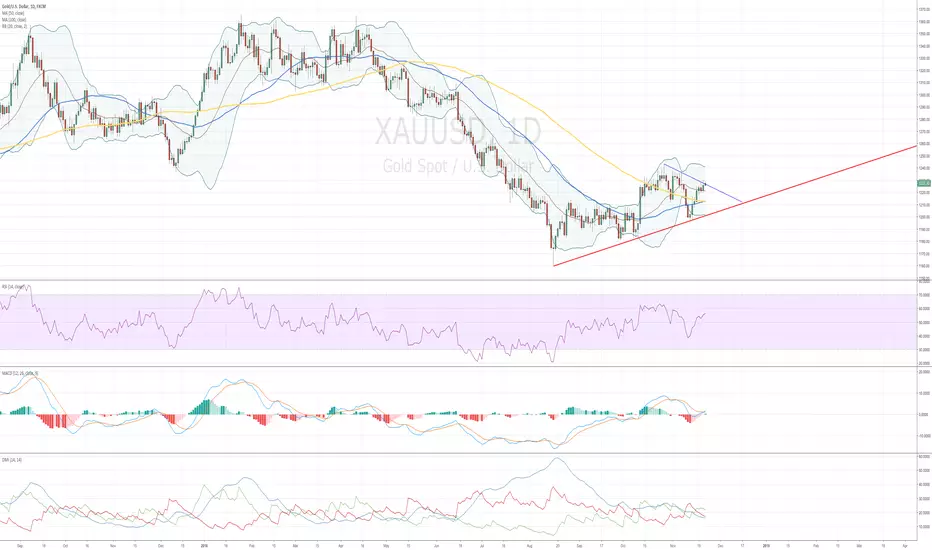
Looking at the Monthly timeframe we appear to be stalling between the 61.8% retracement of A>B as indicated on the chart. Price is showing high test candles at this level, as well as a potential rolling double top (continuation formation). Given the circumstances of this in its current form, 94.00 could easily be on the cards as we move into the second quarter of 2019.
Key Note
At time of writing this, it's the current monthly candle cannot be considered an indication of direction just yet as it hasn't fully formed (being the 24th of the month).

Stop Loss Help PleaseThis video is asking questions around the numbers on the stop side of a long position tool that TV has and how the amount number in the red changes in a strange way. please view and comment. thank you

Template for fast setting of Honeybee59-forex 2.0.C opying is the fastest way to set a chart into your own TradingView account. The chart on this page is an example of one from TradingView with Honeybee59-forex 2.0 as of 20190313. You can copy it into your account immediately by clicking on the megaphone (Share) symbol under it, then click the "Make it mine" button. It's that simple !


So What's This Irish Backstop?The history:
There's an important difference between what is known as "Great Britain" and the "United Kingdom". The first is England, Wales, and Scotland, i.e. the whole larger island on the right of the above image, while the latter includes Northern Ireland, which is part of the smaller island on the left, comprising Ireland.
This was not always the case. Until 1927, when the Republic of Ireland became an independent state, this separation did not exist and the term "United Kingdom" essentially covered both islands. Without delving into the politics of the North-South divide, let's just put it that, for a variety of reasons, Northern Ireland prefers being part of the UK while the Republic of Ireland wishes to be independent. Things were not always easy between the two, with troubles at the border, and an estimated 3,500 people dying during the 1970-1998 period before the Good Friday agreement was reached.
The current state of play:
Returning to the economics of Brexit, due to Ireland's independence, and Northern Ireland's choice to remain in the UK, the only place where the UK has a physical border with Ireland, and subsequently the EU, is where the two meet. As long as the UK is (or was) part of the EU, the exchange of goods and services between the two parts of the island is (was) almost restriction-free, as common market rules suggest that products do not need to be inspected for customs and standards.
Enter the backstop:
If (or once) the UK leaves the EU, the two parts of Ireland would be in a different customs and regulatory regimes, which would mean that products would be checked at the border. The issue is that neither the EU nor the UK would be happy with such a development.
From the UK point of view, this falls within its current red lines, i.e. that it seeks to regain border control and leave the customs union. As far as the EU is concerned, this "backstop" could only apply to Northern Ireland, i.e. that there is no point in the UK leaving the EU and still be able to trade freely with it. This is not acceptable for the UK as it would effectively set its customs and regulatory border in the middle of the sea between the two islands, thus limiting the extent of its power.
The problem is also more political than it appears: as the EU promoted the no-border issue between the two parts of Ireland, it was much easier to sustain peace in the region, as trade created the conditions for closer ties. If a hard border is re-established, many fear that it could reignite tensions, as the "unionists" would now not be able move freely across the island.
The proposed solution:
According to the European Commission's November release, the two regions have agreed that the Irish backstop problem can be delayed until December 31, 2020, with no hard border taking place until then. This would effectively mean a continuation of the current common EU-UK customs territory, i.e. that the UK will still align its rules with EU legislation. By July 2020, the UK and the EU should ratify an agreement which would replace the backstop, either in whole or in part, by the December 31 deadline.
As of yesterday, the small concessions made by the EU, basically suggest that the UK and the EU have the right to raise a formal dispute against each other, if one party tries to keep the other tied to a no-backstop deal.
The future:
While these concessions appear to be legally binding, as Theresa May comments, it still remains to be seen whether they will actually make a difference, as the UK Attorney General comments that the UK would have no lawful ways to exit the arrangement; proving that the EU aims to keep the UK tied is quite subjective and thus difficult.
On the other hand, this would, in theory, provide an interesting solution for the UK, given that it can maintain both the customs union and also have its own power over the border/legislation/immigration. Still, hard Brexiteers would consider this a defeat since the decision was for a full-on separation from the EU.
The only certainty is that there will be a vote today, which would have to see May's revised agreement convincing 116 parliament members to switch sides in order to be accepted. Just to provide a glimpse of how difficult that would be, the estimated odds of the UK leaving the EU without a deal before April 1st have increased since the beginning of the month. If the deal is rejected again, then the next vote, which would take place tomorrow, would vote directly about accepting a no-deal Brexit.
Disclaimer: This material is provided as a general marketing communication for information purposes only and does not constitute an independent investment research. Nothing in this communication contains, or should be considered as containing, an investment advice or an investment recommendation or a solicitation for the purpose of buying or selling of any financial instrument. All information provided is gathered from reputable sources and any information containing an indication of past performance is not a guarantee or reliable indicator of future performance. Users acknowledge that any investment in FX and CFDs products is characterized by a certain degree of uncertainty and that any investment of this nature involves a high level of risk for which the users are solely responsible and liable. We assume no liability for any loss arising from any investment made based on the information provided in this communication. This communication must not be reproduced or further distributed without our prior written permission.

Pattern Analysis; incorporating timeframes (USOIL)Understanding trends within a pattern gives analysts the ability to better understand sentiment and directional pressure.
In this example, pattern extremities were highlighted. Then, on a lower timeframe, trends within said pattern drawn.
Overlaying timeframes is a necessary part of a complete analysis, and a complete commodity analysis can help piece together economic factors affecting commodity-sensitive currencies such as CAD and AUD.

Ordered Chaos : " every Asset Class behaves this way "Ordered Chaos
every Wave is born from Impulse, like a Pebble into Water.
every Pebble bears its own Ripples, gilded of Ratio Golden.
every Ripple behaves as its forerunner, setting the Pulse.
each line Gains its Gravity.
each line Tried and Tested.
each line Poised to Reflect.
Confluence of 2 is Dependable.
Congruence of 3 is Respectable.
Coincidence of 4 is Worshipable.
every Asset Class behaves this way .
every Time Frame displays its ripples.
every Brain Chord rings these rhythms.
He who Understands will be Humble.
He who Embraces will observe Order.
He who Ignores will behold only Chaos.
Ordered Chaos
.
.
.
want to Learn a little More?
can you Spend a few Moments?
click the Links under Related.

Clarifying "Once per bar" and "Once per bar close" alert optionSince I can't find any official documentation about this, I am posting this to help others like me who struggled sorting this out.
When creating an alert, be it a custom alert or not:
- "Once per bar" will not wait the bar close to trigger the alert. If the condition is triggered once but ends up to be false at bar close, the alert will have triggered but will not show on the chart and backtest.
- "Once per bar close" will wait for bar close to trigger the alert. With this option you are sure to stick with the backtest and avoid less strong signals, but waiting for bar close might reduce profits.

Approximating A Least Square Moving Average In PineLeast Squares Moving Average, Running Least Squares, Regression Line or even Running Line, this method is among the most popular ones in statistics and technical analysis.
The LSMA is extremely useful, it approximate the price pretty well and can be considered as one of the best low-lagging filters out there. Knowing how this filter is made can be really interesting. May the methods i share below inspire you to create great indicators or start coding in pine :)
A Least Squares Moving Average is defined by Tradingview as :
A line that best fits the prices specified over a user-defined time period. It is calculated using the least squares method. The result of this function is calculated using the formula: linreg = intercept + slope * (length - 1 - offset), where length is the y argument, offset is the z argument, intercept and slope are the values calculated with the least squares method on source series (x argument).
Alright, we wont use the offset parameter for our approximations, so how to calculate a least squares moving average ? If you find the mathematical formula of it you will certainly ask yourself "what are all of those maths" . But its ok, in the Pinescript you can just use the linreg() function, or you could calculate it like that :
slope = correlation(close,n,length) * (stdev(close,length)/stdev(n,length))
intercept = sma(close,length) - slope*sma(n,length)
linreg = slope*n + intercept
Ok, but can we use different estimation methods ? Certainly, the key of the LSMA is only the correlation coefficient after all, all the other parameters can be estimated.
Standard Score Or Rescaling A Line To The Price
Rescaling a line to the price is easy to do, it will give a similar result as the LSMA but it is faster to write, here the code :
A = (n - sma(n,length))/stdev(n,length) * correlation(close,n,length)
B = sma(close,length) + A*stdev(close,length)
Easier no ? We first standardized a line (n) and multiplied it by its correlation with the price, our first parameter A is dimensionless .
Then we rescaled the result to the price by multiplying our parameter with the price standard deviation and summing this result to the price moving average.
here the difference between our method and the classic LSMA of both period 100
If you put both together you wont see any difference. Overshoots can be reduced by modifying the standard deviation size.
Correlation Rescaling
The correlation coefficient is the core of a LSMA, if we rescale it we can approximate a LSMA, here the code :
a = (correlation(close,n,length) + 1)/2
b = sma(close,length) + stdev(close,length)*1.7
c = sma(close,length) - stdev(close,length)*1.7
k = c + a*(b-c)
The correlation coefficient oscillate in a range of 1/-1, we first scale it in a range of 1/0. Then you may have recognized the b and c formulas, they are the one used in bollinger bands,
the standard deviation is multiplied by 1.7 because it was the number who best approximated a LSMA, but it could be any number defined by the user, something interesting is that this method to can fix overshoots in a classic LSMA using lower multiplier. Since our correlation is in a range of 1/0 we can rescale it to the price thanks to the method used in k.
In red our method, in blue the LSMA of both period 100.
Here the standard deviation is not multiplied by a number, this result in less overshoot.
In order to have even more manipulation over the LSMA i will try to estimate the correlation coefficient the best i can :)
So here you go, i hope you will find a use for it.
Comprehensive Trading ProcessDisclaimer: If you are primarily interested in copying other people’s trades then this is not for you. However, if you are willing to put in the work that it takes to learn how to trade for yourself then you have found the right place! Nevertheless please be advised that you can give 10 people a profitable trading strategy and only 1-2 of them will be able to succeed long term. If you fall into the majority that tries and fails then I assume no responsibility for your losses. What you do with your $ is your business, what I do with my $ is my business.
Consensio: (King) 5% when Price crosses Short Term MA | 10% when Price crosses Medum Term MA | 15% when Short Term MA crosses Medium Term MA | 20% when Medium MA turns over | 25% Price cross Long Term MA & Long MA flattens / turns over| 25% Golden Cross
Patterns (Queen): Favorites: hyperwaves, parallel channels, descending triangle, head & shoulders, Wyckoff’s, double bottoms & tops, flags | Least favorite: symmetrical triangle
Horizontals (Rook): Horizontals > trend lines
Trendline (Bishop): Very powerful when used in combination with Consensio. One of my favorite setups is a trendline break alongside a reversal in Consensio.
Parabolic SAR (knight): Best tool I have found for setting / adjusting stop losses. Can also be used as no trade zone. For ex: if wanting to go long and SAR is bearish (above price) then could / should wait for SAR to break before entering.
BTCUSDSHORTS (pawn) : If shorts are at / near ATH’ levels then I do not want to be short and will actually have a bias for going long.
Funding Rates (pawn): Helps me to understand supply / demand. When shorts are getting expensive then I expect a short squeeze to be around the corner.
Contango / Backwardation (pawn): Not a timing indicator. Is used to determine bullish / bearish bias and can help to identify tops / bottoms / support and resistance. Watch the video series and Google “Ugly Old Goat Backwardation” to learn more.
TD’ Sequential (pawn): “The trend is your friend until it’s about to end” -Tom Demark | Used to identify when a trend is becoming exhausted which can be very helpful to confirm or deny an entry. Ex: if wanting to go long on a green 7/8/9 then would strongly prefer to enter on correction that is expected to follow.
Average Directional Index (pawn): Used to identify when trends are becoming exhausted. When ADX’ reaches resistance / ATH levels then it is likely that the trend is reaching a point of exhaustion
Ichimoku Cloud (pawn): Starting to use traditional settings across the board. Crypto settings seem to make the cloud useless when markets are volatile, whereas the traditional settings seem to line up nicely with the MA’s I use for Consensio.
Price Action (pawn): Helps me understand when markets are overbought / oversold in the short term. In my experience it is very rare for Bitcoin or Ethereum to move more than 10% in 24 hours. Therefore if I am wanting to enter long and the price is + > / = 7% in the past 24 hours then I will be very cautious and usually wait for a pullback / consolidation.
Bollinger Bands (pawn): Very helpful for recognizing when a trading range is coming to an end, which can be very useful for spotting trends that are just starting / about to start. Also like the Bollinger Band % to help illustrate extremes.
Relative Strength Index: Divergences can be very useful for understanding short term price movements and potentially full on reversals. When markets are moving I like to check the RSI on the 1h and 4h charts and pay close attention to divergences as indication that a trend could be exhausting.
Stochastic Oscillator: Very useful in trending markets that have not gone parabolic. Can be helpful in ranging markets as well, but not nearly as much. Can get some very good signals on the 3d chart. If there is a buy / sell signal then I think it is best to wait for %K and %D to cross the boundary lines before considering it significant.
Hierarchy of Indicators
The best traders know which indicators are most important at which times. A trader is like a carpenter and the indicators are akin to his toolbelt. Through experience he or she knows which ones to reach for, exactly how they are used and what adjustments could be required for a specific circumstance.
It is one thing to understand that an MA rolling over is an indication of a trend reversal. It is entirely another to fully believe it and be able to act on it. Next is understanding which indicators can be disregarded at which times and which should always be taken into account.
Above lists my indicators by order of importance. However that is only a default and it will change based on market conditions.
For example: if a hyperwave is present then patterns become more important than Consensio and trendlines become more important than horizontals. If market is parabolic then I find the Stochastic useless and will adjust the settings on the RSI to 30. If no trend is present then the Bollinger Band can go from a pawn to the King.
It would take much too long to go into all of the different variables I can think of and how it can change the hierarchy of indicators. What is important is that you start to develop the feel for it yourself. The only way I know how to do that is through checking all of them on a regular basis, in all different types of markets (bull, bear, flat, parabolic).
Learn -> Practice -> Fail -> Learn -> Practice -> Understand -> Apply -> Internalize -> Believe -> Achieve -> Fail -> Learn
Monthly, Weekly & Daily Processes
Daily
Check daily close every day. If entry or exit was signaled then make sure to get filled within 30 minutes of close. If passing on an entry signal then notate why. Never pass on exit signal.
Update trading ledger to reflect any changes (I will be posting my results in the 2 > 20 Bitcoin Trading Challenge).
Go through the TA Process listed above on a daily basis (I post my analysis in the Bitcoin' Daily Update).
Make sure that you are highly focused during the candle close otherwise the mistakes will compound. I prefer to go to the gym on a daily basis and be disciplined about my diet in order to maintain a high level of focus. I have also committed to a daily hot springs meditation session that has proven extremely valuable over the past year. For anyone that watches Mr. Robot think of Tyrell Wellick chopping wood while confined by himself in the forest. Having a task that is repeatable on a daily basis provides balance, perspective and focus.
I find a consistent sleep schedule to be vital in my performance as a trader. I make sure that I am in bed by a certain time so that I wake up feeling refreshed / energized and ready to trade.
Weekly
On Sunday I will analyze the weekly chart instead of the daily chart.
Trading ledger that gets updated daily is used for weekly PnL statements which get done on Saturday morning instead of preparing for traditional markets to close. I keep an excel spreadsheet for each exchange I trade on and include sections for Date, Entry, USD Inventory, BTC Inventory, Withdrawals, Delta, PnL, Unrealized PnL, In position.
When I first got into crypto I completely disconnected from my friends and family. To ensure the first doesn't happen again I commit to two social activities per week and for the latter I commit to calling my mother every Sunday.
Monthly
Review biggest trades from prior month. Dissect entries, exits and position sizes. Everything should be repeatable / explainable in hindsight. If it isn't that means I didn't stick to the guidelines and that is mistake. I cannot expect to be a perfect trader, however I can expect to learn from my mistakes.
Monthly Best & Worst Dressed List. After reviewing the trades find the best and worst examples. Print out the charts, notate why they made the list and put them in a binder. In the short term, how I trade is exponentially more important than how much money I make or lose. Therefore if the monthly PnL was subpar but very few mistakes were made on the worst dressed trades then I consider that a huge success and will expect the variance to even out in the medium - long run.
Weekly PnL statements is used for monthly PnL statements
-It feels really good to make a lot of money and it can feel very frustrating when results do not meet expectations. This is why I believe that is it vital to focus on the process and improving instead of the results. A few good results could be the byproduct of luck. One good / great process will lead to sustainable results as long as you can remain disciplined / diligent. While some may prefer to be lucky rather than good I strongly prefer to put in the effort that it takes to be good. Furthermore luck seems to be attracted to those who put in the consistent effort. Nevertheless I still track short term results because I have bills to pay. Eventually I would like to only pay attention to annual results.
“So you want to be a carpenter, do you?
Well it takes more than a hammer, boy, you're gonna need blueprints and a will to build, and
Straighten your cap! you look like you've been through a war.
Wipe that grin off your mug, you got a sturdy frame?
Sluggish posture just won't cut it.
You're gonna need schooling, and, and, and take notes!
And god if I catch you yawning again you're gonna regret ever asking for my help,
And dammit you gotta hustle, this is a slacker-free zone
And, where's my pencil? go get your hard-hat,
here's a nickel, go get us a ruler and a saw and a drill and lots of graph paper!” -Aesop Rock

Template for fast setting of GRP 4.0 (20181222) for stocks.Copying is the fastest way to set a chart into your own account. The chart on this page is an example of one from TradingView with Graph Reader Pro 4.0 as of 20181222. You can copy it into your account immediately by clicking on the megaphone (Share) symbol under it, then click on "Make it mine" button.

Simple Way to Read Oversold/Overbought Without RSIThis is how u can tell if a market is oversold (or overbought) by reading price and using our little 14EMA friend
After price has a large push down (or up) like you can see in the yellow circles, it retraces up to the green circles
In example 1, this yellow circle was right on the close of a huge bearish 4h engulfing. Perfect example to see how it is oversold by seeing the large gap between price and the 14 cyan coloured EMA
And the following day we see this happen again in example 2. price pushes fast away from the 14EMA and therefore it needs to breath and retrace a little. No body can continuously sprint, neither can markets! "After big drop, markets must chop"
Whether or not you have RSI on the charts, it is good to know when a market is oversold or overbought because nobody likes entering and seeing the trade go immediately negative, only to see it later where you thought after you closed in a loss
Another cool term for a temporary up trend in an overall down trend is a dead cat bounce! This is a very very short term version considering we are looking at the 15m tf here
~ The trend is your friend and so are retracements ~

Train your eyes to see this market maker's agenda.20181213 14:45 in EURUSD 15 minute chart London session, cc59 counting gave a "+9" and "rsi>70" labels near the green horizontal line (previous day's high) and the horizontal light blue line (cc59 resistance) making the prices between these lines a "resistance zone". Later on at 20181213 19:45 in New York session, the market makers made a wide range stop hunting in both up and down directions forcing many investors to close their positions with losses. In this stop hunting, the price went up and briefly entered the resistance zone defined earlier. Investors with trained eyes would have seen this price shooting as a good opportunity for a short selling with a target of +50 pips downward. If they missed that moment, there was a second chance for that 45 minutes later. The profit taking target of 50 pips would have been reached within 2 hours. The image below was a snap shot from my Android smart phone that rendered EURUSD chart in TradingView with Graph Reader Pro 4.0 invited-only-script.
2.bp.blogspot.com

Make this chart yours. This is the fastest way to setup a binary option trading system at home.
1. Get a big screen smart TV that comes with a web browser and a wifi connection.
2. Login TradingView and come to this page (the one you are reading now).
3. Click on the "Share" button under the chart.
4. In the pop-up window, click on the "Make It Mine" button.
5. A chart just like this one will be yours.
6. Pull up the 1 min chart of EURUSD instead of this 15 min one.
7. Install the Graph Reader Pro 4.0 for TradingView from "Indicators => Invite-Only Scripts".
8. Format the script input options by checking the boxes:
"Draw CC59 Support and Resistance Lines", "Draw SMA(3) and SMA(13) Lines", "Mark Anchor Bars", and "Mark Local Max /Local Min".
9. Watch EURUSD 1 min chart with GRP4 and wait for trading opportunities.
10. Enter PUT or CALL binary option with 5 min expiry.

Using/Delaying McGinley Dynamic seeding to chart parabolicsc.mql5.com
In summary:
McGinley believed moving averages are not supposed to be used as a trading signal, and instead identify the main trend. The formula is designed to go slower when price is trending up, and faster when price is trending down, to mimic how investors react to market movements.
This does not work when an asset starts at a low price then rises astronomically. Unless Gann and friends are right about markets having full cycles, I don't believe bitcoin will be under $100 any time soon. Therefore x bars are ignored to give a usable McGinley Dynamic.
As a trend identification tool, the McGinley Dynamic will trail far behind during forceful uptrends. The utility created here is based on the assumptions that:
Less the extremely parabolic assets, an uptrend will retrace eventually to the McG, and the trader using McG understands that the moving average trails far away to keep a trader secured in position by slowing down for movement upwards
The trading strategy employed is not based solely on moving averages
Like all moving averages, McG will always suffer in terms of giving clear trading signals when the trend is too strong, too weak, too volatile, etc. vs a coincidental/leading indicator
Length chosen should be 60% of your chosen MA to account for lag. In this case, a McG of 15 is equal to a 25 EMA (as TradingView uses EMA as the base MA for McG).
Bars ignored should be before an uptrend, and only ignored up to where the MA is usable for the particular ticker.
Something I have noticed is to be cautious when publishing ideas or sharing charts with indicators that weren't intended for sharing, especially for those who do not have the ability to publish invite-only scripts.
While scripts are not meant to be copied straight off a chart, in rare cases there are ways to grab an indicator for self-use when the author did not intend such. As a first step preventive measure and self-incentive to keep scripts updated, it would be ideal to apply a 'expiration date' using the timenow function to published and nonpublished indicators that are accessible to the public. Although indicators are mostly derivatives of each other (except my stuff, I'm a real snowflake), there are many such cases in which seemingly 1:1 copies pop up, and there is no real way to identify who is in the right, if anyone even is. It is possible (and not uncommon) for indicators to be 'replicated' just by coincidence, so that should not be ruled out either.
Example of McGinley Dynamic outperforming an EMA in the whipsaw department:
Formula as described by Investopedia:
MD = MD-1 + (Index – MD-1) / (N * (Index / MD-1 )^4)
where MD-1 is the previous period's moving average, N is length, and index is price source. Adjustments can be made to the formula to optimize, but at what point do you scrap it and move on to other, more appealing methods? The wide berth that McG gives is not very useful over candlestick analysis for near instant reversal identification.

How to Trade in Traditional MarketsHello friends, thanks you very much for your interesting comments to my previous “Why Do You Like to Lose Money?” post. I’m happy to know that not all of you want to stay with status of “crypto enthusiastic trader” and you also want to use trading opportunities from traditional markets as well. It’s really good because if your REAL target is to make additional or the main income from trading, you MUST do logical things. They are simple: if the market does not give you good trading opportunities, you move to another. If it does, you come back. If your trading strategy does not work, you have to search for a new one and so on.
Also, I understand that for you may be it’s not simple to move in a new direction. You started with crypto from zero knowledge about trading. You followed fake experts, got fake experience and learnt fake knowledge. The crypto world created a lot of fake things around it when there was a great hype for crypto and people could buy, follow and use any low quality “products” and “services”. Of course with this knowledge it’s rather difficult to think about making profit in the traditional markets. You can't expect every pattern to confirm and every indicator to be right - It does not work like that all the time. That bull market where everyone was always right is over now. Maybe there will be a new one, but until then, it's time to trade the right way.
Because of the low quality knowledge and experience which you could get here and there from who knows what noob that thought he knows things because he got 5 charts right, you may have been pushed into a wrong trading workflow. Applying the same logic in the current situation and on real markets, every mistake will cost you money.
So, what should you do?
The 1st step you should start getting the right knowledge. For this you can read actually cool books from REAL legends with great experience and who are trusted by the financial community. I talk about legendary traders, investors who shared their knowledges, experience, trading strategies, tactics and tips in their books and courses.
The 2nd step is, you have to think about your trading goals and create a Trading Plan. What is a trading plan and why you need it, I can write in further posts. Also I made a webinar for this topic. You must have your trading plan where you will write all your steps in the financial markets and tools which help you to reach your goals.
The 3d step you have to find any workable trading strategy and start using it on demo accounts. Of course the best variant is when you design your personal trading strategy, but without good knowledge and experience it will be difficult to do. By using ready trading strategies from professional traders will give you more understanding of how to trade like a PRO.
The 4th step is to create your personal risk and money management strategies. Based on the trading strategies results' you will be able to think about your comfortable risk level and how to manage your demo capital properly. Also, risk and money management strategies must be included in your Trading Plan.
The 5th step - only here when you have everything in your arsenal like: Trading Plan, Trading Strategies tested in demo trading, Risk and Money Management Strategies, Knowledge and some Experience - ONLY AFTER THAT you can start real trading. Not at step 1. I insist!
You can write down these 5 steps, and if you will tell me it will take much time and efforts for starting trading and it’s better to buy super profitable signals from crypto guru and become rich quickly...
I will reply that these 5 steps are not perfect and it’s better to make 10 step in order to start from the beginning level and reach PRO level. These 5 steps are just a possible and logical road map if you decided to make stable profit in the financial markets. You will need several months for this, but opportunities which will be opened to you - they will surprise you.
Also I need to add a very important idea to this post. WHY TRADITIONAL MARKETS ARE SO COOL!
They have good infrastructure which can be used for automated trading. Crypto does not provide good terms for automated trading using the bots outside the raging bull market, but traditional markets are perfect for this.
You have professional trading platforms which can be improved by new indicators and trading robots. You have opportunities to realize in code a great number of trading strategies. The robots can trade for you when you sleep, when you are at your work or when you have a vacation. You will need only to monitor their work time by time. Trading robots allow you to join the traditional financial markets even when you don’t have knowledge, experience, time and wish to improve yourself as a trader or investor. Trading robots can become a real alternative of that 5 steps, but it's better to have them as a complimentary system to your future trading based on real knowledge.
I'll explain why:
This direction of trading is also interesting for those who have experience, knowledge and tools and who trade in profit already. Trading robots allow to diversify your trading, they can be added in any portfolio. Using a combination of manual trading, automated trading with robots will make your trading more stable and probably more profitable in long run.
Automated trading is a really good alternative for manual trading and if you want to learn more details about it, please write in comments. Also I will be able to write with more details why I think any crypto bot just a useless thing at this moment. Please, write in comments will it be interesting for you to know why I think so? Also, if you do not agree with me and you have other point of view, I will be glad to discuss with you in the comments - just don't be rude, there's no need for that.
Thank you very much for your attention!
Investment in TASC01P1903A derivative warrant with SET:TASCO H1.This educational idea studies an hourly graph of SET:TASCO, a big asphalt refining company in Thailand. The aim of this study is to learn spotting a setup for a new downtrend so that a PUT Derivative Warrant referencing this stock could be entered for short-term investments.
With Graph Reader Pro 4.0 for TradingView, many tasks for this study are done automatically. From the left of the chart, CC59 resistance (orange line) and CC59 support (light blue line) are generated by completions of -9 and +9 at 15.50 THB and 15.20 THB respectively. The price goes from between these lines down to below the light blue line to set the first "Min" point. Two bars later, the "MACDSig" label is printed to show that the MACD value is now higher than its own SMA9. This confirms a new uptrend. In addition, a series of positive CC59 counting is started. It is completed with the +9 bar. At this point the new CC59 support line is drawn at 14.90 THB. The price is also now crosses above both original light blue and orange lines. After that a tall bullish "Anchor" bar appears to create an "RSI>70" warning. The highest price of 16.10 THB is marked manually to see whether the price movement could go higher from here. Two bars later, the second "Min" point is printed. A dotted yellow demand line linking both "Min" points is then drawn manually to check for the beginning of a new downtrend.
Four bars later the SMA3 line changes its color to red showing that the MACD value is now decreasing. The price bar also closes below the dotted yellow demand line. At 20181018 10:00, the label "MACD<Sig" is printed to confirm a new downtrend. This is an opportunity to buy TASC01P1903A PUT derivative warrant referencing SET:TASCO at the price 0.54 THB. At 20181024 09:00 (six days later), the price of SET:TASCO closes below the new CC59 support line (14.90 THB) while the price of TASC01P1903A PUT derivative warrant hits its previous high. This is a good exit point at 0.64 THB since the return of this investment is already +18.5%. To get invited to use the Graph Reader Pro 4.0 for TradingView, please contact me in the chat box.
