Learn more about TradingView coinsHave you ever wanted to show your appreciation for an idea but felt that hitting the like button was just not enough?
TradingView coins are a great way to show other users that you appreciate them!
What are TradingView coins?
TradingView coins are the site's internal currency. 1 coin is equal to $0.01 USD
How can you get them?
Refer a friend : When you refer a friend to TradingView, you both will get TradingView coins after they upgrade to one of our paid plans.
Receive donations from other users: TradingView users can give coins for great content, to say thank you, if they're feeling generous, or for any other reason.
Buy Coins: You can buy coins in batches of 500, 1,000, or 5,000. This can be done by opening the user menu and choosing "Coins".
(Your current coin balance, donation history and other coin info is also shown here)
Great! Now that you have your TradingView Coin treasure, how can you use it?
Cheer someone : Cheer is a great way to show your support for users that you like.
The size of your coin sending is fixed on our site with the following values: 100, 200, 350, or 500 coins. These values are equivalent to $1, $2, $3.50, and $5 USD. This feature is available for all users.
Cheer an idea by using the "Comment with a cheer" button to send your message with some TradingView coins
Cheer a user from their profile by selecting "Cheer" in the upper corner of their profile page.
Purchase a paid plan : You can spend TradingView Coins on either our 1 month or 1 year paid plans. For example, 3000 coins is access up to 1 month of our PRO+ plan, one of our most popular options.
Note that if you already have an active plan, you can add a month or a year of the same type with coins. Upgrades for coins are not supported.
TradingView Coin Pro-Tip
TradingView moderators, managers and staff give coins for ideas chosen as Editor's Picks, great scripts, ideas and other exceptional content all the time.
They can be identified by the TradingView logo badge or "Mod" badge next to their name.
Learn more about TradingView coins in our Help Center .
Trading Tools

The Importance Of Back-Testing Part 1When it comes to trading the financial markets (any market), back-testing your strategies is an absolute must. Although past performance does not guarantee future results, back-testing your strategy cannot be skipped or rushed if you wish to be a consistently profitable trader. Back-testing can be done many different ways today. There are many good software’s & trading platforms with available back-testing tools however, I personally prefer to use a spreadsheet as they are fully customizable & require you to fully understand the operation and function of the data you compile and your strategies performance. In my personal experience, I have found that traders who use software’s as opposed to manually back-testing each trade one by one, have a much more difficult time remaining consistently profitable. One of the effective benefits of manually back-testing your strategies is that you will be training your eyes to spot your specific Conditions & Criteria’s for entry along with getting a feel for the characteristics & movements of the market you are trading.
You can manually back-test your strategies by going to your chart and scrolling as far to the left as you would like. Next you will slowly scroll one candle at a time to the right, until you see your setup. Once you see your setup, you should stop and enter the details of the trade into your back-testing tool. After you have entered the details of the trade into your spreadsheet, you should continue scrolling to see the results of the trade. Enter the results of the trade and continue scrolling right until you see your next setup.
Your trading timeframe will determine how far back in time you can go for your back-testing. For example if you are using the 60 min chart as your trading timeframe, you should be able to test several years of trades whereas if you are using the 5 min chart as your trading timeframe, you may only be able to test several months of trades. I mainly trade using the 4hr and 60 min charts therefore I personally start my back-testing process by testing 1 years worth of trades. If I am happy with the results of the 1 years worth of tested trades, then I will typically restart the process of back-testing that strategy- going as far back In time as possible. I like to have 3+ years of back-tested trades before I will begin forward testing the strategy & then ultimately trading the strategy live. If you are unsure about the amount of time that you should back-test for your strategy, you can safely make this decision using the amount of trades instead- For example, I recommend back-testing AT LEAST 100 trades. I personally will not begin forward testing a strategy with any less. If the strategy proves profitable after 100 trades, I like to back-test as many as possible. There is no such thing as to much back-testing.
It is very important that we do not cheat during this process. Do your absolute best to scroll slowly as you proceed to avoid seeing the results of the trade before you have made the decision to enter. We must be honest in our approach to testing a strategy, in order to get the most accurate data & results possible. It is easy to see what happens next by accident & convince ourselves why we would or would not have taken that specific trade anyway. Be sure to follow your detailed conditions & criteria’s for entry as this will eliminate making discretional decisions. The purpose of pre-defined conditions and criteria’s for entry is to minimize the decision making process as much as possible. Please understand that cheating during this process is ultimately skewing the results of the strategy as well as cheating yourself!
Back-testing serves many purposes to a professional trader & takes up a large portion of their work week as we are always looking for ways to improve our existing strategies and/or develop new, more efficient ones. This stage is also crucial to your confidence in your strategy which ultimately leads to being disciplined and following your set guidelines for the strategy you are using. Your confidence and discipline to your strategy will come into play during periods of “Drawdown"
What Is Drawdown?
Drawdown is an extended period of time that a traders account experiences loss or no increase in account balance. In other words, drawdown is a losing streak OR a period of time that the account makes no gain or loss. No matter how good a strategy is, it will eventually experience a losing streak. It is extremely important that we measure the severity of these drawdowns otherwise known as "Max Drawdown". Drawdowns can vary from strategy to strategy however as an example, my strategy typically experiences 1-2 drawdowns per year and the average length of these drawdowns are around 30-40 days long. Back-testing can really help maintain emotional stability & psychological logic during these prolonged periods of drawdown. If you begin to feel doubt while these periods of time are occurring, you may go back to your back-testing results to reassure yourself that it is normal for the strategy to not achieve a profit OR even lose a certain amount of money over the course of however long your results show on average. After we have completed 3 years worth of back-testing or at least 100 trades, you will be able to go back and see periods of time (typically 1-2 months) that the account made no money at all or even lost money.
As an example- the strategy shown below carries an 11% Max Drawdown over the course of 3 years worth of trading, meaning that at some point during 3 years worth of trading, my account may experience a 11% loss from its current value at that time. This period of time is normal and as long as we do not exceed this Max Drawdown by more than 1 or 2%, we should continue trading our strategy without taking a further look to evaluate whether the strategy is outdated and needs adjusting or if we made trading related errors.
looking at the date in the top left (10/4/2018) & Date at bottom right (11/5/2018), we can see that the strategy produced little to no gain over the course of this 32 days. When first starting out as a trader, this can be extremely difficult to deal with. 32 days can feel like a very long time while it is occurring but DO NOT give up on your strategy if it has shown to be profitable throughout your back and forward testing period!! This is where most inexperienced traders begin making mistakes, breaking their rules or change up strategies thinking the one they are using doesn’t work when in fact, this is 100% normal for EVERY strategy. This is where discipline comes into play. If you do not remain disciplined and stick to your strategy/rules during these periods of time, your lack of discipline will lead to inconsistent results & ultimately failure. Lets look at what happened right after this drawdown was finished had you stayed discipline. (See Image Below)
In the following 47 days, the strategy managed to produce nearly a 90% gain! I am not saying these are the same results you will get, the point I am trying to make is to not jump from strategy to strategy or start making irrational decisions because of these periods of time. I have seen to many new traders destroy themselves because of drawdown or throw away an amazing strategy because they were unaware and uninformed about these periods of drawdown or because they chose not to back-test a strategy before using it to trade with live money. It is crucial that you extensively test anything you wish to use in the markets before using it. Take the time to feel those losses as if they were real and they were occurring in real time. Don't take anyone's word or back-testing results as your own, simply put the time in to this process yourself & you will find that your perspective of trading changes dramatically. You will start to treat this as a business and you will be one step closer to consistently profitable trading.
Note: Back-testing a strategy must be done for each market you plan to trade. For example, your strategy may be profitable on EUR/USD however that does not mean it is profitable on any other currency pair or in any market in general. Be sure to back-test the strategy for each market you wish to trade as strategy results may vary widely from market to market.
As a consistently profitable trader for the better half of a decade, the best advice I can give and the one thing I want you to take away from this post is- Always be sure to extensively back-test any trading strategy you plan to use in the markets. Without this step, you are essentially trading blind & will have an extremely hard time with your trading psychology & consistency. The software's out there today have a purpose when used correctly but I highly recommend using a more manual approach. It forces you to understand your strategy while training your eyes to spot your setups.
Some Data Points You May Want To Gather For Strategy Optimization-
I hope this was helpful for you, please leave a comment and let us know what your back-testing process looks like, and how you go about optimizing your trading strategies.

Why Implied Volatility Is A Critical Tool For All TradersTraders and investors use different sets of tools when approaching markets. Some are fundamentalists, pouring through balance sheets, supply and demand data, and other macro and microeconomic information to predict the future prices of assets. Others have a strictly technical approach to markets, following trends and the path of least resistance of prices. Still, others combine the two to look for opportunities where fundamental and technical analysis merge to improve the chances of success.
The past is history; the present is all that matters for traders and investors
Historical volatility is a map of the past price variance for asset prices
Implied volatility is a real-time sentiment indicator
The primary variable determining put and call option prices
The three critical factors implied volatility reveals
Yogi Berra, the hall of fame catcher and armchair philosopher, once said, “The future ain’t what it used to be.” All market participants have the same goal, to increase their nest eggs. Projecting the future is the route to achieve their goal.
Implied volatility is a tool that all market participants need to embrace as it is a real-time indicator of market sentiment.
The past is history; the present is all that matters for traders and investors
History depends on interpretation. When it comes to markets, Napoleon Bonaparte may have said it best, “history is a set of lies agreed upon.” An asset’s price moved higher or lower in the past because of a collection of variables viewed through a prism that leads to a collective conclusion that has broad acceptance but may not be accurate. Taking a risk-based position on an inaccurate conclusion could lead to mistakes and losses.
When we consider buying or selling any asset, all that matters is the present. The current price of any asset is always the correct price because it is the level a seller is willing to accept and a buyer is willing to pay in a transparent environment, the market.
Historical volatility is a map of the past price variance for asset prices
Historical volatility is an objective statistical tool that defines the price variance of the past. Any disclosure document tells us that past performance is no guaranty of future performance. We must view historical volatility precisely the same way, with more than a grain of salt.
Historical volatility is a guide, but remember what Yogi said, “the future ain’t what it used to be!”
We calculate historical volatility by determining the average deviation from the average price over a given period. When it comes to math, the formulas are:
A simple explanation of the complicated formula comes in seven easy steps:
1. Collect the historical prices for the asset
2. Compute the expected price (mean) of the historical prices.
3. Work out the difference between the average price and each price in the series.
4. Square the differences from the previous step.
5. Determine the sum of the squared differences.
6. Divide the differences by the total number of prices (find variance).
7. Compute the square root of the variance computed in the previous step.
Implied volatility is a real-time sentiment indicator
While we can calculate historical volatility from historical data, implied volatility is a different story. Implied volatility is the expected or projected volatility or price variance of an asset over time.
We back into calculating implied volatility using an options pricing model. We can establish an implied volatility reading by entering the option value into the Black-Scholes options pricing formula or other formulas that determine options prices. If we have a put or call options price, we can solve for the implied volatility level. The Black-Scholes formula in mathematical notation is:
The primary variable determining put and call option prices
There are no option prices without implied volatility as it is the critical variable that determines put and call option values. Yogi also said, “You can observe a lot by watching.” The current implied volatility level is the market’s consensus perception of what volatility or price variance will be during the life of the put or call option.
Observing and watching reveals the constant changes in implied volatility levels, which can be highly volatile over time. Option traders call an option’s sensitivity to changes in implied volatility Vega, which measures the change in an option price for a one-point change in implied volatility.
Implied volatility is constantly changing. Yogi had another great saying, “If the world were perfect, it wouldn’t be,” which rings true for implied volatility which can change in the blink of an eye. Option traders pay lots of attention to their Vega risk as the volatility of implied volatility can be…highly volatile! How’s that for a tongue twister?
The three critical factors implied volatility reveals
Implied volatility is a valuable tool for all traders and investors for three significant reasons:
It is a real-time indicator of the market’s perception of the future price range of an asset.
It can change suddenly, and changes often occur before the price of an asset reacts, making implied volatility a leading indicator.
Implied volatility reflects the wisdom of the crowd, and crowds tend to make better decisions than individuals. Moreover, it is reading that reflects the present, not the past, and is a constantly changing measure of consensus forecasts for the future.
As traders and investors, we exist in the present. We attempt to increase our wealth with long and short risk positions that either add or subtract from our nest egg in the future. Implied volatility is a critical measure we should understand, utilize, and always keep in our toolbox. Any project requires the right tools. Implied volatility’s value is that it reflects a snapshot of the current market’s consensus.
Historical volatility depends on “Deja vu” happening “all over again.” Implied volatility is a measure that understands that the “future ain’t what it used to be.”
-----
Register for our Monday Night Call using the link below. You can view this full article (with specific examples) and get early access to future articles for free using the other link below.
Trading advice given in this communication, if any, is based on information taken from trades and statistical services and other sources that we believe are reliable. The author does not guarantee that such information is accurate or complete and it should not be relied upon as such. Trading advice reflects the author’s good faith judgment at a specific time and is subject to change without notice. There is no guarantee that the advice the author provides will result in profitable trades. There is risk of loss in all futures and options trading. Any investment involves substantial risks, including, but not limited to, pricing volatility, inadequate liquidity, and the potential complete loss of principal. This article does not in any way constitute an offer or solicitation of an offer to buy or sell any investment, security, or commodity discussed herein, or any security in any jurisdiction in which such an offer would be unlawful under the securities laws of such jurisdiction.

Trading Basics | Your Main Trading Time Frame ⏳
Hey traders,
You frequently ask me what is the most important time frame to analyze and follow.
And even though I must admit that multiple time frames must be taken into consideration for successful trading like weekly/daily/4h/1h. Among them, there is the one that is universally considered to be principal. That is a daily time frame.
There are a lot of reasons why so many traders rely on a daily time frame:
1️⃣ - Daily time frame shows a global market trend at the same time reflecting a mid-term and short-term perspective letting the trader catch trend following moves and spot early reversal signs.
2️⃣ - Covering multiple perspectives, daily time frame is the foundation of the majority of the trading strategies being the main source of key levels & pattern analysis.
3️⃣ - Daily time filters out news events that happened during the trading day. It shows the composite reaction of the market participants to all the data posted in the economic calendar.
4️⃣ - Daily time frame reflects all trading sessions. Within one single candle, we see the outcome of the Asian, London, and New York Sessions.
5️⃣ - Daily candle filters out all the noise from lower time frames & intraday price fluctuations and sudden spikes & rejections.
6️⃣ - Covering all the trading sessions, daily time frame mirrors the activities of big players like hedge funds and banks. Showing us the flow & direction of big money.
⚠️Being so important for analysis, do not neglect other time frames.
The most accurate trading decision can be made only relying on a combination of intraday and daily time frames.
What is your favorite time frame to trade?
❤️Please, support this idea with like and comment!❤️

Engulfing Candle Trading Strategy (How To Spot & Trade Them)Engulfing Candles, due to their distinct characteristics, provide potential reversal signals for Forex traders
Here’s how to spot and trade them...
Bullish Engulfing Candle: (Chart example)
1) Down Trend
2) Bearish Candle
3) Open At Or Below The Previous Close
4) Bullish Candle
5) Close At Or Above The Previous Open
6) Close Preferably Near The High
Aggressive Trader- Market Order With Stop Below Engulfing Candle and Conservative Trader- Set Buy Order When PA hits it Above Engulfing Wick With Stop Below Engulfing Candle. Yes, would be revered for a Bearish Engulfing Candle setup.
Bearish Engulfing Candles:
1) Up Trend
2) Bullish Candle
3) Open At Or Above The Previous Close
4) Bearish Candle
5) Close At Or Below The Previous Open
6) Close Preferably Near The Low

Analyst and Trader. What are the differences?
The main difference between an Analyst and a Trader is in their main goals.
For an analyst, the main goal is to determine the future price and write articles.
Most analysts give a double trend direction in their forecasts, as they worry about their incorrect forecast, and hedge in case of their mistake.
For a trader, the main goal is to MAKE a PROFIT when working in the market. At the same time, the direction of the trend is a secondary goal, since you can also make a profit by scalping when the trend does not matter much. Each trader has his approach to trading and his trading strategy. One trader opens a long position to earn money on the growth of quotations, but at the same time, another trader opens a short position on the same instrument to earn money when the price drops.
PROFIT is the main priority for the trader.
The analyst can show alternative options for the development of events, leaving the trader to make a responsible decision about actions in one or another option. At the same time, the Analyst does not risk anything - neither his money nor his reputation, since TWO OPPOSITE scenarios insure him from making a mistake.
As a rule, 65% of analysts do not trade themselves, but only write analytical articles and make forecasts.
A few facts about the analyst and trader:
Analyst:
- collects information and analyzes the market situation
- writes analytical articles
- makes forecasts (usually in two directions, for safety)
- probably trades/invests by himself according to his forecasts
Trader:
- determines the direction for a potential transaction
- performs risk calculation and installation of a protective order (stop loss)
- performs trading operations on the market to make a profit
- manages and accompanies the position from the beginning to the end
And who do you think you are? An analyst or a trader?
❤️ Please, support our work with like & comment! ❤️

Fibonacci Extension Tool (How To Use)How To Use The Fibonacci Extension Tool: Bearish example (like Chart)
A) Highest Top Point
B) Reversal Bottom Point
C) 2nd Highest Top Point (Note) Can NOT be higher then A Point.
D) Will be 3 points or targets, 1st target at 50% extension, 2nd target at 100% extension & 3rd target at 150% extension.
The rules for take profit orders are very individual, but most traders use it as follows:
A 50, 61.8 or 78.6 retracement will often go to the 161 Fibonacci extension after breaking through the 0%-level. A 38.2 retracement will often come to a halt at the 138 Fibonacci extension. Fibonacci extensions to the price moves. As you can see, the extensions provided great places for take profit orders.
Conclusion: Fibonaccis are multi-functional
This demonstrated how to use Fibonaccis efficiently in trading. Don’t make the mistake of idealizing Fibonacci s and believing that they are superior over other tools and methods. Fibonacci is a great tool to have and can be used very effectively as another confirmation method. Whether you are a trend following or a support and resistance trader, or just looking for ideas how to place your take profit orders, Fibonaccis are a great addition to your arsenal.

FX Compounding Calculator (Do You Want To Be A Millionaire?) Only one way to grow a small account into a large account. That is by treating Forex trading as a marathon race not a sprint race.
Do you have 2 to 5 years?
You can use the compounding calculator to calculate profits. This allows you to understand better, how your trading account will grow over time.
One of the most interesting facts about compounding is, that even a moderate monthly gain turns your initial capital into a serious amount of money over time. A Forex compounding calculator is useful to simulate how compounding the initial equity and the profitable trades, with a set gain percentage, can make a trading account grow over time.
It works by simulating the compounding and the reinvesting of the same chosen gain percentage of the account's total equity. With this calculator traders can input the settings in order to accurately calculate the compounding results of a set of winning trades over a period of time.
The use of this calculator can demonstrate traders how powerful gains compounding can be, and, that even a moderate gain percentage of 2% (for example) per trade, can turn an account’s initial capital into a substantial amount of capital over time.
You will be surprised how powerful compounding can be.
My goal is profit at least 1% per trade and/or 1% per session/day. Look at chart: You Can Do It- by letting your account grow with compounding profits
< this is the holy grail of building your account.
Albert Einstein said,"“Compound interest is the eighth wonder of the world. He who understands it, earns it ... he who doesn't ... pays it.”

Top 20 Reasons To Trade Daily ChartsTrading on Higher charts can improve your trading, if you can mange patience and risk management.

How To: Build Your Own Private Signals Service Using TradingViewMany traders - especially beginners - rely on others to tell them what stocks to trade and when to place their entries and their exits.
What I want to show you is not so much how to trade or what strategy to use, but once you have found a strategy that YOU like, how to set up this strategy in TradingView and get automated alerts when a stock meets your criteria.
This video covers:
How to setup your TradingView Chart
How to add built-in or custom TradingView Indicators to your chart
How to customise those indicators
How to find stocks that match your criteria using the TradingView Screener
How to save your set up
How to set up a TradingView Alert
How to get alerts sent to your phone or email or screen
How to check TradingView News to see what catalyst might have caused the alert
How to use TradingView Text Notes
Hope the video was useful.

Candlestick Chart Part 2 : ReversalsHello everyone, as we all know the market action discounts everything :)
_________________________________Make sure to Like and Follow if you like the idea_________________________________
Today's video will be about the Candlestick Chart : Reversal Patterns.
So lets start by talking about the different types of Patterns :
Bullish Reversal Patterns
Bearish Reversal Patterns
And they are divided into 3 groups :
Weak Patterns
Reliable Patterns
Strong Patterns
We Start with the Weak Reversals :
1) Dragonfly Pattern :
A dragonfly doji candlestick is a candlestick pattern with the open, close, and high prices of an asset at the same level. A dragonfly doji pattern does not appear constantly. It is used as a technical indicator that signals a potential reversal of the asset’s price.
2) Hammer & Hanging Man Patterns :
The Hammer is a bullish reversal pattern that forms during a downtrend. It is named because the market is hammering out a bottom.
When the price is falling, hammers signal that the bottom is near and the price will start rising again.
The long lower shadow indicates that sellers pushed prices lower, but buyers were able to overcome this selling pressure and closed near the open.
The Hanging Man is a bearish reversal pattern that can also mark a top or strong resistance level.
When the price is rising, the formation of a Hanging Man indicates that sellers are beginning to outnumber buyers.
The long lower shadow shows that sellers pushed prices lower during the session.
Buyers were able to push the price back up some but only near the open.
3) Inverted Hammer & Shooting Star Patterns :
The Inverted Hammer occurs when the price has been falling suggests the possibility of a reversal. Its long upper shadow shows that buyers tried to bid the price higher.
However, sellers saw what the buyers were doing, said "No!" and attempted to push the price back down.
The Shooting Star is a bearish reversal pattern that looks identical to the inverted hammer but occurs when the price has been rising.
Its shape indicates that the price opened at its low, rallied, but pulled back to the bottom.
4) Dark Cloud Pattern :
A 2-candle pattern. The first candle is bullish and has a long body. The second candlestick should open significantly above the first one’s closing level and close below 50% of the first candlestick’s body. The sell signal is moderately strong.
5) Piercing Pattern :
A 2-candle pattern. The first candlestick is long and bearish. The second candlestick opens with a gap down, below the closing level of the first one. It’s a big bullish candlestick, which closes above the 50% of the first candle’s body. Both bodies should be long enough.
6) Upside Gap Three Method :
The upside gap three methods candlestick pattern is a bearish continuation pattern that only occurs during an uptrend. It consists of three candles. The first two candles are long and white in the direction of the prevailing trend. The second black candle creates an upside gap. The third candle fills the gap between the first and the second candle.
7) Downside Gap Three Method :
The downside gap three methods candlestick pattern appears during a downtrend and consists of three candles. The first two candles have a gap down between them while the third candle covers the gap between the first two. The gap between the first two candles simply gets filled.
8) Bearish Harami Pattern :
A 2-candle pattern. The body of the second candle is completely contained within the body of the first one and has the opposite color.
9) Bullish Herami Pattern :
A 2-candle pattern. The body of the second candle is completely contained within the body of the first one and has the opposite color.
Now Lets Talk about the Reliable Reversals :
1) Bullish Engulfing Pattern :
A 2-candle pattern appears at the end of the downtrend. The first candlestick is bearish. The second candle should open below the low of the first candlestick low and close above its high.
2) Bearish Engulfing Pattern :
A 2-candle pattern. The first candlestick is bullish. The second candlestick is bearish and should open above the first candlestick’s high and close below its low.
3) Tower Top Pattern :
The tower top is a reversal pattern that occurs at high price levels. Typically one or more long bullish candlesticks are followed by a few smaller real body candlesticks and then the pattern is completed with one or more large bearish candlesticks.
4) Tower Bottom Pattern :
The tower bottom is a reversal pattern that occurs at low price levels. There is one or more long bearish candlesticks followed by a few smaller body candlesticks and then concluded with one or more large bullish candlesticks.
5) Bullish Abandoned Baby Pattern :
The bullish abandoned baby is a pattern that appears at the end of a downtrend and signals reversal to an uptrend. Simply put, it signals an end of the selling pressure of the bears and return of the bulls in the market.
This pattern consists of three candlesticks: the first candle has a black (or red) big body, the second is a small and bearish candle – or a Doji, and the third is white (or green) candle.
6) Bearish Abandoned Baby Pattern :
The bearish abandoned baby is a reversal pattern that forms during an uptrend. It is characterized by three candles, where the first candle is long bodied and white/green.
The second candle is a Doji that gaps above the close of the first bar in the series. The third candle opens below the close of the second bar and is long bodied and black/red.
7) Dumpling Top Pattern :
A dumpling top occurs when small real body candlesticks slowly rise and then move in a neutral to downward direction. The dumpling top pattern is complete when there is a bearish candlestick that gaps down from the other candlesticks.
8) Fry Pan Bottom Pattern :
The opposite of the dumpling top is the fry pan bottom pattern. The fry pan bottom occurs when small real body candlesticks slowly move downward and then move in a neutral to upward direction. The fry pan bottom pattern is complete when a bullish candlestick gaps up from the rest of the candlesticks.
9) Bullish Belt Hold Pattern :
A bullish belt hold shows up in downtrends. The pattern can be recognized by one long, full-bodied candlestick that is bullish and opens at a new recent low. The bullish belt hold candle is expected to have a flat or nearly flat bottom. The top has a small shadow, relative to the length of the body.
10) Bearish Belt Hold Pattern :
The bearish belt hold is the complete opposite and it comes up in uptrends. To detect it, look for a long full-bodied, bearish candlestick that stands out at the top of an uptrend because it will get to a new recent high and it should be noticeably longer than the other candles.
11) Tweezer Top Pattern :
The Tweezer Top pattern is a bearish reversal candlestick pattern that is formed at the end of an uptrend.
It consists of two candlesticks, the first one being bullish and the second one being bearish candlestick.
Both the tweezer candlestick make almost or the same high.
12) Tweezers Bottom Pattern :
The Tweezer Bottom candlestick pattern is a bullish reversal candlestick pattern that is formed at the end of the downtrend.
It consists of two candlesticks, the first one being bearish and the second one being bullish candlestick.
Both the candlesticks make almost or the same low.
And Last but not least The Strong Reversal Patterns :
1) Three White Soldiers Pattern :
A 3-candle pattern. There’s a series of 3 bullish candles with long bodies. Each candle should open within the previous body, better above its middle. Each candle closes at a new high, near its maximum. The reliability of this pattern is very high, but still, a confirmation in the form of a white candlestick with a higher close or a gap-up is suggested.
2) Three Black Crows Pattern :
A 3-candlestick pattern. There’s a series of 3 bearish candles with long bodies. Each candle opens within the body of the previous one, better below its middle. Each candle closes at a new low, near its minimum. The reliability of this pattern is very high, but still, a confirmation in the form of a bearish candlestick with a lower close or a gap-down is suggested.
3) Morning Star Pattern :
A 3-candle pattern. After a long bearish candle, there’s a bearish gap down. The bears are in control, but they don’t achieve much. The second candle is quite small and its color is not important, although it’s better if it’s bullish. The third bullish candle opens with a gap up and fills the previous bearish gap. This candle is often longer than the first one.
4) Evening Star Pattern :
A 3-candle pattern. After a long bullish candlestick, there’s a bullish gap up. The bulls are in control, but they don’t achieve much. The second candlestick is quite small and its color is not important. The third bearish candle opens with a gap down and fills the previous bullish gap. This candle is often longer than the first one.
5) Bullish Three Line Strike Pattern :
A bullish three-line strike is made up of four candles. Of these, the first three are bullish, while the last is bearish. It is made up of three strong bullish candles that progressively end higher followed by a final strike candle. The strike candlestick is bearish and begins at or higher than the third candle but closes at least lower than the open of the first candle.
6) Bearish Three Line Strike Pattern :
A bearish three-line strike is a four candle continuation pattern that comes up in a bearish trend. The first three candles are bearish, while the last candle is positive and ends above the highest close of the previous three candles.
I Do wanna mention General Reversal Patterns :
Three Mountains is the same as Triple Top Pattern
Three Rivers is the same as Inverted Triple Top Pattern
Buddha Top is the same as Head and Shoulders Pattern
Inverted Buddha is the Same as Inverted Head and Shoulders Pattern
I hope that I was able to help you understand Reversal Patterns in Candlestick Charts better and if you have any more questions don't hesitate to ask.
Hit that like if you found this helpful and check out my other video about the Moving Average, Stochastic oscillator, The Dow Jones Theory, How To Trade Breakouts, The RSI , The MACD , The Bollinger Bands , The Different Types Of Trading Strategies, Candlestick Charts Part 1 links will be bellow

Without this, you will not become a profitable trader
Yes, this is risk management.
Without proper risk management, your trading strategy based on levels, indicators, patterns, etc.will not make any sense.
Any trading strategy should be supported by strict risk management, where the maximum allowable losses per transaction and the risk ratio are observed:the profit is always more than 1/2.
You don't have to be right in every trade. It's just that your profit in successful transactions should be greater than the losses in unprofitable transactions. This correct use of risk management will lead you to success.
____________
The example shows one of the real scenarios of any trading system where the rules of risk management are observed:
Deposit of 10,000$
The risk per transaction is -1% (or -100$)
Total trades:
4 profitable trades = +14%
10 losing trades = -10%
Total: +4% (or + 400$)
Even though only 30% of the total number of profitable transactions, we still have a profitable result.
Learn risk management and become a consistently profitable trader.
❤️ Please, support our work with like & comment! ❤️

How To Use Sparks To Kickstart Your ResearchThis video was created by our team to introduce you to the new Sparks tool. Sparks are curated lists to help kickstart your research process. You can find lists of symbols related to specific topics like outer space, alt coins, and a lot more.
Markets are sometimes driven by themes, trends, and narratives. Within those themes and trends are lists of symbols that are working to change something or build a better future. With the right research tools, investors and traders can find opportunities and capture enormous growth. But it all starts with a diligent research process and Sparks were created to help all investors and traders get started. That's key, getting started.
All it takes is a spark to light a fire, to find the next best investment or trade.
For example, here are some Sparks that may interest you:
1. Self-Driving Car Companies www.tradingview.com
2. Environmentally Friendly Stocks
3. Proof of Work Cryptocurrencies
4. Proof of Stake Cryptocurrencies
5. WallStreetBets Stocks
And these are only a few examples.
Our team is looking build even more Sparks in the future. Our goal is to help all investors and traders learn more about markets. If you have any questions or comments, please write them below. You can also request specific Sparks in the comments below.
Thanks for watching the video and following along!
- Team TradingView

Three Types of Drawdown | ForexBeeThere are three types of drawdown in trading
Absolute drawdown
Relative drawdown
Maximum drawdown

How To Share Your Watchlists (Video Walkthrough)We know how important your Watchlist is.
Your Watchlist is where you organize all of your favorite symbols, follow them, and plan ahead. It's also where you track your investments and trade ideas.
Our new Advanced View tool makes it possible to share your Watchlists. We believe this is an important next step in Watchlist technology. You can now share your favorite Watchlists with friends, family, and across the Internet either on your blog or social media profile. You can collaborate with groups to make a perfect watchlist, sharing the link and making edits as needed.
Create, share, and learn. Get feedback from others and do the research before you make the trade. Our new Watchlist tools can help everyone share and collaborate around markets.
Here are links to the two Watchlists we talked about in this video. You can copy this Watchlists, edit them, and add them to your profile:
1. Up-And-Coming Cryptocurrencies
2. Space Stocks
The first step to getting started is opening your Watchlist, then clicking the three circles at the top right ••• and selecting Advanced View. From there, you can toggle your Watchlist to be shareable, copying the link and sharing it as needed. You will also see a symbol distribution showing the breakdown of the Watchlist you're looking at. We explain all of this in the video! Make sure you watch it.
Please let us know if you have any questions, comments or feedback. You can share them in the comments below.
Thank you for watching,
Team TradingView

Daily Primer: Break your limits 💥In todays daily primer we talk about limitations and cause and effect. This short 5 minute video will give you the necessary guidance as to what you need to focus on to achieve the success you seek in the markets.
Success in trading, just like in any other business, is a
cause and effect relationship:
Poor or average causes = poor or average results
good causes = good results
excellent causes = excellent results
If you want to achieve success, do the work!
(metal: have patience, discipline, resilience)
(work ethic: prepare your charts, know the news, prepare your plan)

Forex Correlations ( Need To Know )Noted chart only has a few highly traded pairs and their either highly correlated negative or positive pairs on daily charts.
If you trade more then one pair at a time, you should know which pairs either mostly go same direction and or go opposite direction.
You might not want to do two trades that have a positive correlation or negative correlation for diversity and so you do not lose two trades at same time.
There are websites which have further information on Forex correlation- you should check out.

TRADING BASICS | What is a Pip? 📚
📏Pip is a measurement of the price change in a currency pair trading on the forex market. In most cases, pip is the equivalent to 1/100th of 1%.
That rule is applicable to all the currency pairs quoted to the 4th decimal place like EURUSD.
➡️Current EURUSD price is 1.1696
6 is the 4th decimal place representing a pip.
If the pair moves from 1.1696 to 1.1697, that 0.0001 USD rise in value is ONE PIP.
❌That rule is not applicable, for example, to USDJPY which is only quoted to 2 decimal places.
➡️Current USDJPY price is 109.62
2 is the 2nd decimal place representing a pip.
If the pair moves from 109.62 to 109.63, that 0.01 JPY rise in value is ONE PIP.
🦉The word pip stands for "price interest point" or "percentage in point".
Even though a pip might appear as an extremely small unit of measurement, in leverage trading even the one pip price change of the instrument may lead to a sufficient gain or loss.
➗How to calculate the value of a pip?
Each and every currency has its own relative value.
In the following example, I will show you how to calculate the value of a pip for a particular currency pair.
USD/CAD = 1.2753
Reading that as 1 USD to 1.2753 CAD or 1 USD / 1.2753 CAD
1 Pip =
* 1 USD = 0.00007841 per unit traded.
Following this example, if we trade 10.000 units of USD/CAD, then a one pip change to the exchange rate would be approximately 0.78 USD change in the position value.
Alternatively, pip value can be calculated with various calculators & apps.
I hope that with these examples and my explanation you will understand the concept of a pip easily.
Let me know what do you want to learn in the next posts!
❤️Please, support this idea with a like!❤️

🤫 You don't need much to succeed in tradingAll you need is...
> Good habits, both mental and technical
> (relentless) hard work
> Consistency in process
> 100% focus when trading

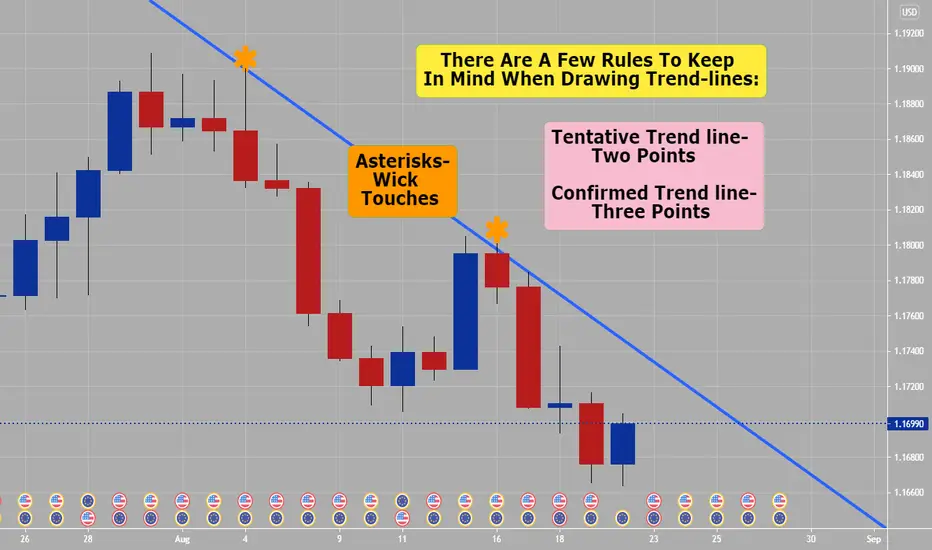
Trend lines (How To Draw & Use)There are a few basic rules to bear in mind when drawing trend lines:
1. Tentative trend line - A diagonal line market bounces off of twice. This trend line is indicative of a potential trend, but is not confirmed & actionable yet.
This is a tentative trend line; two points touch the line. It suggests the possibility of a trend in the making, though conventional analysis will not regarding the trend as established until there are three points on the line.
2. Confirmed trend line - The market has bounced off this trend line three times. Conventional analysis regards this as a sign that the trend line is real, and that the market will react around it.
It is easiest to trade from a trend when its highs or lows trend closely to a recognizable diagonal line, since this line may be used to predict future highs or lows. Opinions vary on whether trend lines should be drawn from the highs and lows of candles or from body of the candle, open & close prices; successful traders can be found employing either approach.
In an up trend, trend lines touched three times, this validates the trend line. Those who wish to trade with the trend may have looked for opportunities to buy based on validated trend. Price pulled back to the trend line that was previously confirmed. Traders can do a trend trade & may be a buying opportunity.
Support and Resistance
The price action trader pays particular attention to pivotal price levels, often “drawing” these lines horizontally as Support and Resistance levels. The theory behind employing these lines is that the market has a sort of memory: price behaves with respect to certain levels that have previously been significant
turning points in the historical narrative of the price’s action, and other market participants are likely
Risk management lessonI mentioned it on another day already, but this topic is very important so I decided to share it again to reach as much as possible. Hope it will help some!
The last weeks it happend again, I saw some traders with less knowledge (young and old) who crashed their accounts very hard. They lost a lot of money and for some it was very dreadful!
It is hard to watch this people how they burn money and bring even his own family in financial danger. That´s why I decided to share one important chapter from my book here to you.
May be some will find very helpful, or some will remember this rules again.
I will keep it a bit shorter here as in my book, but the main points are still mentioned!
I can´t say it often enough, keep the important rules in trading. Trading is not the way to get rich quick, it is a serious and hard business! It take a lot of time to learn, it requires a lot of patience and it will happen a lot of failures.
This failures are even more important than your success! Success will not open up how it will not work, failures will.
Let´s talk about risk management!
For each investment you have to consider you take for each trade the risk to lose money, that´s why it is mandatory to handle each investment with a good risk/reward distribution.
You have to keep in mind, the determined risk/reward is only theoretically and can result complete different. But with knowledge you can dedicate a good entry for your trades to keep your risk as low as possible.
Determine important support and resistance levels and think about all situations what could happen and what will you do if you are going into the red or into the green? Which levels are the best entry and exit?
This all will help you to determine your riks/reward ratio.
What is the Risk/Reward Ratio?
Successful day traders are generally aware of both, the potential risk and potential reward before entering a trade.
The goal of a day trader is to place trades where the potential reward outweighs the potential risk.
These trades would be considered to have a good risk/reward ratio.
A risk/reward ratio is simply the amount of money you plan to risk, compared to the amount of money you believe you can gain.
For example, if you think a potential trade may result in either a $400 profit or $100 loss, the trade would have a risk/reward ratio of 1:4, making it a favorable setup. Contrarily, if you risk $100 to make $100, the trade has a risk/reward ratio of 1:1, giving you the same type of unfavorable odds that you can find in a casino.
Which ratio should you desire?
Like described above, finding trades with high risk/reward ratios (1:2 or higher), will help you maintain higher average profits and lower average losses, making your trading strategy more sustainable.
The common suggestion between traders is a distribution of minimum 1:2 ratio. In reality there are often even better ratios available, if you do your technical chart analysis.
But what should you do if you have to cut losses?
We have to place our stop loss right below our support or other important levels we determined before.
The purpose is to cut losses before they grow too large. Stopping out of a losing trade can be one of the hardest things for traders to do consistently. However, failing to take stops can result in margin calls, unnecessarily large losses, and ultimately account blowouts.
How big should I enter a position?
To lower your risk I recommend to think about your size to enter a position.
Overall you shouldn´t risk money you need, only deposit money in your broker you can afford.
Entering small can be the smartest way to safe your account.
I suggest that because of four reasons, the first reason is, you don´t risk to much of your funds and your stop loss should be tight anyway.
The second reason is, you can average down if the price is going in the other direction, but consider this option only if you are sure what you are doing.
The third reason is, you can buy the dips/pullbacks if the trend is strong and still heading in your desired direction.
In addition, the fourth reason is, your emotional control is stronger if the price movement is heading in the wrong direction.
That brings me to another topic.
Should you use leverage?
Yes I know, big leverage will give you big gains...but as a beginner you will not have the experience to know which trade has a very big potential or not.
Even experienced traders use only a small amount to enter a position and not the whole fund.
If you use leverage the losses can be much higher and the problem with that is, if you lose money, your leverage will also decrease significantly and the losses are harder to recover after each loss.
So the answer of the question, if you should use leverage:
For beginners we can easily answer: Take your hands of a big leverage!
You can so hardly blow up yourself with that tool, it is ridiculous. Your way back into the profit zone will probably take years.
But you have to save yourself and after a period of time, a period of taking profits and cutting losses you will gain knowledge until you feel much more comfortable on the market and you understand how trading really works, then you can consider to use leverage.
Conclusion:
As I said, I want to share only some big points about this topic, because I think many new investors don´t understand how important that topic is!
Safe yourself and have fun in trading and learning!
Sincerely,
TradeandGrow
Trade safe!

SETTING UP YOUR CHART ON TRADING VIEW | BEGINNER'S GUIDE 👨🏫📈
Prepare your chart for price action trading.
Learn to make your chart clean and naked.
Make your candles bright & vivid.
Take away the distracting elements.
❤️Please, support this idea with a like and comment!❤️

Technical Analysis: Technical Indicators (Do You Need Them?)Charts always have a story to tell. However, from time to time those charts may be speaking a language you do not understand and you may need some help from an interpreter. Technical indicators are interpreters of Forex market. *Some traders trade Naked Charts, too each their own!!!
Technical indicators are based on mathematical equations that produce a value that is then plotted on your chart. For example, a moving average calculates the average price of a currency pair in the past and plots a point on your chart.
Technical indicators are divided into the following three categories:
Trending Indicators:Trending indicators, as their name suggests, identify and follow the trend of a currency pair.
Moving Average(s)- Moving averages are the most basic trending indicator.
Bollinger Bands- Shows what direction a currency pair is going but also how volatile the price movement of the currency pair is.
Oscillating Indicators:Oscillating indicators, as their name suggests, are indicators that move back and forth as currency pairs rise and fall.
CCI- show you how bullish or bearish traders are toward a currency pair and how dramatic those sentiments are
MACD- show you when trading momentum changes from being bullish to bearish and from being bearish to bullish.
Slow Stochastic- show you when investor sentiment changes from being bullish to bearish and from being bearish to bullish.
RSI-is a momentum indicator used in technical analysis that measures the magnitude of recent price changes.
Volume Indicators: Since currencies are traded on the inter-bank market and not on a central exchange, volume data for currency transactions is not available. Without volume data, you cannot construct volume indicators. Therefore, we do not use volume indicators in Forex trading.
