Reverso [Flexi+]Reverso – Moving Average Touch Statistics Tracker
Reverso is a premium technical analysis tool that tracks and visualizes how price interacts with a selected Moving Average (EMA/SMA).
Providing detailed statistics about price behavior before, during, and after each Moving Average touch event.
This script is suitable for both trend-following and mean-reversion traders who want to study price reaction with respect to a Moving Average, understand market tendencies, and refine entry/exit strategies based on price-memory dynamics.
Features and Functionality
Supported MAs: EMA / SMA any length
Timeframe Support: any Timeframe >= to the current chart Timeframe
Touch Detection: Triggered when the price range (high to low) crosses or touches the selected MA
Automatic Data Tracking
Tables for Quick Visual Summary
Visual Overlay: Optional Moving Average line plotted on chart
History: User selectable up to 500 touches
Automatic Data Tracking:
Number of MA touches
Time intervals between touches
Price distance from last touch
Maximum price deviation (above/below MA) between touches
Time spent above/below MA
Tables for Quick Visual Summary:
Info Table: Live details about last and first touches, distance from touch, bars above/below, peak movements since last touch
Stats Table: Averages and extreme values for price behavior patterns across recent history
Core Metrics Tracked
Last Touch Price: The last price level where price touched the MA
Distance from Last Touch: Current % change from the last touch price
Time Between Touches: Average and maximum intervals (in bars or time) between touch events
Max Distance Above/Below: Peak movement above/below MA between touches
Bars Above/Below: How long price stayed above/below the MA since last touch
Peak This Cycle: Max deviation above/below in current cycle since last touch
How It Works
Reverso monitors each bar to check if price intersects the selected MA.
When a new touch occurs, it records the touch price and time, and resets the tracking cycle.
From that point forward, it tracks how far and how long price drifts above or below the MA.
This process repeats with each new touch, building a detailed profile of how price behaves around the moving average.
The result is a visual and statistical framework for understanding price memory, market rhythm, and mean-reversion opportunities.
Customization Options
Moving Average Type: Simple or Exponential
MA Length: Any
Show MA Line: Toggle the MA plot on the chart
Show Info Table: Enable/disable the current-touch summary
Show Statistics Table: Show aggregate data over the history
Table Positioning: Customizable placement for both tables
MA Color: Select custom color for MA plot
Max History: Number of touches used for the Statistic computation
Intended Use Cases
Identify reversal or continuation setups near MAs
Validate strategies relying on mean reversion
Backtest the consistency of price respect to MAs
Detect periods of volatility clustering around MAs
Notes and Disclaimers
This script does not repaint: calculations are made on confirmed bars.
This indicator is educational in nature and should be used alongside other forms of analysis.
Time durations in the tables are approximated using bar timing and may vary across markets/timeframes.
Indicators and strategies

HeikinAshiCorev1Library "HeikinAshiCorev1"
haOpen()
haClose()
haHigh(haOpenVal, haCloseVal)
Parameters:
haOpenVal (float)
haCloseVal (float)
haLow(haOpenVal, haCloseVal)
Parameters:
haOpenVal (float)
haCloseVal (float)
isGreen(haOpenVal, haCloseVal)
Parameters:
haOpenVal (float)
haCloseVal (float)
isRed(haOpenVal, haCloseVal)
Parameters:
haOpenVal (float)
haCloseVal (float)
bodySize(haOpenVal, haCloseVal)
Parameters:
haOpenVal (float)
haCloseVal (float)
upperWick(haHighVal, haOpenVal, haCloseVal)
Parameters:
haHighVal (float)
haOpenVal (float)
haCloseVal (float)
lowerWick(haLowVal, haOpenVal, haCloseVal)
Parameters:
haLowVal (float)
haOpenVal (float)
haCloseVal (float)
isDoji(haOpenVal, haCloseVal, haHighVal, haLowVal)
Parameters:
haOpenVal (float)
haCloseVal (float)
haHighVal (float)
haLowVal (float)

ReversoReverso – Moving Average Touch Statistics Tracker
Reverso indicator is a technical analysis tool that tracks and visualizes how price interacts with a selected Exponential Moving Average (EMA). It provides detailed statistics about price behavior before, during, and after each EMA touch event.
This script is suitable for both trend-following and mean-reversion traders who want to study EMA reactions, understand market tendencies, and refine entry/exit strategies based on price-memory dynamics.
Features and Functionality
Supported MAs: EMA 9, 20, or 50
Timeframe Support: Uses the chart’s timeframe
Touch Detection: Triggered when the price range (high to low) crosses or touches the EMA
Automatic Data Tracking
Tables for Quick Visual Summary
Visual Overlay: Optional EMA line plotted on chart
Timeframe Support: Uses the chart’s timeframe
Capped history: Most recent 50 touches
Automatic Data Tracking:
Number of EMA touches
Time intervals between touches
Price distance from last touch
Maximum price deviation (above/below EMA) between touches
Time spent above/below EMA
Tables for Quick Visual Summary:
Info Table: Live details about last and first touches, distance from touch, bars above/below, peak movements since last touch
Stats Table: Averages and extreme values for price behavior patterns across recent history
Core Metrics Tracked
Last Touch Price: The last price level where price touched the EMA
Distance from Last Touch: Current % change from the last touch price
Time Between Touches: Average and maximum intervals (in bars or time) between touch events
Max Distance Above/Below: Peak movement above/below EMA between touches
Bars Above/Below: How long price stayed above/below the EMA since last touch
Peak This Cycle: Max deviation above/below in current cycle since last touch
How It Works
Reverso monitors each bar to check if price intersects the selected EMA.
When a new touch occurs, it records the touch price and time, and resets the tracking cycle.
From that point forward, it tracks how far and how long price drifts above or below the EMA.
This process repeats with each new touch, building a detailed profile of how price behaves around the moving average.
The result is a visual and statistical framework for understanding price memory, market rhythm, and mean-reversion opportunities.
Customization Options
EMA Length: Choose from EMA 9, 20, or 50
Show MA Line: Toggle the EMA plot on the chart
Show Info Table: Enable/disable the current-touch summary
Show Statistics Table: Show aggregate data over the history
Table Positioning: Customizable placement for both tables
MA Color: Select custom color for EMA plot
Intended Use Cases
Identify reversal or continuation setups near EMAs
Validate strategies relying on mean reversion
Backtest the consistency of price respect to EMAs
Detect periods of volatility clustering around EMAs
Notes and Disclaimers
This script does not repaint: calculations are made on confirmed bars.
This indicator is educational in nature and should be used alongside other forms of analysis.
Time durations in the tables are approximated using bar timing and may vary across markets/timeframes.

TICK ±1200 Intrabar MarkerMarks +1100 and -1200 NYSE TICK readings on any chart. Useful for TICK fades without having to look at the actual USI:TICK chart.

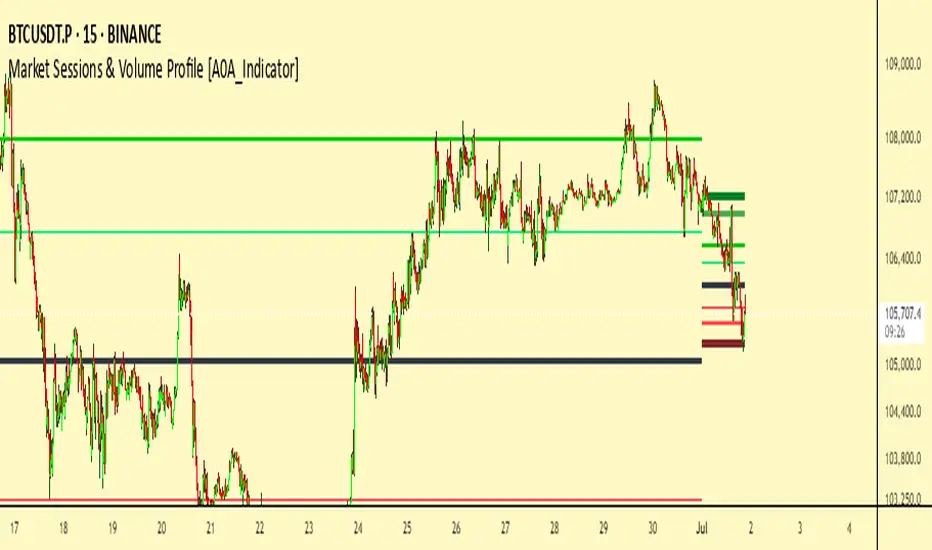
Market Sessions & Volume Profile [A0A_Indicator]Description:
This advanced chart overlay is designed for traders who want maximum clarity in price formation and market structure. The tool visualizes the true market activity within individual sessions using multi-zonal approaches. It offers highly distinctive levels for both historically relevant and real-time trading ranges, all in a dynamic, adaptive visual structure.
What makes it unique:
Multiple layered price acceptance areas: Several tiers of market activity are shown, with each zone individually highlighted for optimal pattern recognition.
Session-adaptive boundaries: The displayed ranges adjust automatically depending on the trading session you select, for optimal relevance.
Precision liquidity markers: A central focus level is always marked and stands out clearly against the chart background.
Real-time adaptive: The profile responds immediately as new market data arrives, providing up-to-date structure and context.
Visual customization: All graphical features can be shown or hidden to match your personal analytical style.
Who should use this:
Anyone seeking to identify genuine value consensus, rejection extremes, and price memory zones within global trading hours—whether for intraday or swing analysis.
🧩Tawajoh +🧩Tawajoh + Indicator Explanation
The Tawajoh + indicator is a comprehensive technical analysis tool designed to provide a broad market perspective by combining several advanced analytical techniques into a single indicator.
Main Components:
Market Shift Logic:
This part uses the Hull Moving Average (HMA) to detect market shifts by comparing a fast HMA with a delayed one. When a crossover or crossunder happens, it defines a new "Shift Level" and displays labels showing volume or price data along with color-coded signals indicating the market direction.
Smoothed Heiken Ashi (SHA):
Applies smoothing on traditional Heiken Ashi candles using various moving averages (like LSMA, SMA, EMA, etc.) to provide clearer trend visualization with reduced noise and volatility.
HMA PLANz (Hull Moving Averages):
Plots two customizable moving averages (types include SMA, EMA, WMA, HMA) with user-defined source prices (close, high, low) and lengths, along with optional labels for easy identification.
High Liquidity Midline Logic:
Identifies the candle with the highest volume in a given period and plots a midpoint line (average of high and low) for that candle. The line color switches between green and red depending on the current close price position, and the high-volume candle is highlighted in yellow.
RSI 50 EMA Smoothed:
A refined RSI indicator smoothed using a custom EMA near the 50 level, offering precise signals with color changes based on price action and optional labels for clarity.
Volumatic Logic (Volume Dynamics):
Tracks volume trends using smoothed EMAs, plotting volume candles with dynamic colors and gradients that reflect uptrends or downtrends in volume strength, helping to confirm market momentum shifts.
How to Use Tawajoh + Indicator:
Detect Market Shifts: Watch the Market Shift levels and their labels for important turning points.
Read Overall Trend: Use the Smoothed Heiken Ashi candles and moving averages to identify the main trend with less noise.
Monitor Liquidity: The High Liquidity Midline helps spot potential support/resistance levels based on heavy trading activity.
Confirm with RSI & Volume: RSI signals around level 50 combined with volume dynamics give additional confirmation of trend strength or reversals.


Simple Bollinger BandsBollinger Bands are a popular technical analysis indicator used to measure market volatility and identify potential overbought or oversold conditions.
This script plots:
A middle band (20-period Simple Moving Average)
An upper band (SMA + 2 standard deviations)
A lower band (SMA – 2 standard deviations)

Ultimate Gold Automated Strategy By Golden BALLAGE
FREE FOR A LIMITED PERIOD OF TIME
🔥 Special Bonus for Early Adopters:
* Free Strategy Optimization Session (Value: $200)
* Exclusive Access to Future Updates (Value: $150)
* Private Trader Community Access (Value: $100)
Total Bonus Value: $450 BUT
JUST $29 for the first 10 Lucky Subscribers!
🏆The Ultimate Gold Trading System for Serious Traders
🎯 Transform Your Gold Trading with my Professional-Grade Algorithm
Are you tired of inconsistent gold trading results? Ready to trade XAUUSD like institutional professionals? This advanced multi-timeframe strategy combines cutting-edge technical analysis with sophisticated risk management to deliver consistent, profitable results in the volatile gold market.
⚡ What Makes This Strategy Revolutionary?
🧠 Multi-Dimensional Market Analysis
* Multi-Timeframe Convergence: Analyzes higher and lower timeframes simultaneously for high-probability setups
* Dynamic Trend Detection: Advanced EMA system with slope analysis for precise trend identification
* Smart Momentum Filtering: RSI and MACD integration with divergence detection
* Market Structure Recognition: Automatic swing high/low detection and structure break analysis
🛡️ Institutional-Level Risk Management
* Dynamic Position Sizing: Automatically calculates optimal position size based on your risk tolerance
* Adaptive Stop Loss: ATR-based stops that adjust to market volatility
* Advanced Trailing System: Protects profits while letting winners run
* Drawdown Protection: Built-in emergency exits when market conditions deteriorate
* Risk-Reward Optimization: Minimum 2:1 RR ratio ensures favorable risk profile
🕐 Session-Aware Trading Intelligence
* Global Session Optimization: Trades only during high-liquidity sessions (London, NY, Asian)
* Overlap Priority: Focuses on London-NY overlap periods for maximum opportunity
* News Event Filtering: Automatically avoids high-impact news periods
* Spread Monitoring: Ensures optimal entry conditions with spread filtering
📊 Professional-Grade Features
🎨 Visual Intelligence Dashboard
* Color-Coded Trend Visualization: Instantly identify market direction
* Dynamic Support/Resistance Levels: Real-time key level identification
* Session Highlighting: Visual session overlay for optimal timing
* Volatility Warnings: Alerts for extreme market conditions
📈 Real-Time Performance Monitoring
* Live Statistics Table: Track win rate, profit factor, and drawdown in real-time
* Performance Metrics: Comprehensive analysis of strategy effectiveness
* Risk Monitoring: Current drawdown and equity tracking
* Session Status: Live indication of optimal trading periods
🎖️ Why Professional Traders Choose This Strategy
✅ Proven Performance Metrics
* High Win Rate Optimization: Designed for consistent profitability
* Superior Risk-Adjusted Returns: Maximum profit with controlled risk
* Adaptive to Market Conditions: Performs in trending and ranging markets
* Backtested Excellence: Thoroughly tested across multiple market cycles
✅ Complete Trading Solution
* No Guesswork: Algorithm handles all analysis and decision-making
* Emotional Trading Elimination: Systematic approach removes psychological barriers
* Time Efficiency: Perfect for busy professionals and part-time traders
* Scalable: Works with any account size with proper risk management
✅ Advanced Technology Stack
* Pine Script v6: Latest technology for optimal performance
* Multi-Indicator Fusion: Combines the best of technical analysis
* Real-Time Execution: Processes every tick for precise entries and exits
* Customizable Parameters: Fine-tune to match your trading style
🚀 Perfect For:
* Serious Gold Traders seeking consistent profits
* Busy Professionals who need automated precision
* Risk-Conscious Investors prioritizing capital preservation
* Swing Traders looking for high-probability setups
* Portfolio Managers requiring systematic approaches
💎 What You Get:
📋 Complete Strategy Package
* ✅ Detailed parameter explanations and optimization guide
* ✅ Risk management framework and position sizing calculator
* ✅ Session timing and market condition filters
* ✅ Visual dashboard with real-time performance metrics
📚 Comprehensive Documentation
* ✅ Strategy logic explanation
* ✅ Parameter optimization guidelines
* ✅ Risk management best practices
* ✅ Troubleshooting and common questions
* ✅ Performance analysis and improvement tips
🎯 Ongoing Support
* ✅ Setup assistance and installation guidance
* ✅ Parameter customization recommendations
* ✅ Strategy updates and improvements
* ✅ Market condition adaptation advice
⏰ Limited Time Opportunity
This professional-grade strategy represents months of development and years of trading experience condensed into a powerful, automated system. Don't let another profitable gold move pass you by.
🏆 Join the Elite Circle of Profitable Gold Traders Today!
Stop gambling with your capital. Start trading like a professional.
This isn't just another indicator - it's your pathway to consistent gold trading success.
⚠️ Disclaimer: Past performance does not guarantee future results. Trading involves risk of capital loss. Only trade with money you can afford to lose.

Simple RSIThe Relative Strength Index (RSI) is a momentum oscillator that measures the speed and change of price movements. It helps traders identify overbought or oversold conditions in the market.
This script plots the 14-period RSI, which is one of the most commonly used settings.
How It Works:
The RSI ranges from 0 to 100.
Values above 70 suggest the asset may be overbought (a potential sell area).
Values below 30 suggest the asset may be oversold (a potential buy area).


Gold Trend Scalper [Strategy]This strategy identifies the main trend using a 200-period moving average and enters trades on pullbacks to a 21-period moving average. It automatically calculates position size based on a fixed percentage risk and sets a volatility-based stop-loss and take-profit using the Average True Range (ATR).

🧪 Yuri Garcia Smart Money Strategy FULL (Slope Divergence))📣 Yuri Garcia – Smart Money Strategy FULL
This is my private Smart Money Concept strategy, designed for my family and community to learn, trade, and grow sustainably.
🔑 How it works:
✅ Volume Cluster Zones: Automatically detects areas where strong buyers or sellers concentrate, acting as dynamic S/R levels.
✅ HTF Institutional Zones (4H): Higher timeframe trend filter ensures you’re always trading in the direction of major flows.
✅ Wick Pullback Filter: Confirms price rejects the zone, catching smart money traps and reversals.
✅ Cumulative Delta (CVD): Confirms whether buyers or sellers are truly in control.
✅ Slope-Based Divergence: Optional hidden divergence between price & CVD to spot reversals others miss.
✅ ATR Dynamic SL/TP: Adapts stop loss and take profit to live volatility with adjustable risk/reward.
🧩 Visual Markers Explained:
🟦 Blue X: Price inside HTF zone
🟨 Yellow X: Price inside Volume Cluster zone
🟧 Orange Circle: Wick pullback detected
🟥 Red Square: CVD confirms order flow strength
🔼 Aqua Triangle Up: Bullish slope divergence
🔽 Purple Triangle Down: Bearish slope divergence
🟢 Green Triangle Up: Final Long Entry confirmed
🔴 Red Triangle Down: Final Short Entry confirmed
⚡ Who is this for?
This strategy is best suited for traders who understand smart money concepts, order flow, and want an adaptive framework to trade major assets like BTC, Gold, SP500, NASDAQ, or FX pairs.
🔒 Important
Use responsibly, backtest extensively, and combine with solid risk management. This is for educational purposes only.
✨ Credits
Built with ❤️ by Yuri Garcia – dedicated to my family & community.
✅ How to use it
1️⃣ Add to chart
2️⃣ Adjust inputs for your asset & timeframe
3️⃣ Enable/disable slope divergence filter to match your style
4️⃣ Set your alerts with built-in conditions

Vela dominante con cruce de ema y zona horaria (Juan H.)Indicator Description: "Dominant Candle + EMA Cross + Time Zones"
This indicator was specifically designed for intraday trading on the EUR/USD pair, following a methodology based on price action, liquidity, and market structure.
🕒 Suggested Trading Hours (Argentina Time):
Early London Session: 3:00 AM to 6:00 AM
New York Session: 10:30 AM to 12:00 PM
📌 Trading Strategy:
Time Block: 3:00 AM – 6:00 AM:
Before entering any trade, I wait for the price to break the high or low of the Asian session, clearly marked on the chart by the lines extending from the Asia box.
If the Asian low is broken: I will only look for buy signals.
If the Asian high is broken: I will only look for sell signals.
I enter only on the first signal that appears after the break, always following the direction of the breakout.
Stop Loss Placement:
For buys: Below the last FVG (Fair Value Gap) that is located below the 11 and 21 EMAs.
For sells: Above the last FVG that is above the 11 and 21 EMAs.
Time Block: 10:30 AM – 12:00 PM:
The same logic applies, but in this case, I wait for a breakout of the London session’s high or low.
If the high or low of London has not been broken before 12:00 PM, I skip trading for that block.
🎯 Trade Management:
Minimum recommended Risk-Reward Ratio: 1:2
My personal approach: I target a 1:3 R:R, applying fractional profit-taking:
20% of the position at 1:1
40% at 1:2
40% at 1:3
I highly recommend each trader conduct their own backtesting to find the TP distribution that best suits their style.
📍 Signal Conditions:
Signals from this indicator won’t trigger under just any circumstances. They appear only when several quality filters are met:
The signal must occur outside a range-bound zone.
The signal requires a dominant (engulfing) candle that crosses the 21 EMA.
Usually, the same candle that generates the signal forms an FVG, making it easier to define a technical and logical Stop Loss level.
This approach aims to increase win probability by combining:
Price Action + Structure + Liquidity + Intraday Timing.
I hope this tool adds value to your trading!

SD Levels"SD Levels", is a powerful tool for technical analysis that automatically calculates and plots key price levels based on the price action within a user-defined time range. It functions by identifying a specific trading session, calculating the midpoint and half the range of that session's price action, and then using these values as a baseline and a standard deviation equivalent to project a series of customizable Fibonacci-style levels into the future.
These projected levels can act as potential support and resistance zones, helping traders identify significant price areas where the market might react. The indicator is highly customizable, allowing users to tailor its functionality and appearance to their specific trading strategies.
Key Features
• User-Defined Time Range: You can specify a particular time window (e.g., the first three hours of the New York session) and a corresponding timezone. The indicator will base all its calculations on the high, low, and closing prices within this defined period each day.
• Standard Deviation-Based Levels: The core of the indicator is its use of a "standard deviation" value, which is calculated as half the range (High - Low) of the specified session. The baseline, or "0" level, is the midpoint of this range.
• Customizable Fibonacci Levels: The script allows for the plotting of up to 11 distinct levels, each defined by a multiplier of the calculated standard deviation. Users have complete control over:
o The level's multiplier value.
o Whether the level is displayed.
o The color, style (solid, dashed, dotted), and thickness of the level line.
o The option to display a text label for each level.
• Mirrored Levels: An option is available to automatically "mirror" each level on the opposite side of the baseline. For example, if you have a level at 1.5 standard deviations above the baseline, enabling the mirror function will also plot a corresponding level at -1.5 standard deviations below it.
• Visual Customization: Beyond individual line styles, you can adjust the overall appearance of the levels, including:
o Adding a transparent background fill between the levels to enhance visibility.
o Adjusting the padding (extension) of the level lines to the right of the chart.
o Controlling the size of the labels and choosing to display the level value, the price value, or both.
• Historical Analysis: The indicator can display these calculated levels for a user-specified number of previous days, allowing for back-testing and analysis of how price has historically interacted with these zones.
How It Works
1. Session Identification: The indicator first identifies the bars on the chart that fall within the user-defined Range Time and Timezone.
2. Range Calculation: During this identified session, it records the highest high and the lowest low.
3. Baseline and Deviation Calculation: At the end of the session, it calculates two critical values:
o Baseline: The midpoint of the session's range, calculated as (range_high + range_low) / 2. This serves as the 0 level.
o Standard Deviation Value: Half of the session's total range, calculated as (range_high - range_low) / 2.
4. Level Plotting: Using the baseline and the standard deviation value, the indicator calculates and plots the various user-defined Fibonacci levels. For instance, a level with a multiplier of 2.0 would be plotted at baseline + (2 * stdev_val).
5. Drawing and Extension: The calculated levels are drawn starting from the beginning of the session and are extended forward in time, updating with each new bar. This allows traders to see how the current price is interacting with the levels derived from the earlier session.
In essence, the "SD Levels" indicator provides a structured and automated way to identify and visualize significant, data-driven price levels based on the volatility and price action of a specific, important trading period.

TTNY - CISD modelfirst version.
This indicator takes an user time and price input to start tracking CISD entry models. The use is quite straightforward I believe.

Spartan Trading Swing High Low Mapper 1.0Spartan Trading Swing High Low Mapper 1.0
is a clean and structured framework designed to visualize swing highs and lows effectively. It assists traders in accurately identifying swing points, key Change of Character (CH) zones, and breakers. The tool also highlights "X" points and inducements within the major market structure, making it especially valuable for recognizing higher timeframe swings while analyzing lower timeframe charts.
Built for repeatability, the model enhances trader confidence by fostering familiarity rather than complexity.
This non-repainting tool is carefully engineered to mark completed market rotations, offering clarity without distortion. It provides flexibility across various assets and timeframes, allowing traders to customize their view while maintaining a consistent and reliable structure.
Swing high formation
For a swing high to form, the high of Candle 1 must break above the high of Candle 2,
and the low of Candle 2 must break below the low of Candle 3
Swing low formation
For a swing low to form, the low of Candle 1 must break below the low of Candle 2, and the high of Candle 2 must break above the high of Candle 3
Time frame alignment
This indicator will show higher time frame swing when you are in the lower time frame
for example if your are in 5min time frame it will auto plot 1h swing aswell it helps the traders when actually htf's are doing.
Monthly - daily
weekly-4h
daily -1h
4h-15m
1h-5min
15-1min
Terms and Conditions
Our charting tools are products provided for informational and educational purposes only and do not constitute financial, investment, or trading advice. Our charting tools are not designed to predict market movements or provide specific recommendations. Users should be aware that past performance is not indicative of future results and should not be relied upon for making financial decisions. By using our charting tools, the purchaser agrees that the seller and the creator are not responsible for any decisions made based on the information provided by these charting tools. The purchaser assumes full responsibility and liability for any actions taken and the consequences thereof, including any loss of money or investments that may occur as a result of using these products. Hence, by purchasing these charting tools, the customer accepts and acknowledges that the seller and the creator are not liable nor responsible for any unwanted outcome that arises from the development, the sale, or the use of these products. Finally, the purchaser indemnifies the seller from any and all liability. If the purchaser was invited through the Friends and Family Program, they acknowledge that the provided discount code only applies to the first initial purchase of the spartantradingacademy Premium Suite subscription. The purchaser is therefore responsible for cancelling – or requesting to cancel – their subscription in the event that they do not wish to continue using the product at full retail price. If the purchaser no longer wishes to use the products, they must unsubscribe from the membership service, if applicable. We hold no reimbursement, refund, or chargeback policy. Once these Terms and Conditions are accepted by the Customer, before purchase, no reimbursements, refunds or chargebacks will be provided under any circumstances.
By continuing to use these charting tools, the user acknowledges and agrees to the Terms and Conditions outlined in this legal disclaimer.

Multi-Timeframe OHLC Levels█ OVERVIEW
A fully customizable multi-timeframe indicator that independently plots levels based on the open, previous close, previous high, previous low, and previous mid-price.
This tool is ideal for traders who require a high level of tailoring and usability.
█ FEATURES
Multi-timeframe
Select the timeframe for each level separately. The indicator shows higher timeframe levels down to the 1-second chart.
Multi-source
Choose the source for each level individually from the current open, previous close, previous high, previous low, and previous mid-price.
Past levels
Manage the number of relevant levels displayed on historical bars for trading or backtesting.
Projections
Extend the levels to the current price action with clear and clean options.
Styling
Adjust the appearance according to your preferences and screen size using options for color, line style, line thickness, custom name, and text size.
█ NOTES
This is a PREMIUM indicator.
You may also find my free Daily Weekly Monthly Yearly Opens and Previous Day Week Highs & Lows indicators helpful.

Líneas desde apertura 1 de eneroBased on the opening price of January 1st, generate lines at the base price, +10%, +20%, -10%, and -20%.
En base al precio de apertura del 1 de Enero, genera unas lineas a precio base, +10%, +20%, -10% y -20%

Yaman's - TREND 🔴🟢This indicator is designed to show two types of Trends.
Logic #1 Short Term Trends for scalping Traders.
Logic #2 Long Term Trends from the same Time Frames for Swing Traders.
Default Pairs: XAUUSD, DXY & BTCUSD (any other user defined pairs).
Time Frames: 1M, 5M, 15, 1H.
HAPPY TRADING!!!
Thanks
Yaman Didi
01/07/2025

九转序列[We1h0]█ 九转序列 - 趋势衰竭与拐点探测器 (Sequence Counter - Trend Exhaustion & Reversal Detector)
▌ 摘要 (Summary)
中文:
本指标的灵感来源于一种经典的时间序列分析理论,旨在识别潜在的市场趋势衰竭点。它通过计算连续收盘价高于或低于特定周期前收盘价的K线数量,来量化趋势的“生命力”。当计数达到关键数字(如9或13)时,通常预示着当前趋势动力可能已经耗尽,市场面临回调或反转的风险。本版本提供了高度自定义的开关,允许用户自由选择关注的信号数字(7, 9, 13, 15),并集成了灵活的警报功能。
English:
Inspired by a classic time-series analysis theory, this indicator is designed to identify potential points of trend exhaustion. It quantifies the "lifespan" of a trend by counting the number of consecutive bars that close higher or lower than the close four bars prior. When the count reaches key numbers (such as 9 or 13), it often suggests that the momentum of the current trend may be depleted, and the market is at risk of a pullback or reversal. This version features highly customizable switches, allowing users to select which numerical signals (7, 9, 13, 15) to monitor, and includes an integrated, flexible alert system.
▌ 核心原理 (Core Concept)
上涨序列 (Sell Setup / Up Count): 当一根K线的收盘价高于其前方第4根K线的收盘价时,计数器会递增。这构成了一个上涨序列。
下跌序列 (Buy Setup / Down Count): 当一根K线的收盘价低于其前方第4根K线的收盘价时,计数器会递增。这构成了一个下跌序列。
当序列计数达到“9”,通常意味着趋势的“设置”阶段已经完成,为潜在的反转做好了准备。
▌ 主要功能 (Key Features)
自动序列计数 (Automatic Sequence Counting):
自动追踪并计算上涨和下跌序列。
Automatically tracks and counts both uptrend and downtrend sequences.
关键数字标记 (Key Number Labeling):
在图表上清晰地标记出数字 7, 9, 13, 15,帮助您快速识别潜在的交易机会。
Clearly labels the key numbers 7, 9, 13, and 15 on the chart to help you quickly identify potential trading opportunities.
高度自定义开关 (Highly Customizable Switches):
用户可以在设置中自由选择启用或禁用任何一个数字信号的显示和警报,让分析更专注。
Users can freely enable or disable the display and alerts for any numerical signal in the settings, allowing for a more focused analysis.
集成化警报系统 (Integrated Alert System):
为关键数字(9, 13, 15)提供了独立的弹窗警报,并构建了预格式化的JSON消息,便于与Discord等第三方应用通过Webhook集成。
Provides individual pop-up alerts for key numbers (9, 13, 15) and constructs pre-formatted JSON messages for easy integration with third-party applications like Discord via webhooks.
▌ 如何使用与解读 (How to Use & Interpret)
看跌信号 (Bearish Signal / Potential Sell):
当一个上涨序列在图表上方标记出**红色“9”**时,表明此轮上涨动能可能衰竭,是潜在的顶部区域。交易者可考虑止盈多头仓位或寻找做空机会。数字“13”和“15”代表更强的衰竭信号。
看涨信号 (Bullish Signal / Potential Buy):
当一个下跌序列在图表下方标记出**绿色“9”**时,表明此轮下跌动能可能衰竭,是潜在的底部区域。交易者可考虑止盈空头仓位或寻找做多机会。数字“13”和“15”同样代表更强的衰竭信号。
数字“7”的用法 (Usage of Number "7"):
数字“7”通常被视为一个预警信号,提示当前趋势已经延续了一段时间,需要开始保持警惕。
重要提示: 本指标是一个寻找“拐点”的择时工具,而非趋势跟踪工具。建议将它与支撑/阻力位、市场结构、或其他动量指标结合使用,以提高信号的胜率。
▌ 参数设置 (Settings)
显示设置 (Display Settings): 控制标记的透明度、是否显示数字等。
信号开关 (Signal Switches): 本指标的核心功能。您可以独立控制 7, 9, 13, 15 中任意一个数字的显示与否及其警报的触发。
▌ 免责声明 (Disclaimer)
本指标仅为技术分析学习和研究工具,所有信号均不构成任何形式的投资建议。请务必结合您自己的交易系统和风险管理策略进行决策。
This indicator is for educational and research purposes only. All signals generated do not constitute any form of investment advice. Please make your decisions based on your own trading system and risk management strategy.

Cruce de 3EMAs CHL - Multi Temporalidad📈 3EMAs Crossover CHL – Multi-Timeframe
📊 Overview
An advanced technical analysis indicator that combines the classic 3 EMA system (10, 50, 200) with an innovative multi-timeframe panel. Designed for traders seeking confluences across different timeframes to make more informed decisions.
🎯 Key Features
✅ 3 EMA System
EMA 10 (Blue): Fast signal for short-term movements
EMA 50 (Orange): Intermediate trend filter
EMA 200 (Purple): Main trend and key support/resistance level
✅ Automatic Visual Signals
Green Triangle (↑): Bullish crossover – EMA 10 crosses above EMA 50
Red Triangle (↓): Bearish crossover – EMA 10 crosses below EMA 50
Colored Background: Green for bullish trend, red for bearish
✅ Multi-Timeframe Panel (Bottom Right Corner)
Analyzes 5 timeframes simultaneously:
5M: Ideal for scalping and precise entries
15M: Short-term swing trading
1H: Intraday analysis
4H: Mid-term swing trading
1D: Primary trend
✅ Panel Information
4 Informative Columns:
Time: Analyzed timeframe
EMA: ↑ (Bullish) / ↓ (Bearish) based on EMA 10 vs EMA 50
Trend: Clearly defined Bullish/Bearish
EMA200: Relative position (Above / Below / In-between)
🚀 Unique Advantages
📋 Confluence Analysis
Detects when multiple timeframes are aligned
Stronger signals when timeframes show confluence
Avoids false signals using higher-timeframe filters
📋 Improved Risk Management
EMA 200 Below: Strong support – favorable for longs
EMA 200 Above: Strong resistance – favorable for shorts
EMA 200 In-between: Indecision zone – caution advised
📋 Trading Versatility
Scalping: Use 5M and 15M for quick entries
Day Trading: Combine 15M, 1H, and 4H
Swing Trading: Focus on 4H and 1D
Position Trading: Use 1D as main filter
🎨 Color Coding
🟢 Green (Bullish)
↑ Arrows in the panel
EMA 10 > EMA 50
EMA 200 below both EMAs (support)
🔴 Red (Bearish)
↓ Arrows in the panel
EMA 50 > EMA 10
EMA 200 above both EMAs (resistance)
🟡 Yellow (Caution)
EMA 200 in intermediate position
Market in transition or consolidation
📊 How to Use It
🎯 For Long Entries
Look for bullish confluence across multiple timeframes
Ensure EMA 200 is “Below” (acting as support)
Wait for a bullish crossover on the entry timeframe
Confirm with higher timeframes
🎯 For Short Entries
Look for bearish confluence across multiple timeframes
Ensure EMA 200 is “Above” (acting as resistance)
Wait for a bearish crossover on the entry timeframe
Confirm with higher timeframes
🎯 Position Management
Partial Close: When lower timeframes shift
Full Close: When higher timeframes reverse
Stop Loss: Based on EMA 200 as support/resistance
⚙️ Customizable Settings
EMA Periods: Adjustable (default: 10, 50, 200)
Automatic Alerts: For bullish and bearish crossovers
Colors: Fully customizable
📈 Recommended Markets
Forex: All major and minor pairs
Cryptocurrencies: Bitcoin, Ethereum, Altcoins
Indices: S&P 500, NASDAQ, DAX, etc.
Commodities: Gold, Oil, Silver
Stocks: Any stock with sufficient liquidity
⚠️ Important Considerations
Works best in trending markets
Use with caution in sideways markets
Combine with other indicators for confirmation
Always apply proper risk management
💬 Support
Indicator developed by CHL Trading. For inquiries, suggestions, or bug reports, contact via comments or cristma95@gmail.com.

📊 MERGED: TARA + TREND + SUPER TRIGGER//@version=5
indicator("📊 MERGED: TARA + TREND + SUPER TRIGGER", overlay=true)
// === EMAs & VWAP ===
ema5 = ta.ema(close, 5)
ema20 = ta.ema(close, 20)
ema50 = ta.ema(close, 50)
ema200 = ta.ema(close, 200)
vwap = ta.vwap
// === Plot EMAs & VWAP ===
plot(ema5, color=color.orange, title="EMA 5")
plot(ema20, color=color.blue, title="EMA 20")
plot(ema50, color=color.red, title="EMA 50")
plot(ema200, color=color.gray, title="EMA 200")
plot(vwap, color=color.purple, title="VWAP")
// ========== LOGIC 1: ⭐ TARA Candle (EMA50 Retest) ==========
emaCrossUp = ta.crossover(ema20, ema50)
emaCrossDown = ta.crossunder(ema20, ema50)
var bool buyCrossoverActive = false
var bool sellCrossoverActive = false
if emaCrossUp
buyCrossoverActive := true
if emaCrossDown
buyCrossoverActive := false
if emaCrossDown
sellCrossoverActive := true
if emaCrossUp
sellCrossoverActive := false
// BUY Retest
var float retestHigh = na
var int retestBar = na
buyRetest = buyCrossoverActive and close < ema50 and high < ema5 and high < ema20 and high < ema50
if buyRetest
retestHigh := high
retestBar := bar_index
buyBreakout_TARA = not na(retestHigh) and bar_index == retestBar + 1 and high > retestHigh and low <= retestHigh and ema5 > ema200 and ema20 > ema200 and ema50 > ema200 and close > ema200
if buyBreakout_TARA
retestHigh := na
retestBar := na
// SELL Retest
var float retestLow = na
var int retestBarSell = na
sellRetest = sellCrossoverActive and close > ema50 and low > ema5 and low > ema20 and low > ema50
if sellRetest
retestLow := low
retestBarSell := bar_index
sellBreakdown = not na(retestLow) and bar_index == retestBarSell + 1 and low < retestLow and high >= retestLow and ema5 < ema200 and ema20 < ema200 and ema50 < ema200 and close < ema200
if sellBreakdown
retestLow := na
retestBarSell := na
plotshape(buyBreakout_TARA, title="⭐ BUY TARA CANDLE", style=shape.labelup, location=location.belowbar, color=color.rgb(243, 240, 46), text="⭐ BUY TARA CANDLE", textcolor=color.rgb(248, 11, 11), size=size.normal, offset=-1)
plotshape(sellBreakdown, title="⭐ SELL TARA CANDLE", style=shape.labeldown, location=location.abovebar, color=color.rgb(134, 6, 6), text="⭐ SELL TARA CANDLE", textcolor=color.rgb(233, 247, 38), size=size.normal, offset=-1)
// === ALERTS ===
alertcondition(buyBreakout_TARA, title="⭐ BUY Alert", message="⭐ BUY TARA CANDLE 🔔 on {{ticker}} at {{close}}")
alertcondition(sellBreakdown, title="⭐ SELL Alert", message="⭐ SELL TARA CANDLE 🔔 on {{ticker}} at {{close}}")
// ========== LOGIC 2: Trend Touches at EMA50/VWAP ==========
bullishStructure = ema5 > ema20 and ema20 > ema50 and ema5 > ema200 and ema20 > ema200 and ema50 > ema200 and close > ema200
bearishStructure = ema5 < ema20 and ema20 < ema50 and ema5 < ema200 and ema20 < ema200 and ema50 < ema200 and close < ema200
trendBreakBull = ta.crossunder(ema20, ema50)
trendBreakBear = ta.crossover(ema20, ema50)
var bool bullishActive = false
var bool bearishActive = false
if bullishStructure
bullishActive := true
if trendBreakBull
bullishActive := false
if bearishStructure
bearishActive := true
if trendBreakBear
bearishActive := false
dist = 0.002
var bool canBuyEMA50 = true
if (low - ema50) / ema50 > dist
canBuyEMA50 := true
ema50TouchFromAbove = close > ema50 and low <= ema50
buySignal_EMA50 = bullishActive and ema50TouchFromAbove and canBuyEMA50
if buySignal_EMA50
canBuyEMA50 := false
var bool canBuyVWAP = true
if (low - vwap) / vwap > dist
canBuyVWAP := true
vwapTouchFromAbove = close > vwap and low <= vwap
buySignal_VWAP = bullishActive and vwapTouchFromAbove and canBuyVWAP and vwap < ema20
if buySignal_VWAP
canBuyVWAP := false
var bool canSellEMA50 = true
if (ema50 - high) / ema50 > dist
canSellEMA50 := true
ema50TouchFromBelow = close < ema50 and high >= ema50
sellSignal_EMA50 = bearishActive and ema50TouchFromBelow and canSellEMA50
if sellSignal_EMA50
canSellEMA50 := false
var bool canSellVWAP = true
if (vwap - high) / vwap > dist
canSellVWAP := true
vwapTouchFromBelow = close < vwap and high >= vwap
sellSignal_VWAP = bearishActive and vwapTouchFromBelow and canSellVWAP and vwap > ema20
if sellSignal_VWAP
canSellVWAP := false
plotshape(buySignal_EMA50, title="BUY EMA50", location=location.belowbar, style=shape.labelup, color=color.green, text="BUY")
plotshape(buySignal_VWAP, title="BUY VWAP", location=location.belowbar, style=shape.labelup, color=color.yellow, text="BUY")
plotshape(sellSignal_EMA50, title="SELL EMA50", location=location.abovebar, style=shape.labeldown, color=color.red, text="SELL")
plotshape(sellSignal_VWAP, title="SELL VWAP", location=location.abovebar, style=shape.labeldown, color=color.yellow, text="SELL")
alertcondition(buySignal_EMA50, title="Buy on EMA50", message="BUY Signal: EMA50 touch from above (bullish trend)")
alertcondition(buySignal_VWAP, title="Buy on VWAP", message="BUY Signal: VWAP touch from above (VWAP below EMA20)")
alertcondition(sellSignal_EMA50, title="Sell on EMA50", message="SELL Signal: EMA50 touch from below (bearish trend)")
alertcondition(sellSignal_VWAP, title="Sell on VWAP", message="SELL Signal: VWAP touch from below (VWAP above EMA20)")
// ========== LOGIC 3: SUPER TRIGGER BUY & SELL ==========
bullishCross = ta.crossover(ema20, ema50)
bearishCross = ta.crossunder(ema20, ema50)
var bool validBuyCrossover = false
var bool priceWentAboveEMA200 = false
var bool ema20Above200 = false
if bullishCross
validBuyCrossover := true
if bearishCross
validBuyCrossover := false
if validBuyCrossover and close > ema200
priceWentAboveEMA200 := true
if bearishCross
priceWentAboveEMA200 := false
if validBuyCrossover and ema20 > ema200
ema20Above200 := true
if bearishCross
ema20Above200 := false
var bool validSellCrossdown = false
var bool priceWentBelowEMA200 = false
var bool ema20Below200 = false
if bearishCross
validSellCrossdown := true
if bullishCross
validSellCrossdown := false
if validSellCrossdown and close < ema200
priceWentBelowEMA200 := true
if bullishCross
priceWentBelowEMA200 := false
if validSellCrossdown and ema20 < ema200
ema20Below200 := true
if bullishCross
ema20Below200 := false
buySetupCandle = close < ema5 and close < ema20 and close < ema50 and close < ema200
buyHighClean = high < ema5 and high < ema20 and high < ema50 and high < ema200
validBuySetup = buySetupCandle and buyHighClean
buyBreakout_SUPER = high > high
sellSetupCandle = close > ema5 and close > ema20 and close > ema50 and close > ema200
sellLowClean = low > ema5 and low > ema20 and low > ema50 and low > ema200
validSellSetup = sellSetupCandle and sellLowClean
sellBreakout_SUPER = low < low
var int lastSignalBar = na
cooldownPassed = na(lastSignalBar) or (bar_index - lastSignalBar > 2)
superBuy = (validBuyCrossover and priceWentAboveEMA200 and ema20Above200 and validBuySetup and buyBreakout_SUPER and cooldownPassed)
superSell = (validSellCrossdown and priceWentBelowEMA200 and ema20Below200 and validSellSetup and sellBreakout_SUPER and cooldownPassed)
if superBuy or superSell
lastSignalBar := bar_index
buyEntry = high
buySL = low
buyRisk = buyEntry - buySL
buyTP = buyEntry + (buyRisk * 1.5)
sellEntry = low
sellSL = high
sellRisk = sellSL - sellEntry
sellTP = sellEntry - (sellRisk * 2.0)
if superBuy
label.new(bar_index, low - buyRisk * 0.5, "SUPER TRIGGER", style=label.style_label_up, color=color.green, textcolor=color.white, size=size.small)
if superSell
label.new(bar_index, high + sellRisk * 0.5, "SUPER TRIGGER", style=label.style_label_down, color=color.red, textcolor=color.white, size=size.small)
alertcondition(superBuy, title="BUY SUPER TRIGGER", message="🟢 SUPER TRIGGER BUY | Entry: {{high}} | SL: {{low }} | Target: {{high + ((high - low ) * 1.5)}}")
alertcondition(superSell, title="SELL SUPER TRIGGER", message="🔴 SUPER TRIGGER SELL | Entry: {{low}} | SL: {{high }} | Target: {{low - ((high - low) * 2.0)}}")
