Volatility Zones (STDEV %)This indicator displays the relative volatility of an asset as a percentage, based on the standard deviation of price over a custom length.
🔍 Key features:
• Uses standard deviation (%) to reflect recent price volatility
• Classifies volatility into three zones:
Low volatility (≤2%) — highlighted in blue
Medium volatility (2–4%) — highlighted in orange
High volatility (>4%) — highlighted in red
• Supports visual background shading and colored line output
• Works on any timeframe and asset
📊 This tool is useful for identifying low-risk entry zones, periods of expansion or contraction in price behavior, and dynamic market regime changes.
You can adjust the STDEV length to suit your strategy or timeframe. Best used in combination with your entry logic or trend filters.
Indicators and strategies

Rejection Blocks (RJB) and Liquidity Grabs (SFPs)- Milana TradesThis indicator highlights Rejection Blocks (RJB) and Liquidity Grabs (SFPs)—two advanced price action concepts used by professional traders, especially those following ICT (Inner Circle Trader) strategies.
Rejection Block (RJB) is an advanced version of the traditional Order Block. It marks areas where price has been sharply rejected—often zones where smart money enters or exits positions. The logic is based on specific wick rejection criteria and candle structure, with mitigated RJBs marked or hidden automatically.
Liquidity Grab (SFP) detects key Swing Failure Patterns—where price takes out a previous high/low, grabs liquidity, and reverses. Optional volume validation is available for more accurate filtering, especially using LTF (lower timeframe) data.
Key Features:
Rejection Block (RJB)
1) Identifies both bullish and bearish rejection blocks.
2) Two logic types: “trapped wick” and “signal wick” configurations.
3) Auto-detection of mitigated RJBs and customizable visualization.
4)Adjustable color, transparency, box style, label text, and more.
5)Limit on max RJBs displayed to keep the chart clean.
Liquidity Grab (SFP)
1)Detects bullish and bearish SFPs (Swing Failure Patterns).
2)Optional volume validation with threshold control (based on LTF).
3)Dynamically adjusts lower timeframe resolution (auto/manual).
4)Visual confirmation lines, wick highlights, and labels.
5)SFP Dashboard table (optional) for LTF & validation display.
SFP Wick to RJB Zones
Converts confirmed SFPs into new RJB boxes.
Adds powerful confluence between rejection and liquidity.
🔔 Built-in Alerts
Alerts can be set up for both bullish and bearish Rejection Blocks, as well as confirmed SFPs.
Ideal for traders who want to be notified in real-time when price:
Forms a valid Rejection Block,
Prints a confirmed SFP (Swing Failure),
Enters or exits key liquidity zones.
Alerts are fully compatible with TradingView’s alert system.
⚙️ Settings Overview:
Rejection Blocks
Enable plotting, box limit, mitigated filtering, label customization.
Liquidity Grabs (SFPs)
Enable SFPs (bull/bear), pivot length, volume % threshold, LTF resolution.
Enable dashboard, wick display, and validation logic.
SFP-based RJB
Create RJB zones from confirmed SFP signals.
Independent box length and color settings.
Dashboard & Labels
Enable/disable visual labels and LTF info table.
Customize font size, color, and position.
Use Cases:
Identify smart money rejection zones before price reversals.
Use mitigated RJBs to anticipate failed retests or structure breaks.
Trade with confidence by combining RJB + SFP signals.
Set alerts to monitor setups without staring at charts 24/7.
Notes:
Compatible with any market (Forex, Crypto, Indices, Stocks).
Works on all timeframes.

MSS Strong Confirmed PROMSS Strong Confirmed PRO is a high-precision market structure indicator built for serious traders. It automatically detects Market Structure Shifts (MSS) and filters them through trend direction (AlphaTrend), RSI confirmation, and strong candlestick patterns.
It only gives you signals when the market shows a real trend change with momentum confirmation — reducing noise and increasing the probability of successful entries.
The script marks confirmed entries with TP/SL levels based on risk-reward ratio, helping traders automate part of their decision-making process. Ideal for scalping and swing trading on any timeframe.
Main Features:
- MSS Detection (Break of swing highs/lows)
- AlphaTrend direction filter
- RSI > 50 / < 50 confirmation
- Strong candle confirmation (body ratio logic)
- Auto TP & SL based on ATR
- Alerts for confirmed long/short setups
Perfect for Smart Money Concept (SMC) traders.

Multi-Timeframe Close Alert with Toggleyou can create alerts with this indicator for when a time frame closes

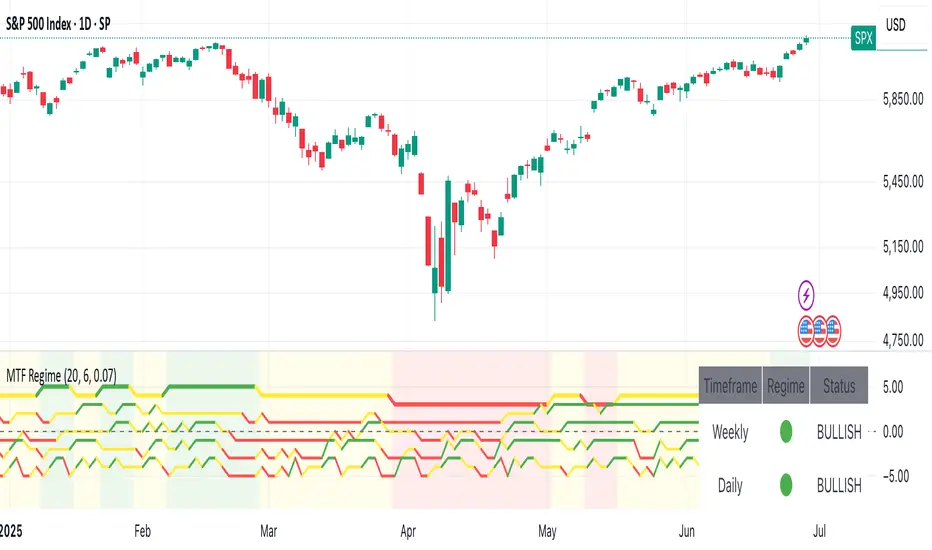
Multi-Timeframe Market Regime (Ehlers)This Pine Script indicator provides an Ehlers-inspired multi-timeframe market regime analysis directly on your TradingView chart. It aims to identify whether the market is currently "Trending Up" (green), "Trending Down" (red), or "Ranging" (yellow) across Weekly, Daily, 4-Hour, and 1-Hour timeframes.
It uses custom implementations of:
Ehlers' Fisher Transform to highlight market extremes and potential turning points.
An Adaptive Moving Average (inspired by MAMA/FAMA) that adjusts its speed based on volatility to reduce lag in trends and provide stability in ranges.
The indicator displays a dashboard as a label on your chart, showing the detected regime for each of these timeframes, and optionally colors the background of your current chart timeframe to reflect its dominant regime.
ZY Legend StrategyZY Legend Strategy indicator follows the trend, sets up transactions and clearly shows the transactions it opens on the chart. SL is not used in the strategy, instead, additions are made to positions.

EMA Cloud 200 High/Close (multi)EMA Cloud 200 High/Close (multi)
This indicator plots an EMA cloud between two 200-period Exponential Moving Averages—one based on High prices, the other on Close prices. Choose your preferred timeframe or use the current chart timeframe. The cloud’s color changes to green (bullish) or red (bearish) depending on trend direction, making it easy to spot support, resistance, and market trends at a glance.

MTA Suite Pro (By Levi)This is a comprehensive all-in-one technical analysis indicator that combines multiple essential trading tools into a single, customizable overlay. Perfect for traders who want to reduce chart clutter while maintaining access to critical technical indicators.
🎯 Key Features
📊 Trend Analysis Tools
Bollinger Bands - Dynamic volatility bands with customizable MA types
Supertrend - Trend-following indicator with ATR-based stops
10 Simple Moving Averages - From 20 to 600 periods with bull/bear coloring
📍 Price Action Tools:
Pivot Points - Automatic detection of swing highs/lows with labels
Support & Resistance MTF - Multi-timeframe S/R zones with breakout tracking
Gap Detector - Identifies and labels price gaps with pip measurements
📈 Daily Reference Levels:
Today's High/Low with real-time updates
Yesterday's High/Low for key reference points
Customizable line extensions and label positioning
💼 Market Information Watermark:
Company name with market cap display
Sector and industry classification
ATR volatility indicator with color-coded alerts (🟢🟡🔴)
Symbol and timeframe information
⚡ Advanced Features:
Show/hide controls for each indicator component
Extensive color and style customization
Multi-timeframe support for S/R levels
Built-in alerts for trend changes and level breaks
Smart label positioning to avoid overlap
Professional watermark with market statistics
🎨 Customization:
Each component can be individually toggled on/off and styled to match your trading preferences. From line widths to colors, label sizes to transparency levels - everything is adjustable.
Perfect for:
Day traders needing quick technical reference points
Swing traders tracking multiple timeframe levels
Position traders monitoring long-term trends
Anyone wanting a clean, professional chart setup
This indicator eliminates the need for multiple separate indicators, providing a complete technical analysis toolkit in one efficient package.

Fibonacci Optimal Entry Zone (By Levi)This is a Fibonacci Optimal Entry Zone indicator for TradingView that combines market structure analysis with Fibonacci retracement levels.
Key Features:
Market Structure Detection
Identifies swing highs/lows using pivot points
Marks "CHoCH" (Change of Character) when structure breaks
Tracks both bullish (higher highs/lows) and bearish (lower highs/lows) structures
Dynamic Fibonacci Retracements
Automatically draws Fibonacci levels between detected swing points
Supports extensive levels from -2.0 to 1.618, including the golden ratio (0.618)
Optional "Golden Zone" highlighting between 0.5-0.618 levels
Visual Elements
Dotted swing trend lines connecting pivots
Price labels at swing points
Customizable Fibonacci level labels with optional price display
Break of Structure (BoS) lines with adjustable styles
Advanced Options
"Swing tracker" mode for real-time Fibonacci adjustments
Line extension controls (left/right/both)
Previous Fibonacci levels retention
Fully customizable colors, widths, and label positioning
The indicator helps traders identify potential entry zones by combining structural breaks with key Fibonacci retracement levels, particularly focusing on the "optimal entry zone" where price often finds support/resistance during retracements.

EMA Cloud 200 High/Close с цветом трендаEMA Cloud 200 High/Close with Trend Color
Overview
This indicator creates a dynamic EMA cloud between two Exponential Moving Averages calculated from different price sources, providing clear visual trend identification and support/resistance zones.
Key Features
Dual EMA System: Upper EMA based on High prices, Lower EMA based on Close prices
Custom Timeframe: Analyze EMA on any timeframe regardless of chart timeframe
Dynamic Trend Coloring: Green for uptrend, Red for downtrend
Visual Cloud: Filled area between EMAs highlights price zones
Configurable Period: Default 200-period EMA (adjustable)
How It Works
The indicator calculates two separate 200-period EMAs:
Upper EMA: Based on High prices - shows resistance levels
Lower EMA: Based on Close prices - shows support levels
Trend Detection:
Current price above average EMA = Green (Bullish)
Current price below average EMA = Red (Bearish)
Trading Applications
Trend Identification: Color changes indicate trend shifts
Support/Resistance: Cloud boundaries act as dynamic S/R zones
Entry/Exit Points: Price interaction with cloud edges
Multi-timeframe Analysis: View higher timeframe EMAs on lower timeframe charts
Settings
EMA Period: Adjust calculation period (default: 200)
Top Source: Price source for upper EMA (default: High)
Bottom Source: Price source for lower EMA (default: Close)
Custom Timeframe: Choose analysis timeframe (default: 15min)
Best Practices
Use on trending markets for optimal results
Combine with other indicators for confirmation
Higher timeframes provide stronger signals
Cloud thickness indicates volatility levels
Perfect for swing traders and trend followers seeking clear visual trend analysis with dynamic support/resistance identification.

CLMM Vault策略回测 (专业版) v5Explanation of the CLMM (Concentrated Liquidity - Market Maker) Strategy Backtesting Model Developed for the Sui Chain Vaults Protocol
Why Are We Doing This?
Conducting strategy backtesting is a crucial step for us to make data-driven decisions, validate the feasibility of strategies, and manage potential risks before committing real funds and significant development resources. A strategy that appears to have a high APY may perform entirely differently once real-world frictional costs (such as rebalancing fees and slippage) are deducted. The goal of this backtesting model is to quickly and cost-effectively identify which strategy parameter combinations have the potential to be profitable and which ones pose risks before formal development, thereby avoiding significant losses and providing data support for the project's direction.
Core Features of the Backtesting Model
We have built a "pro version" (v5) strategy simulator using TradingView's Pine Script. It can quickly simulate the core performance of our auto-compounding and rebalancing Vaults on historical price data, with the following main features:
Auto-Compounding: Continuously adds the generated fee income to the principal based on the set profit range (e.g., 0.01%).
Auto-Rebalancing: Simulates automatic rebalancing actions when the price exceeds the preset profit range and deducts the corresponding costs.
Smart Filtering Mechanism: To make the simulation closer to our ideal "smart" decision-making, it integrates three freely combinable filtering mechanisms:
Buffer Zone: Tolerates minor and temporary breaches of the profit range to avoid unnecessary rebalancing.
Breakout Confirmation: Requires the price to be in the trigger zone for N consecutive candles to confirm a breakout, filtering out market noise from "false breakouts."
Time Cooldown: Enforces a minimum time interval between two rebalances to prevent value-destroying high-frequency trading in extreme market conditions.
Important: Simplifications and Assumptions of the Model
To quickly prototype and iterate on the TradingView platform, we have made some key simplifications to the model.
A fully accurate backtest would require a deep simulation of on-chain liquidity pools (Pool Pair), calculating the price impact (Slippage) and impermanent loss (IL) caused by each rebalance on the pool. Since TradingView cannot access real-time on-chain liquidity data, we have made the following simplifications:
Simplified Rebalancing Costs: Instead of simulating real transaction slippage, we use a unified input parameter of single rebalance cost (%) to "bundle" and approximate the total of Gas fees, slippage, and realized impermanent loss.
Simplified Fee Income: Instead of calculating fees based on real-time trading volume, we directly input an average fee annualized return (%) as the core income assumption for our strategy.
How to Use and Test
Team members can load this script and test different strategies by adjusting the input parameters on the panel. The most critical parameters include: position profit range, average fee annualized return, single rebalance cost, and the switches and corresponding values of the above three smart filters.

Panel | Tablo + SMAOSC & Ortalama + Momentum + 4H MTF - STRATEJIMulti-Indicator Strategy Panel – SMAOSC, Momentum & 4H MTF
Overview
This is a custom strategy script that combines several technical indicators such as:
CCI, RSI, Stochastic, OBV, IFT, Momentum, SMA Oscillator
Includes multi-timeframe analysis (4H) for added reliability.
Uses dynamic signal classification with thresholds (e.g., 0.10–0.90 levels).
Comes with risk control via a max drawdown limit (20%).
Logic
The script produces LONG, SHORT, or NONE positions based on a combined normalized score calculated from all indicators.
Drawdown and threshold-based checks are applied to avoid risky trades.
Important Note
This indicator is still in testing phase.
It is not financial advice and should be used with caution and demo environments before real trading.

Liquidity Rush:VSMarkettrend Liquidity Rush (LR) Indicator – Market Move Detector
🔍 What is Liquidity Rush?
The Liquidity Rush (LR) indicator detects the flow of big money (institutional or high-volume traders) into a stock over a selected time frame. It visually represents the net liquidity inflow/outflow and compares it with the stock's total market capitalization (MC) to give you a contextual view of its significance.
📊 Indicator Output:
You’ll see a label like:
250.07 Cr / 0.23%MC
250.07 Cr → Liquidity change (buy/sell impact) in the selected timeframe.
0.23%MC → This liquidity is 0.23% of the stock’s market cap.
This helps you judge:
Whether the move is impactful or just noise.
If smart money is likely entering or exiting.
⚠️ Why % of Market Cap?
Volume or liquidity alone doesn't tell the full story. 100 Cr inflow in a 5,000 Cr company is significant (2%), but the same in a 50,000 Cr company is not impactful (0.2%). That’s why this indicator shows LR as a % of MC — to give you contextual importance.
🟢 When is it Powerful?
If LR % > 2% of market cap consistently → Strong entry signals likely from big players.
If LR jumps suddenly after a dull phase → Watch for breakout or reversal.
🎨 Color Coding (Based on Liquidity Amount):
<10 Cr → Low (likely retail-driven)
>10–20 Cr → Moderate (watchful)
>20–100 Cr → Heating up
>100 Cr → High liquidity activity (possible institutional move)
📅 Best Timeframes:
Use it on Daily, Weekly for quick flow detection.
Combine with price action or volume for confirmation.
Use Cases:
Identify breakouts with backing.
Filter fake moves with weak liquidity.
Spot smart money entry before price jumps.
Note : It does not means that stock with low LR are bad and not move, many stock move with low LR also, This indicator need not to be used in isolation.

Red Report Filter x 'Bull_Trap_9'Hello Traders!
This one is my favorite.
This is indicator / filter: '2 of 2.'
'1 of 2' is the, 'Closed Market Filter,' I posted before this that you may like.
Again, I prefer 'Filter' over 'Indicator' because this Pine Script code does not interact with the actual price data.
It makes handling high impact reports effortless.
As you all know; if you're on a Prop and breach a 'Red,' you lose your account.
This will filter up to 5 reports. More than enough unless you're on EURUSD!
It offers both 'Red' and 'Orange' report control.
The default window times of 15 / 6 are programmed for red events. You can always alter the base code for your desired, 'Before / After.'
Click the tooltip for more info.
How to use:
You do need to update the inputs daily with the current report times before each open.
I trade YM / US markets. Those reports are very repetitive on their delivery times, so I usually leave a 10:00 setting in slot 1. I then toggle it 'On' or 'Off' per demand.
Just open the dialogue box and it is pretty self explanatory.
I used task scheduler for a lot of years, but that wasn't very reliable, modest work to set up daily and a lot of times I may not hear it or it malfunctions because of a Windows update.
TradingView has the little icon that floats from the bottom right, but who really looks for that.
Any audio alert is subject to fail for a number of reasons.
This filter REDS the screen in your face. Leaves no doubt about what's coming.
I know there may be other apps and options out there, but this filter is integral to the TradingView chart itself embedded through Pine Script. It is right there, a click away, easy to input data, and as long as your chart is active and working, the filter will fire.
I did not build an alert condition into this, but I'm sure that could be an option if you want to program in audio as well.
Please Note: Only when the price candles push into the filter zone, will the filter start to display. Run a test a minute from the current price candle and you can see how it functions.
I appreciate your interest.

EMA Crossover + RSI Confirmation (Buy/Sell)Updated version for EMA crossover stategy with RSI confirmation

EMA Crossover + RSI Confirmation (Buy/Sell)This indicator provides buy and sell signals based on EMA9 and EMA21 crossover with confirmation from RSI

Scalp BeastScalp Beast V1 — Strategy Summary
High-frequency scalping strategy tailored for volatile assets (GOLD, NAS100, EURUSD), optimized for M1 to M15.
Blends trend filtering, RSI confirmation, and strict risk control with a fixed 1:2 R:R (risk €30 / reward €60).
Entry conditions:
• Bullish: EMA 50 > EMA 200 → BUY if RSI < 50
• Bearish: EMA 50 < EMA 200 → SELL if RSI > 50
• ⏱ 5-bar spacing between trades
Visuals:
• BUY/SELL shown on exact candles
• TP/SL shown with clean price-level lines
• Fully dynamic — no frozen elements
Best for:
• M1 / M5 / M15
• Fast, clear, rule-based scalping
—
Created by Wawa | “Scalp Beast” Series ⚔️

Previous 2 Days High/LowCan you give me a summary of this indicator
The "Previous 2 Days High/Low" indicator, written in Pine Script v5 for TradingView, plots horizontal lines representing the combined high and low prices of the previous two trading days on a chart. Here's a summary of its functionality, purpose, and key features:
Purpose
The indicator helps traders identify significant price levels by displaying the highest high and lowest low from the previous two days, which can act as potential support or resistance levels. These levels are plotted as lines that extend across the current trading day, making it easier to visualize key price zones for trading decisions.
Key Features
Calculates Combined High and Low:
Retrieves the high and low prices of the previous day and the day before using request.security on the daily timeframe ("D").
Computes the combined high as the maximum of the two days' highs and the combined low as the minimum of the two days' lows.
Dynamic Line Plotting:
Draws two horizontal lines:
Red Line: Represents the combined high, plotted at the highest price of the previous two days.
Green Line: Represents the combined low, plotted at the lowest price of the previous two days.
Lines are created at the start of a new trading day and extended to the right edge of the chart using line.set_x2, ensuring they span the entire current day.
Labels for Clarity:
Adds labels to the right of the chart, displaying the exact price values of the combined high ("Combined High: ") and combined low ("Combined Low: ").
Labels are updated to move with the lines, maintaining alignment at the current bar.
Clutter Prevention:
Deletes old lines and labels at the start of each new trading day to avoid overlapping or excessive objects on the chart.
Dynamic Requests:
Uses dynamic_requests=true in the indicator() function to allow request.security calls within conditional blocks (if ta.change(time("D"))), enabling daily data retrieval within the script's logic.
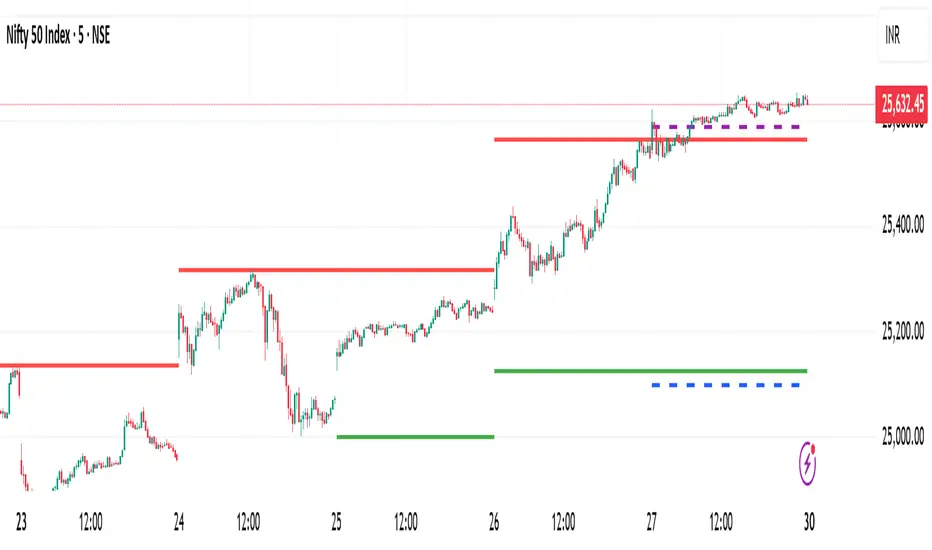
Rapid HTF Price Action Dashboard V2.0Rapid HTF Price Action Dashboard V2.0
Overview
Stop the constant switching between timeframes. The Rapid HTF Price Action Dashboard is an all-in-one analysis suite designed to give you a crystal-clear view of the market's true intent by projecting critical higher-timeframe (HTF) data directly onto your trading chart.
This tool is more than just a pattern indicator; it's a complete dashboard that provides institutional-grade insights into price action. It helps you anticipate market moves by showing you where liquidity lies and how the bigger players are positioning themselves, all from the comfort of your lower-timeframe chart.
Key Features
Multi-Timeframe Dashboard: A clean, intuitive panel on the right of your chart displays the last two closed higher-timeframe candles (Candle A & B) and the live, developing one (Candle C).
Projected HTF Levels: Automatically draws and projects the previous HTF candle's high and low across your chart, acting as critical dynamic support and resistance levels.
Advanced Pattern Recognition: Identifies seven high-conviction candlestick patterns based on our proprietary filtering system, designed to eliminate noise and pinpoint only the most potent signals.
The Logic: Why Our Signals Are More Accurate
This indicator goes far beyond textbook definitions. We don't just look for shapes; we look for the story behind the price action. Each pattern is filtered through a rigorous set of conditions to ensure it represents true market conviction.
Hammers & Inverted Hammers: The Liquidity Grab
Classic Hammer/IH patterns are often misleading. Ours are different. We identify them as true liquidity grab signals, a core concept used in ICT (Inner Circle Trader) methodologies.
A Hammer (H) is only valid if its low wick has pierced below the low of the previous candle (low < low ). This signifies a "stop hunt" where liquidity was absorbed below a key level before buyers aggressively pushed the price up.
An Inverted Hammer (IH) is only valid if its high wick has pierced above the high of the previous candle (high > high ). This shows liquidity was taken above a prior high before sellers took control and suppressed the price.
Harami: Filtering for Conviction
A classic Harami (an inside bar) can often just be a weak doji, signaling indecision. We filter this noise out.
Our Harami signal (BeH, BuH) requires the inside candle to have a meaningful body (defaulting to 30% of its own range, but fully customizable).
Furthermore, we have enhanced the logic to ensure the body of the inside candle is strictly contained within the body of the previous candle, making it a more precise and reliable signal of consolidation before a potential expansion.
Power Engulfing: A Signal of Overwhelming Force
We don't flag just any engulfing candle. We look for true displacement and momentum.
Our Power Engulfing pattern (BE, BuE) requires the body of the current candle to completely engulf the body of the previous candle.
Crucially, it must also close decisively beyond the entire range (including the wick) of the previous candle. A Bullish Engulfing must close above the previous high, and a Bearish Engulfing must close below the previous low. This confirms overwhelming force has entered the market and a reversal is highly probable.
How to Use the Dashboard
Set Your Reference Timeframe (refTF): Choose the higher timeframe you want to analyze (e.g., "240" for 4-Hour).
Identify the Narrative: Use the projected High/Low lines as your key support and resistance zones. A primary strategy is to wait for price to interact with these levels.
Anticipate the Draw on Liquidity: Watch as price approaches the previous HTF high or low. The dashboard helps you predict the market's next move. For example, if price is trading below the previous HTF low, you can anticipate a potential sweep of that level.
Confirm with a Signal: When a signal like a Hammer (H) appears on the dashboard after sweeping the previous low, it provides high-conviction confirmation that liquidity has been taken and price is ready to reverse.

Vertical Lines at 8AM, 9AM, 8PM & 9PMVertical lines at 8am, 8pm, 9am and 9pm on SGT. Vertical lines at 8am, 8pm, 9am and 9pm on SGT. Vertical lines at 8am, 8pm, 9am and 9pm on SGT. Vertical lines at 8am, 8pm, 9am and 9pm on SGT. Vertical lines at 8am, 8pm, 9am and 9pm on SGT. Vertical lines at 8am, 8pm, 9am and 9pm on SGT. Vertical lines at 8am, 8pm, 9am and 9pm on SGT. Vertical lines at 8am, 8pm, 9am and 9pm on SGT. Vertical lines at 8am, 8pm, 9am and 9pm on SGT. Vertical lines at 8am, 8pm, 9am and 9pm on SGT. Vertical lines at 8am, 8pm, 9am and 9pm on SGT. Vertical lines at 8am, 8pm, 9am and 9pm on SGT. Vertical lines at 8am, 8pm, 9am and 9pm on SGT. Vertical lines at 8am, 8pm, 9am and 9pm on SGT. Vertical lines at 8am, 8pm, 9am and 9pm on SGT. Vertical lines at 8am, 8pm, 9am and 9pm on SGT. Vertical lines at 8am, 8pm, 9am and 9pm on SGT. Vertical lines at 8am, 8pm, 9am and 9pm on SGT. Vertical lines at 8am, 8pm, 9am and 9pm on SGT. Vertical lines at 8am, 8pm, 9am and 9pm on SGT. Vertical lines at 8am, 8pm, 9am and 9pm on SGT. Vertical lines at 8am, 8pm, 9am and 9pm on SGT.

ORB Screener-Multiple Indicators [Marin adjusted]ORB screener for multiple instruments. it needs just the customization of time/ timezone.

Closed Market / Back-Test Filter x 'Bull_Trap_9'Hello TradingView Traders!
This is a very valuable tool that I believe all traders will find useful.
This indicator / filter is '1 of 2'. I prefer it as a filter because it is not meant for live trade analysis. It is designed to make a trader aware of their individual trade sessions and to help aid in static chart candlestick back-testing.
Also, look for my indicator / filter, '2 of 2': 'Red Report Filter'
There are two functions to this filter.
Primary use: It allows a trader to set a session window: Open / Close.
During a trade session, like YM, I only trade 9:30 - 15:00. Without the filter, many times I have traded past my cutoff because I was focused on the chart and not the time.
With this filter on as close nears with an open trade and the filter starts to apply, I know I am at session close with no more trades upon exit. Otherwise, I know the session is done with no further trades.
It is also nice to have the filter on during the session open as a demarcation boundary.
Secondary use: It is used as a chart back-test tool.
When applied to a traders back-test chart, the trader can control their trade session envelopes for easier and more precise evaluation. The filter will allow only the candles per session that the trader wants to focus on and will filter all other non-session candles.
I can easily compare a whole week of 30m session data, concentrating solely on the filtered trade windows.
Please Note: The filter will be active as far back as the historic data prints.
Thanks for viewing!

High Power CandlesThis indicator provides information about the strength of the candles in favor of the trend, following the logical meaning: green (rising force), yellow (little force), red (downward force)
