ZYTX CCI SuperTrendZYTX CCI SuperTrend
The definitive integration of CCI and SuperTrend trend-following indicators, delivering exemplary performance in automated trading bots.
Indicators and strategies

Market Structure by HorizonAIThis indicator shows SMC market strcuture and mapping BOS, CHoCH with full precise accuracy.

ZYTX SuperTrend V1ZYTX SuperTrend V1 Indicator
Multi-strategy intelligent rebalancing with >95% win rate
Enables 24/7 automated trading

ZYTX GKDDThe ZYTX High-Sell Low-Buy Indicator Strategy is a trend-following indicator that integrates multiple indicator resonances. It demonstrates the perfect performance of an automated trading robot, truly achieving the high-sell low-buy strategy in trading.

Phase D Sniper (Full Upgrade v1)Personal script that I wrote for myself to find the Phase C ending and beginning of the Phase D of Wyckoff Pattern. This script identifies potential entry points buy signaling a buy with Green Triangle, Orange Circles are entry points in case you missed the initial green triangle entry. The Blue Diamonds indicate Bullish Divergeance.

Dynamic Candle Strength Color + SL Zones (Clean)Shows Sl levels and candles that are larger than your SL

15-Min ORB Indicator with Breakout Targets **What this indicator does:**
The 15-Min ORB (Opening Range Breakout) Indicator helps traders spot breakout trades by automatically detecting the high and low of the first 15 minutes after a session opens. It then monitors for breakouts above or below this range and plots dynamic take-profit levels based on your chosen multipliers.
**How it works:**
You set the start time for your session (hour and minute) in the settings.
The indicator marks the high and low during the first 15 minutes after your chosen open time, drawing lines on the chart and, if enabled, labels for these levels.
If price breaks above the 15-min high, a potential long breakout is identified; if it breaks below the low, a potential short breakout is detected.
Upon a breakout, the script calculates the distance from the entry (breakout) to the opposite side of the 15-min range and uses your input multipliers to project two take-profit levels (TP1/TP2).
All lines and labels (for the range and targets) can be individually toggled on or off in the settings.
Both the 15-min range and the targets can be styled (color, line style, label position).
**How to use it:**
Add the indicator to your chart.
Set the session start hour and minute to match your instrument’s open (e.g., 9:30 for US stocks or futures).
Use the settings to customize which levels and labels are shown, their appearance, and the target expansion multiples.
When price breaks out above or below the opening range, the script will plot TP1 and TP2 lines at your chosen risk/reward multiples, and label them if desired.
You can use the visual levels for trade entries, profit taking, or alerts.
**What makes it unique and useful:** >
Unlike many basic ORB indicators, this script not only marks the opening range but also tracks breakouts, auto-plots your profit targets based on range expansion, and gives you full control over display (styles, toggles, and label positions).
The TP targets are dynamic and can be set to any multiples, adapting to your risk/reward plan and breakout style.
Everything is customizable for your own session times, instrument, or trading approach.
**Typical uses:**
Intraday traders looking for clear breakout setups around the session open.
Automated R-multiple target planning for both long and short trades.
Visualizing volatility and measuring early price expansion.

MEAN X VIBRATION(dynammic)This is a base example for using mean reversion in trading. the probability of sellers coming in on the 1.9-2.4 band is highly likely . use 1.2-0.9 as a smaller vibration.
key note universal laws are used in this. those who can see will see.

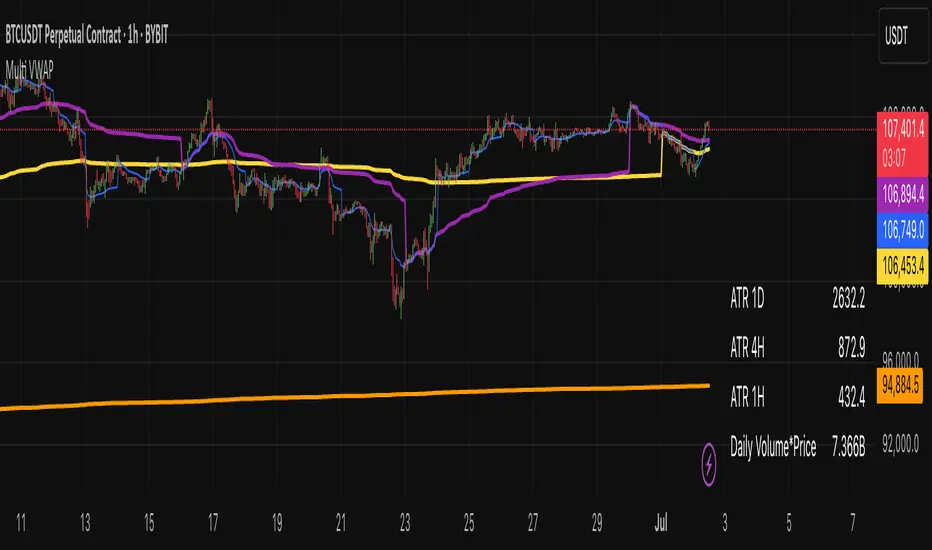
Multi VWAP indicatorMulti VWAP – Advanced Volume-Weighted Average Price Tool
The Multi VWAP indicator is a powerful tool for traders who use volume-based price analysis to find high-probability trade levels. It plots multiple VWAPs across different timeframes and key market anchors to give a deeper view of market structure and value.
Features:
Multi-Timeframe VWAPs: Displays VWAPs for the Year, Month, Week, and Day – giving you an instant overview of where price is trading relative to its volume-based average over time.
Anchored VWAPs from Yearly High/Low: Automatically anchors VWAP to the Yearly High and Yearly Low – these levels often act as dynamic support and resistance, making them excellent reference points for both entries and exits.
ATR Levels: Optional display of Average True Range (ATR) on Daily, 4-Hour, and Hourly timeframes – useful for volatility assessment and risk management.
Volume × Price Analysis: Includes an option to show Volume × Price for the previous day, which is especially helpful when trading low-liquidity cryptocurrencies or small-cap stocks, where volume has a stronger influence on price.
The Multi VWAP indicator is ideal for traders who want a layered, volume-driven perspective of the market. It helps identify key support and resistance levels, track market sentiment shifts, and improve timing across different trading styles.
Warrior Trading Momentum Strategy
# 🚀 Warrior Trading Momentum Strategy - Day Trading Excellence
## Strategy Overview
This comprehensive Pine Script strategy replicates the proven methodologies taught by Ross Cameron and the Warrior Trading community. Designed for active day traders, it identifies high-probability momentum setups with strict risk management protocols.
## 📈 Core Trading Setups
### 1. Gap and Go Trading
- **Primary Focus**: Stocks gapping up 2%+ with volume confirmation
- **Entry Logic**: Breakout above gap open with momentum validation
- **Volume Filter**: 2x average volume requirement for quality setups
### 2. ABCD Pattern Recognition
- **Pattern Detection**: Automated identification of classic ABCD reversal patterns
- **Validation**: A-B and C-D move relationship analysis
- **Entry Trigger**: D-point breakout with volume confirmation
### 3. VWAP Momentum Plays
- **Strategy**: Entries near VWAP with bounce confirmation
- **Distance Filter**: Configurable percentage distance for optimal entries
- **Direction Bias**: Above VWAP bullish momentum validation
### 4. Red to Green Reversals
- **Setup**: Reversal patterns after consecutive red candles
- **Confirmation**: Volume spike with bullish close required
- **Momentum**: Trend change validation with RSI support
### 5. Breakout Momentum
- **Logic**: Breakouts above recent highs with volume
- **Filters**: EMA20 and RSI confirmation for quality
- **Trend**: Established momentum direction validation
## ⚡ Key Features
### Smart Risk Management
- **Position Sizing**: Automatic calculation based on account risk percentage
- **Stop Loss**: 2 ATR-based stops for volatility adjustment
- **Take Profit**: Configurable risk-reward ratios (default 1:2)
- **Trailing Stops**: Profit protection with adjustable triggers
### Advanced Filtering System
- **Time Filters**: Market hours trading with lunch hour avoidance
- **Volume Confirmation**: Multi-timeframe volume analysis
- **Momentum Indicators**: RSI and moving average trend validation
- **Quality Control**: Multiple confirmation layers for signal accuracy
### PDT-Friendly Design
- **Trade Limiting**: Built-in daily trade counter for accounts under $25K
- **Selective Trading**: Priority scoring system for A+ setups only
- **Quality over Quantity**: Maximum 2-3 high-probability trades per day
## 🎯 Optimal Usage
### Best Timeframes
- **Primary**: 5-minute charts for entry timing
- **Secondary**: 1-minute for precise execution
- **Context**: Daily charts for gap analysis
### Ideal Market Conditions
- **Volatility**: High-volume, momentum-driven markets
- **Stocks**: Market cap $100M+, average volume 1M+ shares
- **Sectors**: Technology, biotech, growth stocks with news catalysts
### Account Requirements
- **Minimum**: $500+ for proper position sizing
- **Recommended**: $25K+ for unlimited day trading
- **Risk Tolerance**: Active day trading experience preferred
## 📊 Performance Optimization
### Entry Criteria (All Must Align)
1. ✅ Time filter (market hours, avoid lunch)
2. ✅ Volume spike (2x+ average volume)
3. ✅ Momentum confirmation (RSI 50-80)
4. ✅ Trend alignment (above EMA20)
5. ✅ Pattern completion (setup-specific)
### Risk Parameters
- **Maximum Risk**: 1-2% per trade
- **Position Size**: 25% of account maximum
- **Stop Loss**: 2 ATR below entry
- **Take Profit**: 2:1 risk-reward minimum
## 🔧 Customization Options
### Gap Trading Settings
- Minimum gap percentage threshold
- Volume multiplier requirements
- Gap validation criteria
### Pattern Recognition
- ABCD ratio parameters
- Swing point sensitivity
- Pattern completion filters
### Risk Management
- Risk-reward ratio adjustment
- Maximum daily trade limits
- Trailing stop trigger levels
### Time and Session Filters
- Trading session customization
- Lunch hour avoidance toggle
- Market condition filters
## ⚠️ Important Disclaimers
### Risk Warning
- **High Risk**: Day trading involves substantial risk of loss
- **Capital Requirements**: Only trade with risk capital
- **Experience**: Strategy requires active monitoring and experience
- **Market Conditions**: Performance varies with market volatility
### PDT Considerations
- **Day Trading Rules**: Accounts under $25K limited to 3 day trades per 5 days
- **Compliance**: Strategy includes trade counting for PDT compliance
- **Alternative**: Consider swing trading modifications for smaller accounts
### Backtesting vs Live Trading
- **Slippage**: Real trading involves execution delays and slippage
- **Commissions**: Factor in broker fees for accurate performance
- **Market Impact**: Large positions may affect fill prices
- **Psychological Factors**: Live trading involves emotional challenges
## 📚 Educational Value
This strategy serves as an excellent learning tool for understanding:
- Professional day trading methodologies
- Risk management principles
- Pattern recognition techniques
- Volume and momentum analysis
- Multi-timeframe analysis
## 🤝 Community and Support
Based on proven Warrior Trading methodologies with active community support. Strategy includes comprehensive plotting and information tables for educational purposes and trade analysis.
---
**Disclaimer**: This strategy is for educational purposes. Past performance does not guarantee future results. Always practice proper risk management and never risk more than you can afford to lose.
**Tags**: #DayTrading #Momentum #WarriorTrading #GapAndGo #ABCD #VWAP #PatternTrading #RiskManagement

Modüler Trailing Stop (Doğru Ölçekli)
📌 Modular Trailing Stop – Advanced Risk Management for Long & Short Strategies
Modular Trailing Stop is a dual-direction stop management tool that calculates independent stop levels for long and short positions. It is fully scale-adjusted, strategy-agnostic, and optimized for TradingView integration.
🚀 Key Features
🔹 Dual-Side Stop Logic
Separate Ref High and Stop levels for long and short trades, allowing precise and directional control.
🔹 Modular Architecture
Designed to be easily integrated into any indicator or strategy. Operates independently from entry signals.
🔹 Accurate Price Scaling
Automatically adjusts to symbol tick size using syminfo.mintick, ensuring precision across all markets (BTCUSD, ETHUSD, USDTRY...).
🔹 Static Trailing Logic
Once a position is opened, stop levels are anchored to a fixed reference price and adjusted by ATR volatility.
🔹 User-Configurable
- Customizable ATR period and multiplier
- Manual reference high percentages for long and short
- Real-time table display on the chart with key values
⚙️ Calculation Formulas
- Ref High (Long) = Base Price × (1 + %Offset) × scaleFix
- Ref High (Short) = Base Price × (1 - %Offset) × scaleFix
- Step = ATR × Multiplier
- Long Stop = Ref High (Long) – Step
- Short Stop = Ref High (Short) + Step
📈 Use Cases
- Volatility-based static stop-loss framework
- Compatible with RSI, EMA crossover, breakout, and custom signal systems
- Backtesting via TradingView Strategy Tester (WinRate, Sharpe, AvgPnL...)
🧪 Example Backtest (BTCUSDT, 4H Timeframe)
- Win Rate: 41.9%
- Sharpe Ratio: 0.27
- Profit Factor: 1.31
- Avg Trade Duration: 18 bars
- Test Strategy: RSI-based entries + modular trailing stops
🧩 Strategy Integration (Sample)
strategy.exit("Long Exit", from_entry="Long", stop=longStop)
strategy.exit("Short Exit", from_entry="Short", stop=shortStop)
🏁 Summary
Modular Trailing Stop is a robust and intuitive stop-loss management tool. It can be used as a standalone module or combined with any strategy for improved position handling, effective drawdown control, and systematic risk management.
Whether you're building strategies or optimizing entries and exits, this tool brings precision and modular flexibility to your trading workflow.

FORTIS80 - Monday's Range SignalThis TradingView indicator by Fortis80 displays Monday’s high and low range across all timeframes, helping traders easily identify key weekly levels. The customizable display allows you to show ranges from the past 1 to 24 weeks.

Custom Bar countBar Count indicator with custom Open Market Time
Editable in settings using Exchange Time
please leave comment if any questions

BTC 4H Entrées/SortiesAnalysis: Input and output this script was created by ChatGPT. I allow myself to use this artificial intelligence, in order to find the most precise entry points and exit points possible in order to generate profits in complete transparency with you.


Mega Rise
The Mega Rise indicator helps you find entry points for buying and selling. It uses several indicators and its own algorithm to analyze the market.
It works on any timeframe and any currency pair.
Индикатор Mega Rise помогает найти точки входа для покупки и продажи. Для анализа рынка он использует несколько индикаторов, а также свой алгоритм.
Работает на любом таймфрейме и любой валютной паре.

GrowthX 365📌 GrowthX 365 — Adaptive Crypto Strategy
GrowthX 365 is a precision-built Pine Script strategy designed for crypto traders who want hands-off, high-frequency execution with clear, consistent logic.
It adapts dynamically to market volatility using multi-timeframe filters and manages exits with a smart 3-tier take-profit and stop-loss system.
Built for automation, GrowthX 365 helps eliminate emotional decision-making and gives traders a rules-based, 24/7 edge across major crypto pairs.
⚙️ Core Features:
• ✅ Multi-timeframe, non-repainting trend confirmation
• ✅ Configurable TP1 / TP2 / TP3 + Fixed SL
• ✅ Trailing stop & risk-reward tuning supported
• ✅ On-chart labels, trade visuals & stat dashboard
• ✅ Fully compatible with Cornix, WunderTrading, 3Commas bots
• ✅ Works in trending, ranging, and volatile markets
🧪 Strategy Backtest Highlights (May 2025)
🔹 EIGEN/USDT — 15m Timeframe
• Net Return: +318%
• Drawdown: $35 (3.5%)
• Trades: 247
• Win Rate: 49%
📸 Screenshot: ibb.co
🔹 AVAX/USDT — 15m Timeframe
• Net Return: +108%
• Drawdown: $22.5 (2.25%)
• Trades: 115
• Win Rate: 49%
📸 Screenshot: ibb.co
🧪 Backtest settings used:
Capital: $1000 • Risk per trade: $100 • Slippage: 0.1% • Commission: 0.04%
📌 These results reflect one-month performance. Strategy has shown similar behavior across coins like SOL, INJ, and ARB in trending markets.
⚠️ Backtest performance does not guarantee future results. Always validate settings per coin and timeframe.
Access:
This script is invite-only and closed-source.
Please check my profile signature for access details.

FVG AlertsDescription
FVG Alerts is an indicator that can send alerts as soon as a Fair Value Gap (FVG) gets closed. This is especially useful when you have already identified a Market Structure Shift (MSS) but are still waiting for a valid FVG to form. Instead of constantly monitoring the charts, this tool ensures you don’t miss any opportunities – even when you’re busy.
This indicator works on any symbol and any timeframe.
The notification is sent after an FVG has been confirmed by a candle close.
Display Settings
The indicator marks confirmed FVGs using triangles:
• Bullish FVGs appear below the candle
• Bearish FVGs appear above the candle
You can change the color of these triangles in the settings.
If you prefer a cleaner chart, it is recommended to make them fully transparent.
Important: Do not disable the plots entirely, as they are required for the indicator to function correctly.
How to Set an Alert
1. Open the desired chart and set your preferred timeframe
2. Click “Alert” in the top menu
3. As the Condition, select:
• FVG Alerts
• Choose either Bullish FVG closed or Bearish FVG closed
4. Leave the Interval as “Same as chart” or adjust it as needed
5. Click Create
The alert will trigger as soon as an FVG is closed (confirmed by candle close).
Support
If you encounter any issues or have questions, feel free to contact me:
Discord: tkey267

Vector CandlesSimple buy and sell alert on vectors. Works well on 4h. Standard settings are 70% candle must be body, with min 1.5 vol on the candle on 20 ma loopback.
