Indicators and strategies

***FOREX PILOT PRO STRATEGY INVITE SCRIPT***This Script Is Purely Created For Forex Trading XAUUSD Pair In 3 Mins Time Frame. This Script Tells When To Buy And Sell With Stop Loss, Take Profit Levels 1, 2 & 3.

Volume Change Price NATR Correlation BTC by vadimka77712Volume Change Price NATR Correlation BTC by vadimka77712

rsi living signal v1 7/1
rsi 지표를 바탕으로 만들어서 상승다이버 하락다이버 등을 눈으로 직접 확인할수 있고
그외 몇가지 지표를 추가 적용하여
과매도 과매수 구간에서 세력이나 고래의 움직임을 포착하여
매수 매도 시그널을 생성시켜주며
단기 차트 5분봉부터 4시간 스윙까지 사용해볼수 있는 보조지표로써
상승의 끝을 알수없는 흐름과 하락의 끝을 알수없는 구간에서
돈많은 세력들의 시그널을 이용해서 천장과 바닥을 예상해볼수 있도록 제작
지지 저항 오더블록 지표등과 함께
엘리어트 파동카운팅과 결합하여 사용한다면
최상의 시너지 효과가 날것으로 예상합니다.
Based on the RSI indicator, you can directly check rising and falling divers with your own eyes, and
by applying several other indicators,
it captures the movements of forces or whales in the overbought and oversold sections,
and generates buy and sell signals.
As an auxiliary indicator that can be used from 5-minute charts to 4-hour swings,
it was created so that you can predict the ceiling and floor using the signals of the forces with a lot of money in the sections where the upward trend has no end and the downward trend has no end.
If used in combination with Elliott Wave Counting, along with support resistance order block indicators, etc., the best synergy effect is expected.

Daily/Weekly/Monthly Levels as per INDVIX By Biswaranjan_MDescription: This indicator dynamically draws Daily, Weekly, and Monthly range levels based on the INDIAVIX volatility index. It helps traders visualize potential price zones derived from market volatility and trend behavior.
Note: The indicator dynamically pulls the INDIAVIX value for the previous day and the previous day close of Index (Nifty 50/Bank Nifty/Sensex etc.), then calculates the daily/weekly/monthly ranges as per the user input and draws the levels on the chart as support and resistance.
Key Features:
1. INDIAVIX-Based Range Levels
Calculates projected range levels using the current or past INDIAVIX value, combined with the closing price of the stock or index.
2. Timeframe Flexibility
Choose to display Daily, Weekly, or Monthly levels — each derived from either:
- Today’s close and INDIAVIX, or
- Previous Week/Month close with the corresponding historical INDIAVIX value.
3. Historical Context Mode
Toggle historical mode to project how past levels would have looked using actual INDIAVIX values at the time.
Additional Tools:
* Day Open Line – Marks the opening price of the current trading day.
* Option to add 4 EMAs/SMAs – Moving average for trend following.
* VWAP – Volume-Weighted Average Price for intraday bias and mean reversion analysis.
* Open Range - This option plots the Open Range Box based on the first N minutes of the trading session (e.g., 15, 30, or 60 minutes) and automatically extends the range zone across the entire intraday session up to 3:30 PM.
It is designed for intraday traders, particularly those trading NSE stocks, F&O scripts, and index futures, but works globally on any market with regular intraday sessions.
This all-in-one tool gives you a volatility-informed structure for understanding intraday and positional market dynamics. Designed for any equity/index where INDIAVIX relevance applies.
Release Notes:
In this release, added an option to include a mid level between support and resistance levels.
This mid level option can be enabled or disables from indicators Input tab
Release Notes:
Just rounding down the IndiaVix number.
Release Notes:
Removed the Zero-Lag EMAs and added 4 Moving options to the indicator.
Release Notes:
Added ORB Range to this indicator
Release Notes:
Increased the support and resistance levels from maximum 5 to 10. No other changes to the indicator.

Candle Streak 5 mints This is a free indicator for GOLD on 5 minutes Timeframe
This will give you Entry with SL and TP

***FOREX PILOT PRO STRATEGY INVITE SCRIPT***This Script Is Purely Created For Forex Trading XAUUSD Pair In 3 Mins Time Frame. This Script Tells When To Buy And Sell With Stop Loss, Take Profit Levels 1, 2 & 3.

CEO IndicatorCEO Indicator
Liquidity Levels:
PDH / PDL (Previous Day High/Low)
PWH / PWL (Previous Week High/Low)
PMH / PML (Previous Month High/Low)
DO, NYM, WO, TWO, MO (Daily/Weekly/Monthly Opens + True Opens)
Asia Midpoint (0.5) — midline between Asian session high and low
Customization: colors, opacity, line thickness
Trading Sessions:
4H Display: On the 4H timeframe and above, session boxes may appear cluttered or overlapping.
You can disable session display for higher timeframes to keep the chart clean.
Overlap: When Overlap is turned off, sessions will not be drawn on top of each
other — improving visual clarity during overlapping markets (e.g. London + New York).
Supports: Asia, Frankfurt, London, New York, Lunch
Display modes: Box, Streamlined, Fill, High-Low zones
Customized labels
Time zone auto-adjust & custom time zones
Fractals & FVG:
Automatic fractal high/low detection
Displays Fair Value Gaps (FVG) — bullish & bearish

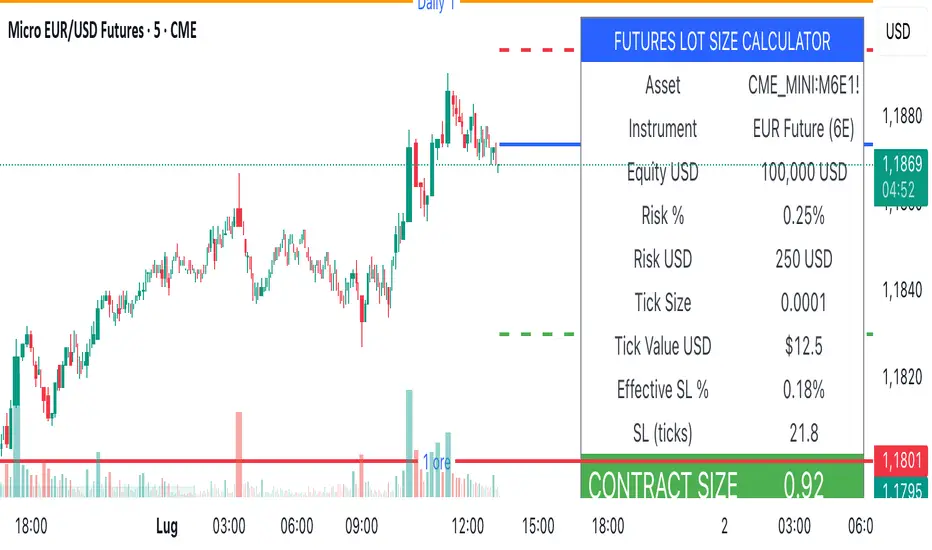
Lot Size Calculator (SL Percentage) - Futures ⚠️ IMPORTANT DISCLAIMER
This indicator is provided for educational and informational purposes only. The author assumes no responsibility for any financial losses, code errors, calculation mistakes, or trading decisions based on this tool. Use at your own risk and responsibility. Always manually verify calculations before opening real positions.
Contract size calculations are based on standard full-size futures contracts, not micro contracts (even though micro contracts are supported for identification).
Description
Money management tool for automatic calculation of optimal contract size (lot size) in futures trading. Supports over 50 futures instruments with pre-configured tick sizes and pip values for CME and other exchanges.
Supported Instruments
Currency Futures: 6J, 6E, 6B, 6A, 6C, 6S, 6N
Index Futures: ES, NQ, YM, RTY, MES, MNQ, MYM, M2K, NKD
Energy: CL, NG, HO, RB, QM
Metals: GC, SI, HG, MGC, SIL
Agricultural: ZC, ZS, ZW, HE, LE, ZO, ZR, ZM, ZL
Interest Rates: ZN, ZB, ZT, ZF
Crypto: MBT, MET
Others: VX
Main Parameters
Equity : Total available capital
Risk : Maximum risk percentage per trade
Stop Loss : Percentage distance of stop loss
Risk/Reward Ratio: Ratio to calculate take profit
Entry Price: Entry price (0 = current price)
Stop Loss Modes
Percentage Stop Loss (Use SL in % = ON):
Automatically calculates SL level as percentage from entry price
Example: Entry 100, SL 2% → Long SL at 98, Short SL at 102
Manual Stop Loss (Use SL in % = OFF):
Enter exact stop loss price directly
Greater precision for specific technical levels (support/resistance)
Interactive feature: You can drag the red stop loss line directly on the chart to modify the level in real-time
How to Use
Set equity and risk % according to your trading plan
Choose direction (Long/Short) and stop loss (percentage or price)
Enter entry price (optional)
Read the CONTRACT SIZE in the green table
Verify levels Entry/SL/TP on the graphic lines
Output
Information table with all parameters and highlighted CONTRACT SIZE
Graphic lines: Entry (blue), Stop Loss (red), Take Profit (green)
Configurable alerts with calculated values
Advantages
✅ Automatic calculation of optimal size
✅ Precise tick sizes for each instrument
✅ Systematic risk management
✅ Clear visual interface
✅ Multi-asset support on futures
Warnings
⚠️ Always verify that the instrument is recognized (no orange warning)
⚠️ Manually check calculations before trading
⚠️ Test in demo before using with real money
⚠️ Update regularly for any contract modifications
⚠️ DISCLAIMER IMPORTANTE
Questo indicatore è fornito esclusivamente a scopo educativo e informativo. L'autore non si assume alcuna responsabilità per eventuali perdite finanziarie, errori nel codice, calcoli errati o decisioni di trading basate su questo strumento. L'utilizzo è a proprio rischio e responsabilità. Si raccomanda di verificare sempre manualmente i calcoli prima di aprire posizioni reali.
I calcoli della dimensione del contratto sono basati su contratti futures standard full-size, non micro contratti (anche se i micro contratti sono supportati per l'identificazione).
Descrizione
Strumento di money management per il calcolo automatico della dimensione ottimale del contratto (lot size) nel trading di futures. Supporta oltre 50 strumenti futures con tick size e pip value pre-configurati per mercati CME e altri exchange.
Strumenti Supportati
Currency Futures: 6J, 6E, 6B, 6A, 6C, 6S, 6N
Index Futures: ES, NQ, YM, RTY, MES, MNQ, MYM, M2K, NKD
Energy: CL, NG, HO, RB, QM
Metals: GC, SI, HG, MGC, SIL
Agricultural: ZC, ZS, ZW, HE, LE, ZO, ZR, ZM, ZL
Interest Rates: ZN, ZB, ZT, ZF
Crypto: MBT, MET
Altri: VX
Parametri Principali
Equity : Capitale totale disponibile
Risk : Percentuale massima di rischio per trade
Stop Loss : Distanza percentuale dello stop loss
Risk/Reward Ratio: Rapporto per calcolare il take profit
Entry Price: Prezzo di entrata (0 = prezzo corrente)
Modalità Stop Loss
Stop Loss Percentuale (Use SL in % = ON):
Calcola automaticamente il livello SL come percentuale dal prezzo di entrata
Esempio: Entry 100, SL 2% → SL Long a 98, SL Short a 102
Stop Loss Manuale (Use SL in % = OFF):
Inserisci direttamente il prezzo esatto dello stop loss
Maggiore precisione per livelli tecnici specifici (supporti/resistenze)
Funzione interattiva: Puoi trascinare direttamente la linea rossa dello stop loss sul grafico per modificare il livello in tempo reale
Come Usare
Imposta equity e risk % secondo il tuo piano di trading
Scegli direzione (Long/Short) e stop loss (percentuale o prezzo)
Inserisci entry price (opzionale)
Leggi il CONTRACT SIZE nella tabella verde
Verifica i livelli Entry/SL/TP sulle linee grafiche
Output
Tabella informativa con tutti i parametri e il CONTRACT SIZE evidenziato
Linee grafiche: Entry (blu), Stop Loss (rosso), Take Profit (verde)
Alert configurabile con i valori calcolati
Vantaggi
✅ Calcolo automatico della size ottimale
✅ Tick size precisi per ogni strumento
✅ Risk management sistematico
✅ Interfaccia visiva chiara
✅ Supporto multi-asset su futures
Avvertenze
⚠️ Verifica sempre che lo strumento sia riconosciuto (no warning arancione)
⚠️ Controlla manualmente i calcoli prima di tradare
⚠️ Testa in demo prima dell'uso con denaro reale
⚠️ Aggiorna regolarmente per eventuali modifiche ai contratti
ICT Sensitive Key Levels [Mariinus]Indicator Overview – Inspired by ICT Concepts
This indicator is inspired by the teachings of Inner Circle Trader (ICT), whose philosophies and principles have greatly shaped the way I view price action. One of the most powerful lessons that stuck with me is his quote:
"All you need is OHLC."
Another fundamental concept that underpins this tool is the idea that:
"Price is constantly moving in cycles from Premium or Discount to Equilibrium, from Equilibrium to Discount to Premium."
With these core ideas in mind, this indicator was developed to help traders who are already using an ICT-based framework. In addition to plotting the standard OHLC levels, the ICT Sensitive Key Levels indicator also includes derived levels that provide deeper Market insight. These include the Equilibrium of the full candle range (High to Low) as well as the Equilibrium of the wicks – offering a more nuanced view of price balance and potential turning points, in line with ICT’s core concepts.
⚠️ Important Disclaimer:
This is not a standalone trading plan.
This is not a buy or sell signal generator.
Instead, this tool is designed to support traders who follow ICT principles by helping them identify higher-probability PD Arrays – the key zones where setups are more likely to occur. If your trading plan includes looking for specific PD Arrays and structural frameworks taught by ICT, then this indicator is a visual aid to refine and focus your attention on the areas where your framework has a higher probability of playing out.
🔁 Backtesting & Daily Preparation
In addition to improving your real-time analysis, this indicator is also a valuable tool for accelerated backtesting . Rather than manually drawing out levels, the indicator automatically provides them, allowing you to analyze past price action faster and more efficiently .
It’s also ideal for preparing your trading day . By loading the indicator before the session starts, you get a clear visual of key levels that may play a role in your strategy. And if you find the chart too cluttered with lines, simply copy the ones that matter to you, draw them manually, and then turn the indicator off to keep your chart clean while keeping your zones intact.
⚙️ Explanation of the Settings
You can combine up to 4 timeframes to monitor their respective levels while operating on a lower timeframe. For each timeframe, you can:
• Set a lookback period to control how far back you want to calculate levels.
• Choose to display or hide the levels of the current candle , which helps you monitor intra-candle ebbs and flows.
Each level (e.g., High, Low, Open, Close, Equilibrium) can be customized:
• Color
• Line style
• Line width
• To hide a level , simply set its opacity to zero.
You can also enable dividers to clearly mark the start and end of higher timeframe candles on your lower timeframe chart. These dividers are also fully customizable:
• Color
• Style
• Width
• And again, if you prefer a cleaner chart, you can set the opacity to zero to hide them completely.
This setup gives you full control over how much or how little visual data you want to see, aligning the tool with your personal trading workflow.
💡 Example Use Cases
These examples are for educational purposes only. This tool is not financial advice and should always be used in conjunction with your own trading plan—whether it involves Fair Value Gaps, Order Blocks, or a custom combination of ICT-based elements.
• Example 1: A 1H Bearish Fair Value Gap overlapping with the Equilibrium Key Level of the Previous Day's Range – a high-probability zone for reaction.
• Example 2: A 1H Bullish Fair Value Gap in Discount, overlapping with the Equilibrium of Two Days Ago, followed by a move into a 1H Bearish Order Block that coincides with the Previous Day’s Equilibrium.
• Example 3: The same 1H PD Arrays viewed from a 4H chart, alongside Weekly Price Levels – giving you a higher timeframe context that supports or invalidates lower timeframe setups.
• Example 4: A combination of two timeframes for added context. A 4H Bullish Fair Value Gap is nested inside the current Weekly Equilibrium Key Level . On the 15M chart , we observe a reaction that creates an Inversion Fair Value Gap , which aligns with the Equilibrium Key Level of the previous 4H candle .
This indicator doesn’t replace your trading plan—it enhances your ability to execute it. It’s a precision tool made for ICT traders who understand context, structure, and probability.

IXii - Position size calculatorThis is indicator to calculate Position size before entry, which is applied for:
- FX
- Gold
- Indicies

R Manager PRO++ V1.3j📝 Description:
R Manager PRO++ is a powerful visual trade management tool designed for traders who want to plan their setups clearly, track reward levels, and receive automatic alerts – all directly on the chart.
✅ Core Features:
🎯 3 parallel setups (A, B, C) with individual Entry & Stop Loss
🔽 Symbol-specific control → each setup only appears on the selected instrument
📏 Automatic R-level lines (1R–5R) drawn from your entry
📢 Smart alerts for 1R to 5R – triggered once per level
📍 Live R-multiple display above or below the stop, depending on direction
🧹 Reset buttons for each setup
🧾 Built-in info section (how to set up alerts, decimal formatting, device notes)
📲 Mobile-Friendly Alerts (Push Notifications Supported):
Alarms must be enabled once using “Create Alert” → choose Every alert() function call.
💡 Perfect for:
Day traders, scalpers, swing traders
Forex, indices, gold and more
Traders who work with structured R-based setups

AI Smart Liquidity Signal BOT 🚀🔐 إشارات تداول ذكية مبنية على اختراقات السيولة الحقيقية + فلاتر دقيقة تؤكد الإشارات بفعالية.
✅ فلترة الاتجاه العام + الاتجاه الذكي
✅ تأكيد عبر UT BOT
✅ تأكيد عبر RSI و MACD
✅ مناطق دعم ومقاومة ديناميكية ومتعددة الفريمات
✅ أهداف Take Profit و Stop Loss محسوبة تلقائيًا عبر ATR
⛔️ بدون إعادة رسم – إشارات موثوقة ومجربة
🔎 نسبة دقة تفوق 95% على البيانات التاريخية مخصص للذهب بدقة عالية
💬 للحصول على صلاحية الاستخدام أو الدعم:
@GoldAIChannel
––––––––––––––––––––––––––––––––––––––––––––––––––
🚀 AI Smart Liquidity Signal
🔐 Real-time smart signals based on true liquidity breakouts with advanced filters.
✅ General + Smart Trend filters
✅ UT BOT
✅ RSI & MACD confirmation
✅ Dynamic and Multi-Timeframe Support/Resistance
✅ Auto-calculated Take Profit & Stop Loss via ATR
⛔️ No repaint – trusted & verified signals
🔎 Historical accuracy above 95% ( especially for gold )
💬 For access or support:
@GoldAIChannel
––––––––––––––––––––––––––––––––––––––––––––––––––
📌 ملاحظة / Disclaimer:
هذا المؤشر مخصص لأغراض تعليمية ولا يُعد نصيحة مالية. التداول على مسؤوليتك الخاصة.
This script is for educational purposes only and does not constitute financial advice. Trade at your own risk.

NQ Hourly Stats - Detailed Prob (24h)Hourly Sweep Statistics - Probability Engine (Credits to nqstats.com)
Overview
This indicator is a powerful statistical tool designed for intraday traders, particularly those focused on session-based patterns and mean reversion strategies. It automatically tracks the previous hour's high, low, and open, and when a sweep of the high or low occurs, it instantly displays the historical probability of the price returning to the hourly open within that same hour.
The core of this indicator is a comprehensive probability model built on historical price data, providing traders with an objective, data-driven edge.
Key Concepts
The indicator operates on a simple but effective premise: after the high or low of the previous hour is taken, what is the statistical likelihood that price will revert back to the opening price of the current hour?
• Previous Hour High (PHH) & Previous Hour Low (PHL): These levels often act as key liquidity zones. A sweep of these levels can signify either a stop run before a reversal or the start of a strong continuation.
• Return to Open: This is a classic mean-reversion concept. The indicator quantifies the probability of this event happening based on the exact time the sweep occurs.
• Time-Based Probability: The probability of returning to the open is not static; it changes depending on when the sweep happens. A sweep in the first 5 minutes of the hour has a different statistical outcome than a sweep in the last 5 minutes. This indicator accounts for that variance by breaking down the hour into 12 distinct 5-minute buckets.
How It Works
1. Automatic Level Plotting: At the start of each new hour, the indicator automatically draws three lines on your chart:
o The Previous Hour's High (Teal, solid line)
o The Previous Hour's Low (Maroon, solid line)
o The Current Hour's Open (Gray, dotted line)
2. Sweep Detection & Labeling: The script constantly monitors price action. The moment the current price action sweeps (touches or breaks) the PHH or PHL, a label appears.
o High Sweep: A label will appear above the PHH line.
o Low Sweep: A label will appear below the PHL line.
3. Information-Rich Labels: Each label provides crucial, real-time information:
o Direction: "Took PHH" or "Took PHL".
o Time: The exact time (@ HH:MM) the sweep occurred.
o Probability: The historical probability ("Prob to Open: XX.XX%") of price returning to the hourly open after that specific sweep.
4. Dynamic Color-Coding: The labels are color-coded for at-a-glance interpretation:
o Green: High probability (>70%) - Strong statistical likelihood of returning to the open.
o Orange: Medium probability (40%-70%) - Neutral/moderate likelihood.
o Red: Low probability (<40%) - Weak statistical likelihood of returning to the open; may suggest trend continuation.
How to Use in Your Trading
This indicator is not a standalone signal generator but a powerful confluence tool to enhance your decision-making.
• Mean Reversion Setups: When a sweep occurs and a high-probability (green) label appears, it can serve as strong confirmation for a mean-reversion trade. You can look for entries on a lower timeframe, targeting the hourly open.
• Trend Continuation Setups: If a sweep generates a low-probability (red) label, it suggests that the move has strength and is less likely to reverse. This can be used to validate a breakout or trend-following strategy, or to avoid taking a counter-trend trade.
• Filtering Trades: Use the probabilities to filter your existing setups. You might choose to only take reversion trades when the probability is above a certain threshold (e.g., 70%) or avoid them entirely when the probability is low.
Features & Customization
• Full 24-Hour Data: The statistical model includes data for all 24 hours of the day, making it useful for trading any session (Asia, London, New York).
• Timezone Setting: Ensure you set the Chart Timezone input to match your chart's timezone (e.g., 'America/New_York') for the probabilities to be accurate.
• Custom Colors: All line colors are fully customizable to match your chart's theme.
Disclaimer: This indicator is based on historical statistics and does not guarantee future results. It should be used as part of a comprehensive trading plan that includes proper risk management. Always do your own research and backtesting.

Cross-Exchange Open Interest[nakano]## Cross-Exchange Open Interest
This Pine Script® indicator aggregates **Open Interest (OI)** across multiple exchanges and trading pairs, displaying it as a single, easy-to-understand candlestick chart. OI represents the total number of outstanding derivative contracts and is a crucial metric for gauging market sentiment and liquidity.
このPine Script®インジケーターは、複数の取引所と複数の取引ペアにわたる**オープンインタレスト (OI)** を集計し、単一の分かりやすいローソク足チャートとして表示します。OIは未決済のデリバティブ契約の総数を表し、市場のセンチメントと流動性を測る重要な指標となります。
### Key Features
* **Cross-Exchange Aggregation:** Integrates OI data from several major exchanges (e.g., Binance, OKX, BitMEX, Kraken). You can configure up to 10 exchange slots.
* **クロス取引所集計:** 複数の主要な取引所 (例: Binance, OKX, BitMEX, Kraken) からのOIデータを統合します。最大10個の取引所スロットを設定できます。
* **Multi-Pair Support:** For each exchange, you can specify multiple trading pairs (e.g., `USDT.P`, `USD.P`) separated by commas, and their OIs will be summed up.
* **複数ペアサポート:** 各取引所に対し、カンマ区切りで複数の取引ペア(例: `USDT.P`, `USD.P`)を指定し、それらのOIを合計して表示できます。
* **Flexible Asset Settings:**
* **Chart Symbol:** Automatically aggregates OI for the base asset of the current chart (e.g., BTC if on a BTCUSDT chart).
* **Custom Asset:** Allows you to manually specify a base asset (e.g., ETH, SOL) for OI aggregation.
* **柔軟な資産設定:**
* **チャートシンボルに連動:** 現在表示しているチャートの基本資産(例: BTCUSDTチャートならBTC)のOIを自動的に集計します。
* **カスタム資産:** 特定の基本資産(例: ETH, SOL)のOIを手動で指定して集計することも可能です。
* **OI Candlestick Display:** Plots the aggregated OI data as candlesticks.
* **Up/Down Candles:** OI increases are shown as "up" candles, and decreases as "down" candles, with customizable colors.
* **OIローソク足表示:** 集計されたOIデータをローソク足としてプロットします。
* **陽線/陰線:** OIが増加した場合は陽線、減少した場合は陰線として表示され、色をカスタマイズできます。
* **Bar Coloring based on OI Change:** Features the ability to change the color of the main chart's price bars based on significant OI changes.
* **Dynamic Threshold:** Calculates a dynamic threshold based on historical OI changes and a user-defined multiplier to automatically identify "significant changes" in OI.
* **Color-coded:** Highlights the main chart's bars with customizable colors when there is a large increase or decrease in OI.
* **OI変化に基づくバーカラーリング:** メインチャートの価格バーの色を、OIの大きな変化に基づいて変更する機能があります。
* **動的閾値:** 過去のOI変化を基に動的な閾値を計算し、設定した乗数に応じてOIの「大きな変化」を自動で識別します。
* **色分け:** OIの大幅な増加または減少があった場合に、メインチャートのバーをカスタマイズ可能な色でハイライトします。
* **Debug Table (Optional):** When enabled, a debug table appears on the chart, showing raw OI data, quantity-based OI, and USD-converted OI for each exchange and pair in real-time, which helps in verifying the data.
* **デバッグテーブル (オプション):** 有効にすると、各取引所・ペアごとの生OIデータ、数量ベースのOI、USD換算OIをリアルタイムで表示するデバッグテーブルがチャート上に表示され、データの確認に役立ちます。
### How to Use
This indicator helps you understand the overall trend of open positions for a specific asset across the market. An increase in OI generally indicates an influx of capital and growing market interest, while a decrease suggests the opposite. By combining price movements with OI changes, you can gain deeper insights into bullish/bearish signals and the potential for trend continuation or reversal.
このインジケーターは、特定の資産に対する市場全体の未決済ポジションの動向を把握するのに役立ちます。OIの増加は通常、市場への資金流入と関心の高まりを示し、OIの減少はその逆を示唆します。価格変動とOIの変化を組み合わせることで、市場の強気・弱気の兆候や、トレンドの継続・反転の可能性をより深く分析することが可能です。
### Settings
* **OI Candle Settings:** Configure the colors for the up and down OI candles.
* **OIローソク足設定:** OIローソク足の陽線と陰線の色を設定します。
* **Asset & Exchange Settings:**
* **Asset Source:** Choose "Chart Symbol" to link to the current chart's symbol, or "Custom" to specify the asset in "Base Asset (Custom)".
* **Slot 1-10:** Enable/disable each exchange slot and set the exchange name and comma-separated trading pairs you wish to aggregate.
* **資産と取引所の設定:**
* **資産ソース:** 「Chart Symbol」を選択すると現在のチャートのシンボルに連動し、「Custom」を選択すると「Base Asset (Custom)」で指定した資産のOIを集計します。
* **スロット 1-10:** 各スロットで取引所を有効/無効にし、取引所名と、集計したい取引ペア(カンマ区切り)を設定します。
* **Bar Coloring on OI Change:**
* **Enable Bar Coloring:** Toggles whether the main chart's bars change color based on significant OI changes.
* **Threshold Calculation Period / Multiplier:** Sets the period and multiplier for dynamic threshold calculation.
* **OI Increase Color / OI Decrease Color:** Sets the colors applied to the main chart's bars for large OI increases/decreases.
* **OI変化に基づくバーカラーリング:**
* **バーカラーリングを有効にする:** OIの大きな変化に基づいてメインチャートのバーの色を変更するかどうかを切り替えます。
* **閾値計算期間 / 乗数:** 動的な閾値計算に使用する期間と乗数を設定します。
* **OI増加時の色 / OI減少時の色:** OIの大きな増加/減少があった場合にメインチャートのバーに適用される色を設定します。
* **Debug Table Settings:**
* **Show Debug Table:** Toggles the display of the debug table and sets its position.
* **Font Size / BG Color:** Configures the font size and background color for the debug table.
* **デバッグテーブル設定:**
* **デバッグテーブルを表示:** デバッグテーブルの表示/非表示を切り替え、表示位置を設定します。
* **フォントサイズ / 背景色:** デバッグテーブルのフォントサイズと背景色を設定します。

Non-Commercial Bias TrackerNon-Commercial Bias Tracker
Overview
The Non-Commercial Bias Tracker is a sophisticated sentiment analysis tool designed to provide traders with a clear view of the positioning of institutional speculators in the futures market. By analyzing the weekly Commitment of Traders (COT) report, this indicator helps you understand the underlying bias of large market participants for a wide range of assets, including forex, commodities, and indices.
The primary goal of this tool is to identify the prevailing trend in market sentiment and alert you to significant shifts in that trend, allowing you to align your strategy with the flow of institutional money.
Key Features
Dual Asset Analysis: Automatically detects the two assets in a trading pair (e.g., EUR and USD in EURUSD) or a single asset (e.g., GOLD) and displays their sentiment data side-by-side.
Comprehensive Data Table: A clean, customizable dashboard shows you the most critical sentiment metrics at a glance, including the current Net Position, the Change %, and the Overall Bias.
Visual Sentiment Plot: The indicator plots the primary sentiment metric and its signal line, giving you a visual representation of momentum and trend.
Clear Bias-Shift Signals: Green and red circles appear directly on the plot to highlight the exact moment the underlying sentiment momentum shifts, providing clear and timely signals.
How to Use the Indicator
Important Note: The Commitment of Traders data is released weekly. For the most accurate and meaningful signals, it is strongly recommended to use this indicator on the Weekly (W) chart timeframe.
1. The Data Table
The table in the corner of your screen is your main dashboard. Here’s what each row means:
Net Position: Shows the net difference between long (bullish) and short (bearish) contracts held by non-commercial traders. A positive number indicates a net long position; a negative number indicates a net short position.
Change %: This is the primary metric used for analysis, representing the net sentiment as a percentage.
Overall Bias: This is the final output of the indicator's analysis. It provides a clear "Long" or "Short" signal based on the current sentiment momentum. This cell is color-coded for quick interpretation (Green for Long, Red for Short).
2. The Chart Plots
Blue Line: Represents the current sentiment metric ("Change %" or "Net Position %").
Orange Line: Represents the signal line, or the average sentiment over a specific period.
Crossover Signals:
A Green Circle appears when the blue line crosses above the orange line, signaling a shift to a Long Bias.
A Red Circle appears when the blue line crosses below the orange line, signaling a shift to a Short Bias.
Settings & Customization
You can tailor the indicator to your specific needs via the Settings menu:
Data Source: Choose between "Futures Only" or the combined "Futures and Options" data.
Metric Type: Select whether to analyze the market using "Change %" (for momentum) or "Net Position %" (for conviction).
Bias Signal Line Length: Adjust the sensitivity of the crossover signals. A shorter length is faster, while a longer length provides smoother, more confirmed signals.
Style Settings: Customize the position of the data table and the color of the text to match your chart theme.
Disclaimer: This indicator is a tool for analysis and should not be considered as direct financial advice. All trading involves risk. Always use proper risk management and conduct your own due diligence before making any trading decisions.

然哥波浪ProHere's some help for the English speakers.
Wave Trend Oscillator + Divergence +
Direction Detection + Alerts
Longitude del canal
Channel length
Period movil
Mobile Period
reaccion en cambio de direccion
reaction on change of direction
nivel sobre compra
level on purchase
nivel sobre venta
level on sale
solo ventas en sobre compra
only sales on envelope purchase
solo compras en sobre venta
only purchases on oversale
ver histograma
see histogram
ver media de senal
see signal average
pintar barras
painting bars
ver divergencias regulares alcistas
see regular bullish divergences
ver divergencias regulares bajistas
see regular bearish divergences
ver divergencias ocultas alcistas
view hidden bullish divergences
ver divergencias ocultas bajistas
view hidden bearish divergences
ver etiquetas de divergencias
see divergence labels
activar media movil extra para wt
activate extra mobile media for wt (wave trend)
MA extra tipo = Moving average type
MA extra periodo = MA extra period
MA extra reaccion = MA extra reaction
Media WT (wave trend)
Color 0
Color1
Media senal
media signal
Nivel 0
Level 0
Nivel 1 sobre compra
level 1 on purchase
All 1-8
Nivel 1 sobre venta
level 1 on sale
All 1-8
Ventas en sobre compra
Sales in overpurchase
todas las venta
all sales
Compra en sobre venta
Purchase in over-sale
Todas las compra
All purchases
Histograma
Histogram
Divergencias bajistas
Bearish divergences
Divergencias alcistas
Bullish divergences
Divergencias regular bajistra
Regular bearish divergences
Divergencias oculta bajista
Bearish hidden divergences
Divergencias regular alcistas
Regular bullish divergences
Divergencias oculta alcistas
Bullish hidden divergences
MA (moving average) plot
Plot back ground
Labels Value plots

CEO IndicatorCEO Indicator
Liquidity Levels:
PDH / PDL (Previous Day High/Low)
PWH / PWL (Previous Week High/Low)
PMH / PML (Previous Month High/Low)
DO, NYM, WO, TWO, MO (Daily/Weekly/Monthly Opens + True Opens)
Asia Midpoint (0.5) — midline between Asian session high and low
Customization: colors, opacity, line thickness
Trading Sessions:
4H Display: On the 4H timeframe and above, session boxes may appear cluttered or overlapping.
You can disable session display for higher timeframes to keep the chart clean.
Overlap: When Overlap is turned off, sessions will not be drawn on top of each
other — improving visual clarity during overlapping markets (e.g. London + New York).
Supports: Asia, Frankfurt, London, New York, Lunch
Display modes: Box, Streamlined, Fill, High-Low zones
Customized labels
Time zone auto-adjust & custom time zones
Fractals & FVG:
Automatic fractal high/low detection
Displays Fair Value Gaps (FVG) — bullish & bearish


Nexus ZonesAsia and NY Window Zones for Nexus Wyckoff Method. Used to target key Springs and Upthrusts or Order flow manipulation times

FVGs Multi-Frame Optimized v1.0Description
FVGs Multi-Frame Optimized v1.0 This indicator detects and visualizes Fair Value Gaps (FVGs) across multiple timeframes (from 1 second to 1 day). It offers complete customization of imbalance visualization including:
Styles and colors for bullish/bearish FVGs
Labeling options
Mitigated zone management
Proximity controls to show/hide FVGs
Individual timeframe settings
User Manual:
1. Basic Setup :
Select which timeframes to display (1s to 1D)
Choose whether to hide lower/current timeframes
Adjust spacing between zones from different timeframes
2. Visual Styles :
Customize lines (solid, dashed, dotted)
Define colors for active and mitigated FVGs
Control line thickness
3. Advanced Options :
Enable/disable proximity filter
Configure FVG mitigation criteria
Limit maximum visible FVGs


