[DEM] Bollinger Bands + Rob Hoffman Signal (With Backtesting) Bollinger Bands + Rob Hoffman Signal (With Backtesting) combines Bollinger Bands with a custom price action pattern, reminiscent of Rob Hoffman's "Inventory Retracement Bar" concept, to generate buy and sell signals. It includes a robust backtesting framework to evaluate the historical performance of these signals. The indicator overlays directly on the price chart, plotting signals and displaying performance statistics in a table.
Indicators and strategies

[DEM] Better McGinley Better McGinley implements a variation of the McGinley Dynamic indicator. The McGinley Dynamic is an adaptive moving average that aims to provide a smoother and more responsive line than traditional moving averages, reducing whipsaws and following price more accurately during trending periods. This Better McGinley version then applies an additional smoothing layer to the primary McGinley line. It overlays directly on the price chart.

[DEM] ATR Filtered Sequential Signal (With Backtesting) ATR Filtered Sequential Signal (With Backtesting) combines a modified sequential counting methodology with an Average True Range (ATR) based filter to generate buy and sell signals. It includes a robust backtesting framework to evaluate the historical performance of these signals. The indicator overlays directly on the price chart, plotting signals and displaying performance statistics in a table.

[DEM] ATR Bars ATR Bars is designed to highlight bars on the chart that exhibit unusually high volatility in one direction (up or down) compared to the average volatility. It does this by comparing the short-term Average True Range (ATR) with a multiple of the long-term ATR. The indicator overlays directly on the price chart by coloring the bars.

[DEM] Aroon Oscillator Aroon Oscillator is a momentum-based indicator designed to measure the strength of a trend and the likelihood of its continuation. It does this by tracking the number of periods since the highest high and lowest low within a specified look-back period.

[DEM] ALMA Signal (With Backtesting) ALMA Signal (With Backtesting) is designed to generate buy and sell signals based on the Arnaud Legoux Moving Average (ALMA) combined with Average True Range (ATR) and includes a backtesting framework to evaluate the performance of these signals. It overlays directly on the price chart and also displays performance statistics in a table.

[DEM] 10 in 1 Oscillator 10 in 1 Oscillator combines the signals from ten popular technical indicators into a single aggregated oscillator. It aims to provide a comprehensive view of market sentiment by counting how many of these underlying indicators are currently signaling an "up" or "bullish" condition.

Market Strength Dashboard🚀 What It Does:
The indicator gives you a real-time dashboard showing three things:
✅ Trend Direction
Uses EMA 50 vs EMA 200.
Bullish: EMA 50 is above EMA 200 → Price favors upside swing.
Bearish: EMA 50 is below EMA 200 → Price favors downside swing.
Neutral: EMAs are equal → No clear trend.
✅ Momentum Strength
Uses RSI (Relative Strength Index).
Strong Bullish: RSI > 55 → Buyers in control.
Strong Bearish: RSI < 45 → Sellers in control.
Neutral: RSI between 45–55 → No strong momentum, usually sideways or uncertain.
✅ Volatility State (Expansion/Consolidation)
Uses Bollinger Band Width.
Measures if price is:
Expanding: BB Width increasing → Market opening up, volatility rising, often precedes large moves or breakouts.
Contracting: BB Width shrinking → Market compressing, often leads to tight ranges or consolidation.
Stable: No change in BB Width → Range behavior or calm trend.
🔥 How It Works Behind the Scenes:
EMA Cross Check:
→ Looks at whether the faster EMA (50) is above or below the slower EMA (200).
RSI Scan:
→ Reads current RSI level to determine momentum strength.
Bollinger Band Width Scan:
→ Calculates the distance between the upper and lower Bollinger Bands to detect if price is expanding or compressing.
Dashboard Output:
→ Combines all this into a floating label on the chart like:
“Trend: Bullish | Momentum: Strong Bullish | Volatility: Expanding”
🏆 How to Use It — Simple Rules for Swing or Day Trading:
🔥 Ideal Swing Trade Setup:
→ ✅ Trend: Bullish
→ ✅ Momentum: Strong Bullish
→ ✅ Volatility: Expanding
→ → Take long setups → pullbacks to EMA50 or previous highs → ride the trend.
→ ❌ If Trend is Neutral or Volatility is Contracting, skip the trade — market is chopping.
🔥 Ideal Day Trade Setup:
Look for Volatility Expanding → confirms active session/move.
Pair it with either Trend Bullish + Momentum Bullish for longs
→ Or Trend Bearish + Momentum Bearish for shorts.
🔥 When Not to Trade:
Trend Neutral + Momentum Neutral + Contracting Volatility → Sideways chop → No trade zone.
🔥 Breakout Watch Strategy:
When volatility shifts from Contracting → Expanding, expect a breakout.
→ Look for the first candle that pushes away from the Bollinger squeeze.
📊 How To Combine With Other Setups:
→ ✅ Add this dashboard to any chart to instantly know:
Should I be thinking up, down, or neither?
Is this market about to move big or stay stuck?
Pair it with:
Your price action entries.
Support/resistance levels.
Candle patterns.
Trendline or liquidity breaks.
🧠 Bottom Line:
→ This is a market condition scanner, not a signal generator.
→ It tells you: “Should I trade? What’s the direction? Is the market moving or stuck?”
→ You still choose the entry — this tool tells you when conditions are ideal or not.

[DEM] % Risk % Risk calculates and plots the average daily percentage change in price, which can be interpreted as a measure of short-term price volatility or "risk." It is displayed as a percentage.

RSI Combo: CrosssOverLoad(DEMO)!!! ONLY FOR CRYPTO ASSETS!!!
(Описание на русском доступно по ссылке внизу )
RSI Combo — Indicator Description
RSI Combo is an intelligent tool for crypto market analysis, designed to assess current trend strength, identify potential reversal zones, and evaluate market participant dominance. Unlike classic RSI formulas, it uses a synthetic evaluation of altcoins versus Bitcoin and the overall liquidity structure.
🌎 Types of Signals & System Logic
• Ticker Signal🔻(small red and green arrows) — local signal on a specific asset. This is the most frequent type, capturing short-term shifts in demand/supply pressure.
• Market Signal ⬇️(blue bidirectional arrows)— derived from Bitcoin dominance, alt weakness, and the liquidity vector.
• COMBO Signal 🔽🔼 (large red and green arrows)— occurs when both above signals align. This is the strongest type.
📈 Trend Structure & Importance of Context (Tip)
Signal strength always depends on the market context in which it occurs:
If a strong COMBO long signal appeared recently on a higher timeframe (e.g., 4H, 12H, or 1D), and the market is still growing, then long signals on lower timeframes (15m, 30m) become much more reliable. (And vice versa for short logic.)
If higher timeframes recently showed short signals, while lower ones give longs — it could simply be a temporary bounce.
RSI Combo helps you build a time-based signal hierarchy, so you can distinguish between local moves and parts of a broader trend.
You're testing a fully operational indicator that includes the entire mathematical core of our algorithm.
⚡ Non-Repainting Signals
Signals do not repaint or appear after the fact. What you see in history is what appeared in real time.
🧠 Mathematical Core
• BTC vs Alt dominance evaluation
• Reversal zone detection
• Volatility filtering
• Market pressure & exhaustion
📊 RSI Combo Pricing Tiers
A limited demo version is available to you.
A fully functional free demo version for 7 days is available upon request.
mail: namelessone1998@gmail.com
telegram: t.me/RSI_Combo (@RSI_Combo)
Image Url:
disk.yandex.ru
Subscribe for 1 year and get 1 month free.
Demo
• Signals with 5-day delay
• From 15min TF to 23 H
• Combo + Ticker + Market signals
• Full signal history
• No support
🚀 Trial (Free) Trial (7 days)
• Real-time signals
• From 1min TF
• Combo + Ticker + Market signals
• Alerts
• Basic webhook templates
• Full signal history
• No support
• No alerts after trial
💼 Basic ($15/month)
• Real-time signals
• From 7min TF
• Only Ticker + Market signals
• No alerts, no combo
• Signal history: 500 bars
• No webhook, no support
⚙️ Standard ($25/month)
• Real-time signals
• From 1min TF
• Combo + Ticker + Market signals
• Basic webhook templates
• Signal history: 1000 bars
• No support, no extras
📊 Professional ($40/month)
• Real-time signals
• All timeframes
• Full signal package
• Advanced webhook templates
• Signal history: 2500 bars
• No support, no extras
👑 Premium ($65/month)
• Real-time signals
• All timeframes
• All signals + per-ticker sensitivity
• Custom webhook (with ID + TF)
• Full signal history
• Priority support (Telegram)
• Beta feature access
📝 Parameter Highlights
• Alerts — respond fast to entry/exit signals
• Webhooks — automation and bot integration
• Signal History — analyze asset behavior, optimize per-ticker settings
• Market Signal — gauge overall trend
• Custom Signals (Premium) — quickly add alerts for all signal types across unlimited tickers, no need to manually enter ticker names or timeframes. Especially useful when tracking many assets — activate once, and alerts will flow automatically.
• Sensitivity Tuning (Pro/Premium) — allows you to adapt indicator behavior to each specific ticker. We've analyzed hundreds of altcoin charts to derive optimal average parameters, but each asset has unique structure, volatility, and dynamics. Fine-tuning gives traders more accurate and relevant signals.
• Support — Telegram-based assistance and help
• Beta Access — early access to experimental features
Russian Description:
Вам доступна демо версия с ограничениями. Полное описание и инструкция, тарифы - доступны по ссылкам. Ознакомьтесь, пожалуйста
Бесплатная полностью функциональная Демо версия сроком на 7 дней предоставляется по запросу:
mail: namelessone1998@gmail.com
telegram: @RSI_Combo
Позволит Вам оценить все возможности и принять решение о приобретении нашего алгоритма.
disk.yandex.ru
disk.yandex.ru
RSI Combo — это интеллектуальный инструмент анализа крипторынка, специально разработанный для понимания силы текущего тренда, ловли разворотных точек.
Базируется на оценке силы альтов против биткоина и объемов ликвидаций.
Вам доступна демо версия с ограничениями. Полное описание и инструкция, тарифы - доступны по ссылкам. Ознакомьтесь, пожалуйста
🌎 Типы сигналов и логика системы
Индикатор выдаёт три ключевых типа сигналов, каждый из которых играет свою роль в тактике трейдера:
• "Сигнал тикера" 🔻 (мелкие красные и зеленые стрелки) — сигнал, возникающий на конкретном активе. Это основной и самый частый вид сигнала. Он фиксирует краткосрочные изменения давления в сторону спроса или предложения.
• "Сигнал рынка" ⬇️ синие разнонаправленные стрелки — ориентир, построенный на доминировании биткоина, ослаблении альтов (либо наоборот). Этот сигнал реже, но даёт понимание, на чьей стороне глобальное преимущество.
• COMBO-сигнал 🔽🔼 (крупные красные и зеленые стрелки)— момент, когда оба предыдущих сигнала совпадают. Это сильнейший тип сигнала, который указывает на согласованное движение актива и рынка. Обычно такие сигналы сопровождаются уверенным движением цены.
Бесплатная полностью функциональная Демо версия сроком на 7 дней предоставляется по запросу:
mail: namelessone1998@gmail.com
telegram: @RSI_Combo
Позволит Вам оценить все возможности и принять решение о приобретении нашего алгоритма.
Закажи подписку на 1 год, и получи 1 месяц бесплатно

[DEM] % Off High % Off High calculates and plots the percentage difference between the current closing price and the all-time high of the given ticker observed since the indicator started calculating. It is displayed as a percentage, formatted with two decimal places.

STRENGTH INDEX / Impulse SystemSTRENGTH INDEX / Impulse System Indicator
Developed by Marcelo Ulisses Sobreiro Ribeiro
This powerful TradingView indicator combines two distinct trading approaches in one versatile tool:
1. STRENGTH INDEX (Multiple EMA System)
The first section features a unique configuration of 17 exponential moving averages designed to identify market strength and trend direction. The system includes:
Core EMAs (6, 21, and 34 periods) plotted with distinct colors and weights
A dense cluster of 14 additional EMAs (7-20 periods) that create a "zone of strength"
2. Impulse System (Based on Dr. Alexander Elder's Work)
The second section implements a modified version of Dr. Alexander Elder's famous Impulse System from his classic book Trading for a Living, featuring:
Color-coded bars (green/red/blue) based on trend strength
Customizable MACD parameters (12,26,9 by default)
Optional moving average (SMA/EMA/WMA/VWMA) with adjustable periods
EMA baseline (13-period default) for trend identification
Key Features:
Switch between systems with one click
Fully customizable parameters
Clean visual presentation with adjustable line weights
Maximum 500 plotted lines for performance optimization
This indicator is ideal for traders who want to:
✔ Identify strong trends using the EMA cluster
✔ Follow the market's impulse with Elder's proven system
✔ Customize their analysis with multiple technical tools
Tip: Use the STRENGTH INDEX for trend identification and the Impulse System for entry/exit timing.

ROGUE ICT PRORogue ICT PRO — Smart Money Confluence Tool
The Rogue ICT Buy/Sell indicator is a precision-built, multi-confirmation tool inspired by Inner Circle Trader (ICT) concepts. It identifies high-probability trade setups using market structure, fair value gaps, killzone sessions, and higher timeframe trend alignment.
✅ Core Features
🔹 Market Structure Shift (MSS)
Detects clean breaks of swing highs or lows, indicating potential trend continuation or reversal.
🔹 Fair Value Gap Detection (FVG)
Automatically highlights institutional imbalances — essential ICT confluence zones.
🔹 Smart Killzone Filtering
Signals only trigger during high-liquidity sessions:
Asian (19:00–22:00)
London (02:00–05:00)
New York (07:00–10:00)
Each session is color-highlighted on the chart.
🔹 HTF EMA Bias Filter
Only trades in the direction of the Higher Timeframe 50 EMA (e.g., 1H on 5M chart). This ensures entries align with institutional directional bias. I have default set to the Daily 9 EMA but can be changed to your preference.
🔹 ATR-Based Stop Loss & Take Profit Lines
SL is calculated using ATR × multiplier
TP is placed using a customizable Risk-Reward Ratio
Both levels are plotted on the chart with "SL" and "TP" labels.
🔹 Cooldown Logic
Prevents overtrading by requiring a minimum number of bars between each signal.

TMNT3 [v5, Code Copilot] with PyramidCore Principles
Trend-Following Breakouts
Enters on clean price breakouts above the prior N-day high (System 1: 20 days; System 2: 55 days).
Exits on reversals through the prior M-day low (System 1: 10 days; System 2: 20 days).
Volatility-Based Stops
Uses the Average True Range (ATR) to set a dynamic stop-loss at
Stop = Entry Price ± (ATR×Multiplier)
Stop= Entry Price-(ATR×Multiplier)
Adapts to changing market noise—wider stops in volatile conditions, tighter in calm markets.
System 1 vs. System 2 Toggle
System 1 (20/10) for shorter, faster swing opportunities.
System 2 (55/20) for catching longer, more powerful trends.
Pyramiding into Winners
Scales into a position in fixed “units” (each risking a constant % of equity).
Adds an extra unit each time price extends by a set fraction of ATR (default 0.5× ATR), up to a configurable maximum (default 5 units).
Only increases exposure when the trend proves itself—managing risk while maximizing returns.
Strict Risk Management
Each unit carries its own ATR-based stop, ensuring no single leg blows out the account.
Default risk per unit is a small, fixed percentage of total equity (e.g. 1% per unit).
Visual Aids & Confirmation
Overlaid entry/exit channels and trend/exit lines for immediate context.
Optional on-chart labels and background shading to highlight active trade regimes.
Why It Works
Objectivity & Discipline: Rules-based entries, exits, and sizing remove emotional guesswork.
Adaptive to Market Conditions: ATR stops and pyramiding adapt to both calm and turbulent phases.
Scalable: Toggle between short and long breakout horizons to suit different assets or timeframes.

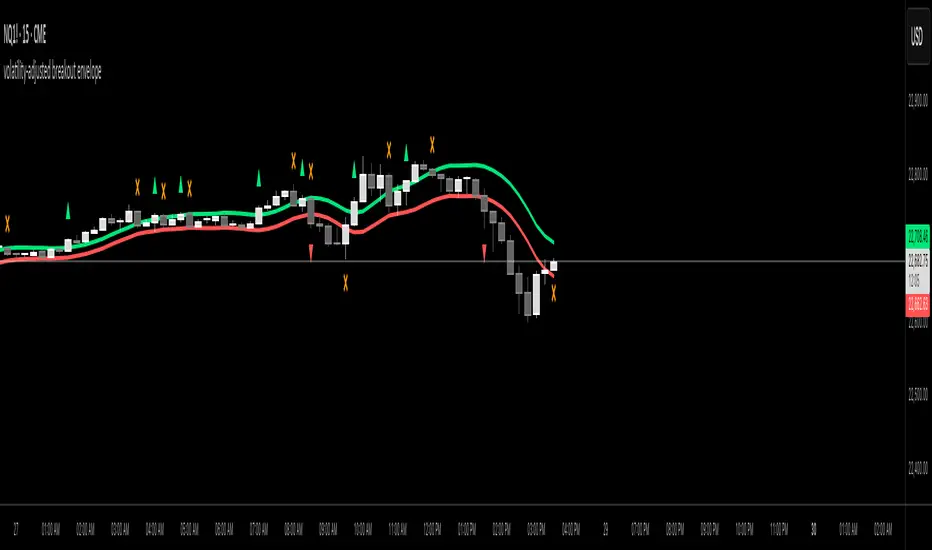
volatility-adjusted breakout envelopethis indicator is designed to help traders visually identify potential entry and exit points based on volatility-adjusted price thresholds. it works by calculating a dynamic expected price move around the previous close using historical volatility data smoothed by exponential moving averages to reduce noise and present a clear range boundary on the chart.
the indicator first computes the logarithmic returns over a user-defined lookback period and calculates the standard deviation of these returns, which represents raw volatility. it annualizes this volatility according to the chart timeframe selected, then uses it to estimate an expected price movement for the current timeframe. this expected move is smoothed to avoid sudden spikes or drops that could cause confusing signals.
using this expected move, the indicator generates two key threshold lines: an upper threshold and a lower threshold. these lines create a volatility-based range around the smoothed previous close price. the thresholds themselves are further smoothed with exponential moving averages to produce smooth, easy-to-interpret lines that adapt to changing market conditions without being choppy.
the core trading signals are generated when the price closes outside of these smoothed threshold ranges. specifically, a long entry signal is indicated when the price closes above the upper threshold for the first time, signaling potential upward momentum beyond normal volatility expectations. a short entry signal occurs when the price closes below the lower threshold for the first time, indicating potential downward momentum.
once an entry signal is triggered, the indicator waits for the price to close back inside the threshold range before signaling an exit. when this occurs, an exit marker is displayed to indicate that the price has returned within normal volatility bounds, which may suggest that the previous trend is losing strength or the breakout has ended.
these signals are visually represented on the chart using small shapes: triangles pointing upwards mark the initial long entries, triangles pointing downwards mark short entries, and x shapes mark the exits for both long and short positions. the colors of these shapes are customizable to suit user preferences.
to use this indicator effectively, traders should watch for the first close outside the smoothed volatility range to consider entering a position in the breakout direction. the exit signals help identify when price action reverts back into the expected range, which can be used to close or reduce the position. this method emphasizes trading breakouts supported by statistically significant moves relative to recent volatility while providing a clear exit discipline.
this indicator is best applied to intraday or daily charts with consistent volatility and volume characteristics. users should adjust the volatility lookback period, smoothing factor, and trading session times to match their specific market and trading style. because it relies on price volatility rather than fixed price levels, it can adapt to changing market conditions but should be combined with other analysis tools and proper risk management.
overall, this indicator provides a smoothed, dynamic volatility envelope with clear visual entry and exit cues based on first closes outside and back inside these envelopes, making it a helpful assistant for manual traders seeking to capture statistically significant breakouts while maintaining disciplined exits.
Camarilla Pivot LevelsThis script plots Camarilla Pivot Levels directly on your chart, helping you visualize key intraday support and resistance zones based on the prior day’s high, low, and close.
📌 Features:
Auto-plots R1–R6, S1–S6, and the Pivot Point (PP).
Clear color-coded support/resistance lines with labels.
Built for day traders using Camarilla formulas.
Pulls data from the prior day's values on the daily timeframe.
📈 How I Use It (My Strategy):
Each morning:
I draw a manual box around the key pivot levels (R1–R6 / S1–S6) — 1 point above and 1 point below each line.
I look for:
✅ A green candle wick into a lower box (S-levels) → I go long, take profit at the next higher box, stop loss at the bottom box.
🔻 A red candle wick into an upper box (R-levels) → I go short, take profit at the next lower box, stop loss at the top box.
Entry is only valid if the wick touches or enters the box — not if it breaks clean through.
🖼️ See the attached chart image for a live example of the strategy in action.

DAVPAK LONG AND SHORTDAVPAK LONG AND SHORT is a multi-timeframe MACD-based indicator designed to detect long and short entry signals with high precision across five configurable timeframes (5min, 15min, 30min, 1H, 4H).
The script draws color-coded vertical lines when a MACD crossover is detected in each timeframe, with customizable color, line style, and thickness.
MACD values are scaled to enhance visual clarity.
Configurable alerts are included for each crossover event.
Additionally, the MACD and signal lines are plotted with distinct colors to identify bullish or bearish momentum easily.
The indicator also includes ±270, ±1000, and ±2000 visual zones to guide overbought/oversold regions.
Features:
MACD-based logic across multiple timeframes
Custom styling per timeframe
Scalable MACD visualization
Alert-ready
Visual crossover markers on chart
Ideal for:
Scalpers, swing traders, and MTF confirmation strategies.

Anonimo Veneziano (Ottimizzato H4) HMA to track price smoothly Uses a Hull Moving Average with minimal lag to follow the price closely and reduce noise.
ATR bands to detect price expansion or compression Dynamically expands or contracts based on volatility, helping highlight overextended or consolidating zones.
Candle coloring to visually identify momentum shifts Colors bars depending on the slope of the HMA, making it easy to spot directional bias at a glance.
Optional breakout and reversal signals for the user Gives flexibility to show classic breakout signals (like crossing the ATR bands), or reversal signals (when price re-enters from outside the band), depending on your strategy preference.l’utente

Pullback - Yuri CabralPullback – Yuri Cabral is a momentum-based indicator that detects potential pullback opportunities in trending markets.
You can choose your preferred trend filter and overbought/oversold filter:
Trend Filters: Supertrend, EMAs, or both combined
Overbought/Oversold Filters: Williams %R, Stochastic RSI, or both combined
✅ A LONG signal appears when:
The asset is oversold according to your selected filter
The market is in a confirmed uptrend
✅ A SHORT signal appears when:
The asset is overbought
The market is in a confirmed downtrend
Visual aids include:
Clean triangular arrows for BUY and SELL entries
Optional display of trend lines (Supertrend and EMAs)
A single alert system with clear "LONG" or "SHORT" messages
This tool is ideal for identifying precise pullback entries within larger trend directions.

BTC/Fiat Divergence & Spread Monitor📄 BTC/Fiat Divergence & Spread Monitor
This indicator visualizes Bitcoin’s relative performance across multiple fiat currencies and highlights periods of unusual divergence. It helps traders assess which fiat pairs BTC has outperformed or underperformed over a configurable lookback period and monitor the dynamic spread between the strongest and weakest pairs.
Features:
Relative Performance Matrix:
Ranks BTC returns in 6 fiat pairs, displaying a color-coded table of percentage changes and ranks.
Divergence Spread Oscillator:
Calculates the spread between the top and bottom performing pairs and normalizes this using a Z-Score. The oscillator helps identify when fiat pricing divergence is unusually high or compressed.
Dynamic Smoothing:
Optional Hull Moving Average smoothing to reduce noise in the spread signal.
Customizable Inputs:
Lookback period for percent change.
Z-Score normalization window.
Smoothing length.
Symbol selection for each fiat pair.
Visual Mode Toggle:
Switch between relative performance lines and spread oscillator view.
Potential Use Cases:
Fiat Rotation:
Identify which fiat is relatively weak or strong to optimize your exit currency when taking BTC profits.
Volatility Detection:
Use the spread Z-Score to detect periods of high divergence across fiat pairs, signaling macro FX volatility or dislocations.
Regime Analysis:
Track when fiat spreads are converging or expanding, potentially signaling market regime shifts.
Risk Management:
When divergence is extreme (Z-Score > +1), consider reducing position sizing or waiting for reversion.
Disclaimer:
This indicator is provided for educational and informational purposes only. It does not constitute financial advice or a recommendation to buy or sell any security or asset. Always do your own research and consult a qualified financial professional before making trading decisions. Use at your own risk.
Tip:
Experiment with different lookback periods and smoothing settings to adapt the indicator to your timeframe and trading style.

Volume Overbought/Oversold Zones📊 What You’ll See on the Chart
Red Background or Red Triangle ABOVE a Candle
🔺 Means: Overbought Volume
→ Volume on that bar is much higher than average (as defined by your settings).
→ Suggests strong activity, possible exhaustion in the trend or an emotional spike.
→ It’s a warning: consider watching for signs of reversal, especially if price is already stretched.
Green Background or Green Triangle BELOW a Candle
🔻 Means: Oversold Volume
→ Volume on that bar is much lower than normal.
→ Suggests the market may be losing momentum, or few sellers are left.
→ Could signal an upcoming reversal or recovery if confirmed by price action.
Orange Line Below the Candles (Volume Moving Average)
📈 Shows the "normal" average volume over the last X candles (default is 20).
→ Helps you visually compare each bar’s volume to the average.
Gray Columns (Actual Volume Bars)
📊 These are your regular volume bars — they rise and fall based on how active each candle is.
🔍 What This Indicator Does (In Simple Words)
This indicator looks at trading volume—which is how many shares/contracts were traded in a given period—and compares it to what's considered "normal" for recent history. When volume is unusually high or low, it highlights those moments on the chart.
It tells you:
• When volume is much higher than normal → market might be overheated or experiencing a buying/selling frenzy.
• When volume is much lower than normal → market might be quiet, potentially indicating lack of interest or indecision.
These conditions are marked visually, so you can instantly spot them.
💡 How It Helps You As a Trader
1. Spotting Exhaustion in Trends (Overbought Signals)
If a market is going up and suddenly volume spikes way above normal, it may mean:
• The move is getting crowded (lots of buyers are already in).
• A reversal or pullback could be near because smart money may be taking profits.
Trading idea: Wait for high-volume up bars, then look for price weakness to consider a short or exit.
2. Identifying Hidden Opportunities (Oversold Signals)
If price is falling but volume drops unusually low, it might mean:
• Panic is fading.
• Sellers are losing energy.
• A bounce or trend reversal could happen soon.
Trading idea: After a volume drop in a downtrend, watch for bullish price patterns or momentum shifts to consider a buy.
3. Confirming or Doubting Breakouts
Volume is critical for confirming breakouts:
• If price breaks a key level with strong volume, it's more likely to continue.
• A breakout without volume could be a fake-out.
This indicator highlights volume surges that can help you confirm such moves.
📈 How to Use It in Practice
• Combine it with candlestick patterns, support/resistance, or momentum indicators.
• Use the background colors or shapes as a visual cue to pause and analyze.
• Adjust the sensitivity to suit fast-moving markets (like crypto) or slow ones (like large-cap stocks).

Gold Power Hours StrategyStrategy: XAUUSD Gold Power Hours
(ideal for Tuesday to Thursday, 8:00–11:30 am NY and 1:30–3:30 pm NY)
Strategy Rules
1️⃣ Timeframe
Trade on 15 min and 1 hour charts
Confirm with the 4 h chart (trend direction)
2️⃣ Entry Conditions
✅ Main trend (confirmation):
50-period Simple Moving Average (SMA50) on the 4h chart
price above = only look for longs
price below = only look for shorts
✅ Momentum (confirmation):
RSI(14) on the 15 min chart
above 55 = bullish strength
below 45 = bearish strength
✅ Volume (validation):
Increasing volume (bar higher than previous) during NY open (8–9 am) or at 1:30 pm
confirms institutional interest
3️⃣ Entry Setup
🟢 Longs (buys):
Price above 4h SMA50
15 min RSI > 55
break of previous resistance (e.g., last hour’s high)
rising volume on the entry candle
👉 Enter on breakout + 2 pips of margin
🔴 Shorts (sells):
Price below 4h SMA50
15 min RSI < 45
break of previous support
rising volume on the entry candle
👉 Enter on breakout – 2 pips of margin
4️⃣ Trade Exits / Management
✅ Take profit (TP):
2 × the risk taken (e.g., SL 20 pips → TP 40 pips)
or the next significant support/resistance on H1
✅ Stop loss (SL):
below the last impulse candle (for longs)
or above the last impulse candle (for shorts)
minimum 15–20 pips to avoid stop hunts
✅ Break-even
move SL to entry point once +15 pips profit is reached
5️⃣ Additional Filters
✅ Avoid trading during red news (NFP, FOMC) until the first spike finishes.
✅ Avoid trading outside these windows:
8:00–11:30 am NY
1:30–3:30 pm NY
-----------
Estrategia: XAUUSD Gold Power Hours
(ideal para martes a jueves, 8:00 – 11:30 am NY y 1:30 – 3:30 pm NY)
Reglas de la estrategia
1️⃣ Marco temporal
Operar en gráficos de 15 min y 1 hora
Confirmaciones con gráfico de 4 h (dirección de tendencia)
2️⃣ Condiciones de entrada
✅ Tendencia principal (confirmación):
Media Móvil Simple de 50 (SMA50) en gráfico 4h
precio por encima = solo buscar compras
precio por debajo = solo buscar ventas
✅ Momentum (confirmación):
RSI(14) en gráfico de 15 min
sobre 55 = fuerza alcista
debajo de 45 = fuerza bajista
✅ Volumen (validación):
Volumen creciente (barra más alta que la anterior) en la apertura NY (8–9 am) o a la 1:30 pm
confirma que hay interés institucional
3️⃣ Setup de entrada
🟢 Largos (compras):
Precio arriba de SMA50 4h
RSI 15 min > 55
rompimiento de resistencia previa (ej. alto de la última hora)
volumen creciente en la vela de entrada
👉 Entrada en rompimiento + 2 pips de margen
🔴 Cortos (ventas):
Precio debajo de SMA50 4h
RSI 15 min < 45
rompimiento de soporte previo
volumen creciente en la vela de entrada
👉 Entrada en rompimiento – 2 pips de margen
4️⃣ Salidas / gestión del trade
✅ Take profit (TP):
2 × riesgo asumido (por ejemplo, SL 20 pips → TP 40 pips)
o siguiente soporte/resistencia mayor en H1
✅ Stop loss (SL):
debajo de la última vela de impulso (para compras)
o encima de la última vela de impulso (para ventas)
mínimo 15–20 pips para evitar barridas
✅ Break-even
mover el SL a punto de entrada cuando se alcance +15 pips de ganancia
5️⃣ Filtros adicionales
✅ Evita operar durante noticias rojas (NFP, FOMC) hasta que el primer spike termine.
✅ Evita operar fuera de las ventanas:
8:00 – 11:30 am NY
1:30 – 3:30 pm NY

Session Overlay - FXMontys dual session overlayDeveloped by FX Monty
This indicator was created for traders who want a cleaner, more structured way to mark their session highs and lows, as well as lower time frame supply and demand zones using volume-based analysis.
🔹 What This Indicator Is For
Designed to complement both the Core Sessions and CM Sessions indicators.
Helps identify key trading sessions: Asia, London, and New York.
Supports traders who blend session structure, liquidity, and LTF price action for more precise setups.
📌 How to Use
Marking Highs & Lows:
Use the Core Sessions Indicator to mark session highs and lows. You can use either a box or a horizontal ray — whichever gives the cleanest visual.
Supply & Demand Zones (LTF):
Use the CM Sessions Indicator for marking LTF supply and demand zones within a session.
➤ Don’t forget to adjust your session times manually, especially for daylight savings.
High/Low of Day (HOD/LOD):
Use the 5-minute timeframe on the CM Sessions chart to mark the day’s highs and lows.
✘ Exclude the Asia session from this when evaluating HOD/LOD.
🧠 Strategy Background
This indicator is rooted in two powerful trading methodologies from my mentors:
TJR's Liquidity Concepts – Which influence how we frame session-based liquidity using the Core Sessions logic.
JordanFX's Session-Based Approach – The inspiration for using session structuring for lower time frame entries.
💙 Rest in peace, Jordan. This is for you.
This tool is part of my personal workflow, and I built it to make complex setups easier to visualize and act on. I hope it provides you with clarity, structure, and confidence in your trades.
Happy trading,
— FX Monty
