SOL Technical Confluence DashboardHow to Use This Confluence Dashboard
Setup Instructions:
Use the other script published as the 1 of 2 scripts to add to your 4-hour SOL chart.
What You'll See:
1. RSI Panel with Enhancements
Colored RSI line (Green = oversold, Red = overbought)
Divergence detection (triangles mark divergences)
Background color changes on strong signals
2. Confluence Table (Top Right)
Shows real-time status of:
RSI: Current value and signal
MACD: Trend direction
Volume: Spike detection and relative volume
Divergence: Bull/Bear divergence alerts
Confluence Scores: 0-10 scale for bull/bear strength
Overall Signal: STRONG BUY/SELL, BUY/SELL, or WAIT
3. Net Confluence Histogram (Bottom)
Green bars = Bullish confluence
Red bars = Bearish confluence
Height = Strength of signal
How It Works with Elliott Waves:
Scenario 1: Wave 5 Top Detection
Elliott Wave shows Wave 5 approaching 261.8%
Confluence Dashboard shows:
RSI: 78 (overbought) ❌
MACD: Bearish cross ❌
Volume: Declining ❌
Divergence: Bearish ❌
Signal: STRONG SELL 🔴
Scenario 2: Wave 2 Bottom
Elliott Wave shows Wave 2 at 61.8% retracement
Confluence Dashboard shows:
RSI: 28 (oversold) ✅
MACD: Bullish cross ✅
Volume: Spike ✅
Divergence: Bullish ✅
Signal: STRONG BUY 🟢
Confluence Scoring System:
The script uses a weighted scoring system:
Divergences: 3 points (most reliable)
RSI extremes: 2 points
Volume spikes: 2 points
MACD signals: 1.5 points
Price action: 1 point
Signals:
Score ≥ 5 = STRONG signal
Score ≥ 3 = Moderate signal
Score < 3 = WAIT
Pro Tips for Maximum Accuracy:
Best Setups: When Elliott Wave completion aligns with STRONG signals
Avoid: Taking trades when confluence is mixed
Volume Confirmation: Always check if volume supports the move
Divergence Priority: RSI divergence at wave endpoints is highly reliable
Alerts Available:
Strong Bullish Confluence
Strong Bearish Confluence
Bullish Divergence
Bearish Divergence
This gives you a complete technical analysis suite that works seamlessly with your Elliott Wave indicator. The combination significantly improves accuracy by confirming wave counts with momentum, volume, and divergence analysis!
Indicators and strategies

Multi-Method Moving Average v6.0Multi-Methods Moving Average Indicator is a versatile tool designed for traders who want to identify key price levels that can act as support and resistance in the market. This indicator utilizes multiple moving averages (MAs) to help visualize price trends and potential reversal points, aiding traders in making informed decisions.
Features
Multiple Moving Averages: The indicator calculates and displays six different moving averages (MA1 to MA6) based on user-defined periods. This allows traders to analyze short-term and long-term trends effectively.
Customizable Inputs: Users can customize the periods for each moving average and select the type of moving average (SMA, EMA, WMA) that best suits their trading strategy.
Price Source Selection: The indicator allows users to choose the price source (Open, Close, High, Low, or the average of Open and Close) for calculating the moving averages, providing flexibility in analysis.
Color-Coded Signals: The moving averages are color-coded based on the current price relative to the moving average, helping traders quickly identify bullish or bearish conditions.
How to Use
Adding the Indicator:
Open TradingView and navigate to the chart you wish to analyze.
Click on the "Indicators" button at the top of the chart.
Search for "Multi-Methods Moving Average" and select the indicator to add it to your chart.
Customizing Settings:
Click on the gear icon next to the indicator's name in the chart legend to open the settings menu.
Adjust the periods for each moving average to fit your trading style. Common settings include 9, 26, 52, 100, 200, and 500 periods.
Choose the type of moving average you prefer (SMA, EMA, or WMA).
Select the price source that aligns with your trading strategy.
Interpreting the Indicator:
Moving Averages: Observe the position of the moving averages relative to the price. If the price is above the moving average, it indicates a bullish trend; if below, it suggests a bearish trend.
Crossover Signals: Look for crossovers between the moving averages. A crossover where a shorter moving average crosses above a longer moving average may signal a potential buy opportunity, while a crossover in the opposite direction may indicate a sell opportunity.
Support and Resistance Levels: Use the moving averages as dynamic support and resistance levels. Price often reacts at these levels, providing potential entry and exit points for trades.
Risk Management:
Always combine the insights from this indicator with other forms of analysis, such as price action, volume analysis, and market sentiment.
Set stop-loss and take-profit levels based on the identified support and resistance levels to manage your risk effectively.
Conclusion
The Support & Resistance Indicator is an essential tool for traders looking to enhance their market analysis. By leveraging multiple moving averages and customizable settings, traders can gain a clearer understanding of market trends and make more informed trading decisions.

HA + HMA + VWAP🔍 Script Overview
This indicator blends Heikin-Ashi smoothing, Hull Moving Average (HMA), and Volume Weighted Average Price (VWAP) to help traders identify trend direction and potential trade setups. The script provides buy/sell signals based on price action relative to HMA while anchoring the view to volume with VWAP.
📈 What It Does and How
- Heikin-Ashi Calculations: Reduces noise by averaging candle structure, revealing clearer trend direction.
- Hull Moving Average (HMA): A fast, smooth-moving average applied to Heikin-Ashi close prices, tuned to respond quickly to shifts in momentum.
- VWAP Line: Acts as a dynamic fair-value reference, balancing price against volume over time.
- Signal Logic: Generates visual Buy/Sell signals when the Heikin-Ashi close crosses the HMA.
🧠 Recommended Enhancements Using RSI + ATR
For more refined entries and exits, use this indicator alongside Relative Strength Index (RSI) and Average True Range (ATR):
- RSI for Momentum Confirmation: Ensure the buy signals align with upward momentum—RSI climbing from oversold zones adds conviction.
- ATR for Volatility Awareness: Use ATR to size stops and evaluate risk. Avoid trades during volatility spikes or when ATR exceeds typical thresholds.
- Three-Leg Alignment: When HA/HMA signal agrees with RSI momentum and ATR shows stable conditions, you get high-quality trade setups with better timing and risk control.
This fusion helps discretionary traders filter noise and make confident decisions rooted in price action, volume, momentum, and volatility.
⚙️ Chart Display
- HMA: red line
- VWAP: gray line
- Buy/Sell labels: green below bars for buys, red above bars for sells
- Clean layout optimized for visual clarity
This script is open-source and does not use future data or issue caution warnings. It’s designed to assist manual trading strategies, not provide automated trading decisions.

OBR 15min Session Opening Range Breakout + Volume Trend DeltaQuick Overview
This Pine Script plots the opening range for London and New York sessions, highlights breakout levels, draws previous session pivots, and offers a live volume delta table for trend confirmation.
Session Opening Range
- Captures the high/low of the first 15 minutes (configurable) for both London & NY sessions.
- Fills the range area with adjustable semi‑transparent colors.
- Optional alerts fire on breakout above the high or below the low.
Previous Session Levels
- Automatically draws previous day’s High, Low, Open and previous 4‑hour High/Low.
- Helps identify key S/R zones as price approaches ORB breakouts.
Volume Trend Delta
- Uses a CMO‑weighted moving average and ATR bands to detect trend state.
- Accumulates bullish vs. bearish volume during each trend.
- Displays Bull Vol, Bear Vol, and Delta % in a movable table for quick strength checks.
How to Use
1. Let the opening range complete (first 15 min).
2. Look for price closing above/below the ORB—enter long on an upside break, short on a downside break.
3. Check the Volume Delta table: positive delta confirms buying strength; negative delta confirms selling pressure.
4. Use previous day/4h levels as additional support/resistance filters.
Settings & Customization
- ORB Duration & Session Times (London/NY), fill colors, and toggles.
- Enable/disable Previous Day & 4H levels.
- Trend Period, Momentum Window, and Delta table position/size.
- Pre‑built alert conditions for all ORB breakouts.
Developer Notes
- Fully commented for easy adjustments.
- Modular sections: ORB, previous levels, trend delta, and alerts.
- No external libraries—pure Pine Script v6.
Tip
Combine ORB breakouts with Volume Delta and prior session pivots to filter false signals and trade stronger, more reliable moves.

Hybrid Strategy with Position Control & Breakout Filter//@version=6
indicator('Hybrid Strategy with Position Control & Breakout Filter', overlay=true)
// === INPUTS ===
emaFastLen = input.int(8, 'Fast EMA')
emaSlowLen = input.int(21, 'Slow EMA')
rsiLen = input.int(14, 'RSI Length')
rsiOverbought = input.int(70, 'RSI Overbought')
rsiOversold = input.int(30, 'RSI Oversold')
macdFast = input.int(12, 'MACD Fast')
macdSlow = input.int(26, 'MACD Slow')
macdSignal = input.int(9, 'MACD Signal')
volatilityMultiplier = input.float(1.0, 'ATR Multiplier for Volatility Filter')
// === CALCULATIONS ===
emaFast = ta.ema(close, emaFastLen)
emaSlow = ta.ema(close, emaSlowLen)
rsi = ta.rsi(close, rsiLen)
= ta.macd(close, macdFast, macdSlow, macdSignal)
atr = ta.atr(14)
// === VOLATILITY FILTER ===
volatilityThreshold = ta.sma(atr, 14) * volatilityMultiplier
isVolatile = atr > volatilityThreshold
// === OPENING SPIKE LOGIC (first 15 mins of session only) ===
sessionStart = timestamp("America/New_York", year, month, dayofmonth, 9, 30)
first15Min = time >= sessionStart and time < sessionStart + 15 * 60 * 1000
openingBreakout = first15Min and close > open and ta.change(close) > atr * 1.5
// === POSITION TRACKING ===
var int position = 0 // 0 = no position, 1 = long, -1 = short
// === ENTRY CONDITIONS ===
longCondition = ((ta.crossover(emaFast, emaSlow) and rsi < rsiOverbought and macdLine > signalLine and isVolatile) or openingBreakout) and position != 1
shortCondition = ta.crossunder(emaFast, emaSlow) and rsi > rsiOversold and macdLine < signalLine and isVolatile and position != -1
// === EXIT CONDITIONS ===
exitLong = ta.crossunder(emaFast, emaSlow)
exitShort = ta.crossover(emaFast, emaSlow)
// === SIGNAL PLOTS ===
buySignal = longCondition
sellSignal = shortCondition
plotshape(buySignal, title='Buy Signal', location=location.belowbar, color=color.green, style=shape.triangleup, size=size.small, text='BUY')
plotshape(sellSignal, title='Sell Signal', location=location.abovebar, color=color.red, style=shape.triangledown, size=size.small, text='SELL')
// === STATE MANAGEMENT ===
if (longCondition)
position := 1
if (shortCondition)
position := -1
if (exitLong and position == 1)
position := 0
if (exitShort and position == -1)
position := 0
// === PLOT EMAs ===
plot(emaFast, color=color.orange, title='Fast EMA')
plot(emaSlow, color=color.blue, title='Slow EMA')

Hybrid Strategy with Position Control//@version=6
indicator('Hybrid Strategy with Position Control', overlay=true)
// === INPUTS ===
emaFastLen = input.int(8, 'Fast EMA')
emaSlowLen = input.int(21, 'Slow EMA')
rsiLen = input.int(14, 'RSI Length')
rsiOverbought = input.int(70, 'RSI Overbought')
rsiOversold = input.int(30, 'RSI Oversold')
macdFast = input.int(12, 'MACD Fast')
macdSlow = input.int(26, 'MACD Slow')
macdSignal = input.int(9, 'MACD Signal')
// === CALCULATIONS ===
emaFast = ta.ema(close, emaFastLen)
emaSlow = ta.ema(close, emaSlowLen)
rsi = ta.rsi(close, rsiLen)
= ta.macd(close, macdFast, macdSlow, macdSignal)
// === POSITION TRACKING ===
var int position = 0 // 0 = no position, 1 = long, -1 = short
// === ENTRY CONDITIONS ===
longCondition = ta.crossover(emaFast, emaSlow) and rsi < rsiOverbought and macdLine > signalLine and position != 1
shortCondition = ta.crossunder(emaFast, emaSlow) and rsi > rsiOversold and macdLine < signalLine and position != -1
// === EXIT CONDITIONS (Optional logic for reset) ===
exitLong = ta.crossunder(emaFast, emaSlow)
exitShort = ta.crossover(emaFast, emaSlow)
// === SIGNAL PLOTS ===
buySignal = longCondition
sellSignal = shortCondition
plotshape(buySignal, title='Buy Signal', location=location.belowbar, color=color.green, style=shape.triangleup, size=size.small, text='BUY')
plotshape(sellSignal, title='Sell Signal', location=location.abovebar, color=color.red, style=shape.triangledown, size=size.small, text='SELL')
// === STATE MANAGEMENT ===
if (longCondition)
position := 1
if (shortCondition)
position := -1
// Reset position if trend reverses
if (exitLong and position == 1)
position := 0
if (exitShort and position == -1)
position := 0
// === PLOT EMAs ===
plot(emaFast, color=color.orange, title='Fast EMA')
plot(emaSlow, color=color.blue, title='Slow EMA')

Eliora Gold 1min (Heikin Ashi)Eliora -focused trading strategy designed for anything on the 1-minute timeframe using Heikin Ashi candles. This mode combines advanced market logic with structured risk management to deliver smooth, disciplined trade execution.
Key Features:
✅ Trend Confirmation – Aligns with dominant market direction for higher accuracy.
✅ ATR-Based Volatility Filter – Avoids high-risk conditions and chaotic price action.
✅ Candle Strength Logic – Filters weak setups, focusing on strong momentum.
✅ Balanced Risk/Reward – Calculates stop-loss and take-profit dynamically for consistent results.
✅ Cooldown & Overtrade Protection – Limits frequency to maintain trade quality.
This version of Eliora is built for scalpers and intraday traders seeking high-probability entries with graceful exits.

PCR tableOverview
This indicator displays a multi-period table of forward-looking price projections. It combines normalized directional momentum (Positive Change Ratio, PCR) with volatility (ATR) and presents a forecast for upcoming time intervals, adjusted for your local UTC offset.
Concepts & Calculations
Positive Change Ratio (PCR):
((total positive change)/(total change)-0.5)*2, producing a value between –100 and +100.
Synthetic ATR: Calculates average true range over the same lookbacks to capture volatility.
PCR × ATR: Forms a volatility-weighted directional forecast, indicating expected move magnitude.
Future Price Projection: Adds PCR × ATR value to current close to estimate future price at each lookahead interval.
Table Layout
There are 12 forecast horizons—1× to 12× the chart timeframe (e.g., minutes, hours, days). Each row displays:
1. Future Time: Timestamp of each projection (adjustable via UTC offset)
2. PCR: Directional bias per period (–1 to +1)
3. PCR × ATR: E xpected move magnitude
4. Future Price: Close + (PCR × ATR)
High and low PCR×ATR rows are highlighted green for minimum value in the price forecast (buy signal) or red for maximum value in the price forecast (sell signal).
How to Use
1. Set UTC offset to your time zone for accurate future timestamps.
2. View PCR to assess bullish (positive) or bearish (negative) momentum.
3. Use PCR × ATR to estimate move strength and direction.
4. Reference Future Price for potential levels over upcoming intervals, and for buy and sell signals.
Limitations & Disclaimers
* This model uses linear extrapolation based on recent price behavior. It does not guarantee future prices.
* It uses only current bar data and no lookahead logic—compliant with Pine Script rules.
* Designed for analytical insight, not as an automated signal or trade executor.
* Best used on standard bar/candle charts (avoid non-standard types like Heikin‑Ashi or Renko).


RLMC TMAS ALPHABOT by SAMOEDEFIferas gang
made by samoedefi
for rlmcrew
ict concepts with bos breaks

Support & Resistance ZonesAuto Support And Resistance Lines, This AI auto support and ressitance lines helps identify support and resitance


Dema Entry FRAMA Exit VTECDual-Timeframe Trend Strategy
This strategy combines a 20-hour DEMA Supertrend with a 1-day FRAMA to capture strong market trends with fast entries and high-confidence exits.
Key Components
DEMA Supertrend (20H): Triggers quick entries to catch early trend momentum.
FRAMA (1D): Confirms major trends, ensuring profitable exits.
ATR Filter (1D): Sets precise entry/exit bands using Average True Range.
Gaussian Filter (1D): Smooths price data for reliable FRAMA signals.
Trading Rules
Entry: Enter long if DEMA Supertrend (20H) or FRAMA (1D) signals bullish.
Exit: Exit long if DEMA Supertrend (20H) or FRAMA (1D) signals bearish.
Flow: DEMA typically enters first, FRAMA confirms, and either closes the trade.
Best Markets
Ideal for trending markets
Use on a 1-day chart with 20-hour DEMA data.
Best for 24/7 markets; check compatibility for stocks.
This strategy balances speed and precision for high-profit trades with disciplined risk control.

NMT Buy/Sell Alarm GPTBUY:
1. When the green arrow appears, it is time for you to consider other additional situations to place a buy order
2. And you set an alert so you don't miss the opportunity
SELL:
You observe the green label showing the % ratio between the order and the current price
You want to sell with how much profit % (relatively) then you sell.

Heikin Ashi Trend Strategy (Beginner)FOR BEGINNERS
Perfect! Below is a custom Pine Script for TradingView that:
Uses Heikin Ashi candles
Shows buy/sell signals based on trend conditions:
3+ green/red Heikin Ashi candles
Price above/below 20 EMA
RSI filter for momentum


Efficient Options Entry Signals (Call/Put/Spreads)Add to TradingView as a new Indicator Script.
Works on all timeframes, but defaults are tuned for daily/5m/15m.
Arrows and labels will show precise entries/exits for calls, puts, and debit spreads based on volatility.
Only efficient, trend-confirmed trades—no whipsaw overload!
All input parameters adjustable in the script UI.

📊 Bollinger Band Strategy v1.0这份 Bollinger Band 工具脚本用于在图表上可视化布林带结构,并识别市场即将爆发的「低波动压缩区」(squeeze)、上下轨突破时机以及潜在的假突破反转信号。用户在 TradingView 图表中加载该脚本后,可以通过观察橙色小圆圈(表示布林带带宽低于阈值)、绿色/红色三角(价格突破上/下轨)以及紫色/青色叉号(free bar 回归)来辅助判断入场、出场或规避信号,从而提高波段交易的胜率与风控能力。适合结合 RSI、MACD 等动能指标进一步增强信号有效性。
// This Bollinger Band tool script is designed to visualize the Bollinger Band structure on a chart,
// identify potential "low volatility squeeze zones", breakout opportunities, and false breakout reversal signals.
// Once loaded in a TradingView chart, the user can monitor:
// - Orange circles: indicate that the Bollinger Band bandwidth has dropped below the defined threshold (squeeze signal),
// - Green/Red triangles: signal when price breaks above or below the Bollinger Bands,
// - Purple/Cyan crosses: suggest a possible fake breakout where price reverts back inside the band (free bar).
// These visual cues help traders better time entries and exits, avoid traps, and improve overall win rate in swing trading.
// This script is best used in combination with momentum indicators such as RSI and MACD to further increase accuracy.

DNAMain array blue is used for break and retest entries, driver array is used for retest entries after retracement. The arrays signify dynamic liquidity pools where price reacts from. Timeframe confluence is needed to make everything work well.

Nifty Call/Put Chart Analysis (Minimal)By Arindam Dey. it is just for learning purpose. do not use it for professional trading. if it is working fine. just let me know on my email ID arindam.day@gmail.com

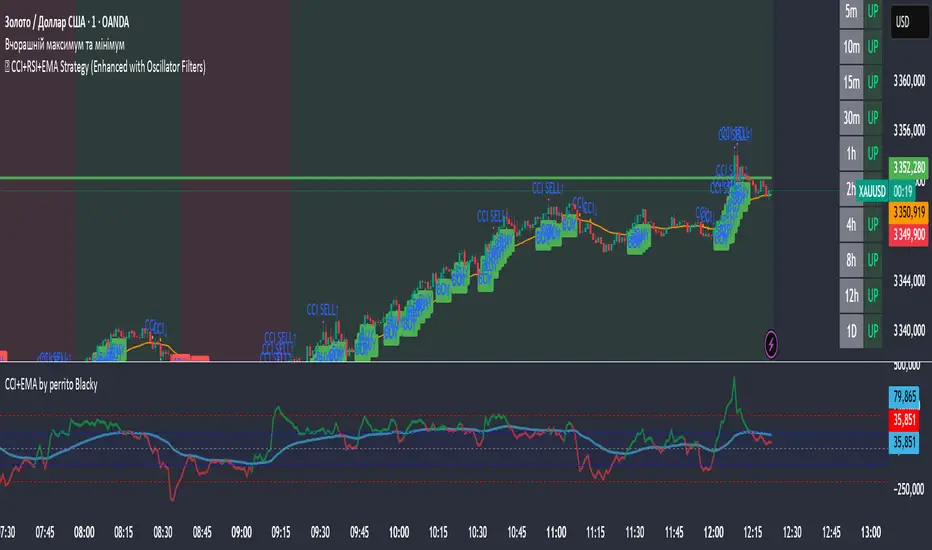
🏹 CCI+RSI+EMA Strategy (Enhanced with Oscillator Filters)This script is a multi-indicator trading strategy that combines trend-following and momentum signals using CCI, RSI, and EMA, enhanced with MACD and Stochastic filters for more reliable entries.
🧠 Core Concept
The strategy aims to:
Identify the trend using EMA(50) and a long-term comparison of EMA 35 vs EMA 169;
Spot momentum using CCI and RSI;
Filter entries through MACD and Stochastic confirmations to avoid false signals.
📌 Buy Conditions:
✅ Price is above EMA
✅ RSI is above a set threshold (default: 45)
✅ CCI is above a set threshold (default: 0)
✅ Uptrend confirmed by EMA 35 > EMA 169
✅ CCI has recently reached oversold levels (e.g. below -100)
✅ MACD shows bullish crossover
✅ Stochastic confirms exit from oversold zone
📌 Sell Conditions:
✅ Price is below EMA
✅ RSI is below a set threshold (default: 55)
✅ CCI is below 0
✅ Downtrend confirmed by EMA 35 < EMA 169
✅ CCI has recently reached overbought levels (e.g. above 100)
✅ MACD shows bearish crossover
✅ Stochastic confirms exit from overbought zone
🎯 Features:
Fully customizable inputs — adapt to your own trading style.
Trend background shading — green for uptrend, red for downtrend.
Enhanced entry logic — filters out weak signals.
CCI Cross and Trigger markers — additional confirmation tools.
🔔 Alerts
You can set alerts for ENHANCED BUY and ENHANCED SELL to never miss a quality signal.
📈 Use Case:
This tool is suitable for:
Manual trading entries and exits
Being a component of a broader trading system
Semi-automation with alert-based strategies
⚠️ Disclaimer:
This script is for educational and testing purposes only. It is not financial advice. Always backtest and demo trade before using on a live account.
Gold & FX 4H StrategyWith this indicator you BUY when the price is ABOVE the EMA and SELL when price is BELLOW all the EMA

Strategy with DI+/DI-, ADX, RSI, MACD, EMA + Time Stop [EXP. 1]Strategy Overview
This is an experimental trend-following strategy combining directional movement indicators, momentum filters, and time-based exits. Built for low timeframes like BTCUSDT 5m, it aims to detect clean directional setups while managing risk tightly.
Indicator Components
• DI+/DI- + ADX – Confirms trend direction and strength
• RSI (14) – Momentum filter (entries only if RSI > 55 or < 45)
• MACD Histogram – Confirms momentum shift in signal direction
• Candle Body % Filter – Screens for strong price commitment bars
• EMA 600 & EMA 2400 – Defines long-term trend alignment
• Time-Based Stop – Closes trade if it doesn’t move 0.75% in 85 bars
• Reward:Risk – 1% stop-loss, 7.5:1 reward-to-risk
• One Trade per EMA Cross – Only trades first valid signal per trend shift
Entry Logic
Long Entry:
• DI+ crosses above DI−
• RSI > 55
• MACD histogram > 0
• Strong bullish candle
• EMA600 > EMA2400
• Occurs within 25 bars of an EMA crossover
Short Entry:
• DI+ crosses below DI−
• RSI < 45
• MACD histogram < 0
• Strong bearish candle
• EMA2400 > EMA600
• Occurs within 25 bars of an EMA crossover
Exit Logic
• Stop-loss: 1% from entry
• Take-profit: 7.5x risk
• Time-stop: Trade closed if price doesn’t move 0.75% in 85 bars
Testing Parameters
• Initial Capital: $10,000
• Commission: 0.04% per trade
• Timeframe: 5-minute
• Tested on: BTCUSDT
• ⚠️ Early-stage strategy — trade count may be low depending on market context. This is shared for educational use and community feedback.
Notes
• This script is experimental and educational
• Please forward-test in a demo environment before using it live
• Open-source for learning and improvement — contributions welcome!
