Jeki Long Term Price Action Structures [BUY/SELL]XAUUSD Buy Sell indicator based on price action multiple time frame
Indicators and strategies

Jeki XAUUSD PremiumA combined indicator of 4 indicators at once that can be entered into 1 chart even when you use the free version of tradingview. contact me on telegram @mrzgoldt to get 30-day trial access

Bollinger Bands Levels | VTS Pro📊 Bollinger Bands Levels | VTS Pro
by Alireza Mossaheb
This advanced Bollinger Bands indicator takes your technical analysis to the next level by providing dynamic price bands along with customizable horizontal levels and labels. Whether you're a trend trader or a mean reversion strategist, this tool adapts to your workflow.
🔧 Key Features:
Three Modes: Choose between Strong (20, 2), Weak (10, 1.5), or Custom settings for full control.
Multi-Timeframe Support: Plot Bollinger Bands from any higher or lower timeframe.
Multiple MA Types: Select from SMA, EMA, RMA (SMMA), WMA, and VWMA for the basis line.
Visual Enhancements:
Optional background fill between bands
Stylized horizontal lines with labels (Top/Mid/Low)
Customizable line style, width, and color
Smart Labeling: Automatically names levels based on timeframe and mode.
Improved Plot Logic: Line width bug fixed for smoother rendering across presets.
🧠 Ideal For:
Spotting volatility squeezes or expansions
Confirming support/resistance with upper/lower bands
Creating confluence zones using higher timeframe Bollinger levels


Swing Failure Pattern (SFP) DetectorDescription
The Swing Failure Pattern (SFP) Detector is a powerful tool designed to help traders identify potential liquidity grabs and reversal zones using local and higher timeframe (HTF) swing points.
🧠 What It Does
This indicator detects Swing Failure Patterns—a price action concept where price breaks a previous swing high/low but closes back within range, suggesting a failed breakout and potential reversal. It highlights both local SFPs and HTF SFPs for added confluence.
⚙️ Core Logic
Swing Detection: Uses pivot highs/lows over a configurable length or an optional dynamic length based on ATR volatility.
SFP Criteria:
Bearish SFP: High exceeds last swing high, but candle closes below that swing level.
Bullish SFP: Low undercuts last swing low, but candle closes above that swing level.
HTF Support: Detects higher timeframe pivots using request.security() and overlays HTF SFPs on the current chart.
Visual Aids: SFP labels and optional background highlights are drawn when a valid pattern is detected. Dashed horizontal lines track the last swing points used in the logic.
Alerts: Four alert conditions are provided to notify users of local and HTF SFPs.
📌 How To Use It
Apply this indicator to any chart and timeframe.
Use dynamic length mode for adaptive responsiveness in volatile or low-volume environments.
Watch for SFPs at known liquidity zones (e.g., support/resistance, OB/FVG zones).
Use HTF SFPs as confirmation for higher conviction entries or exits.
🔒 Closed Source Justification
While the SFP concept is known, this script introduces a dual-frame detection engine that synchronizes pivot points across timeframes, applies volatility-adjusted swing detection, and includes a memory-efficient rendering logic to maintain responsiveness—even on dense charts. These enhancements provide practical trading edge and execution confidence that go beyond standard open-source implementations.
📈 Best Use Cases
Liquidity sweep confirmations
Smart Money Concept (SMC) trading
HTF/MTF alignment strategies
Reversal entries and scalp setups
🛠️ Inputs
Swing Length for Current TF: Set the fixed lookback period for local swings.
Use Dynamic Swing Length (ATR-Based): Enable auto-adjusting lookback using volatility.
Higher Timeframe for SFP Overlay: Select your HTF (e.g., D for daily).
Swing Length for HTF: Set HTF pivot detection sensitivity.
Highlight Background on SFP: Toggle background color highlighting on detection.
Disclaimer
This tool is intended for educational and informational purposes only. Trading involves risk, and past performance does not guarantee future results. Always do your own research and consult a financial advisor if necessary.

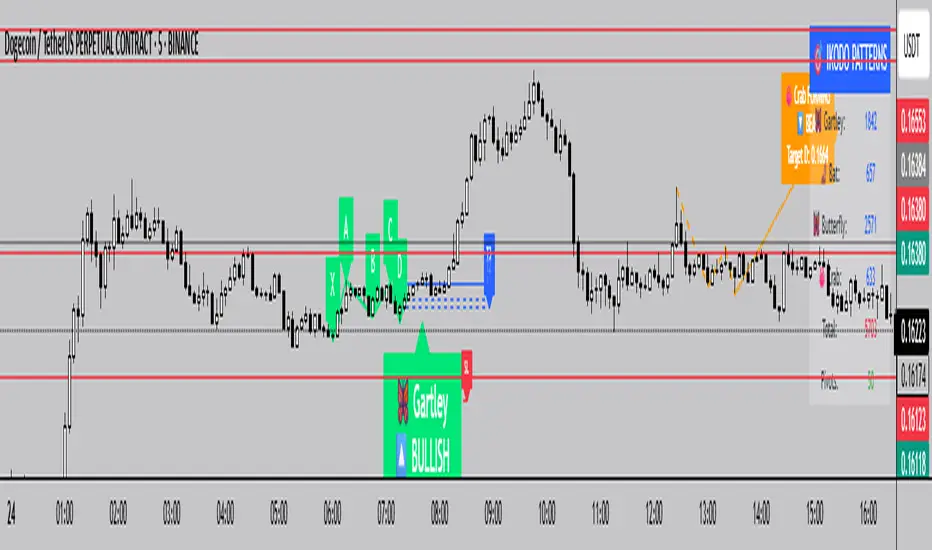
IKODO Harmonic PatternsIKODO Harmonic Patterns How its Works
IKODO Harmonic Patterns automatically scans your chart to detect Gartley , Bat , Butterfly , and Crab harmonic patterns in real-time, using strict Fibonacci ratio checks with configurable tolerance and pivot lengths.
Pivot Detection
Uses pivot highs/lows with a configurable length to mark potential turning points on the chart.
Stores and updates the last 50 pivots for performance.
Pattern Identification
Continuously checks for XABCD structures:
Confirms alternating pivot highs/lows.
Calculates XA, AB, BC, CD, AD legs.
Validates Fibonacci ratios within your defined tolerance:
Gartley: AB = 0.618 XA, AD = 0.786 XA
Bat: AB = 0.382/0.5 XA, AD = 0.886 XA
Butterfly: AB = 0.786 XA, AD = 1.272/1.618 XA
Crab: AB = 0.382/0.618 XA, AD = 1.618 XA
Visualization
Draws XABCD lines and labels on your chart.
Displays entry, three target levels (T1, T2, T3), and a stop-loss suggestion for risk management.
Uses color coding:
Green for bullish patterns.
Red for bearish patterns.
Orange for potential (forming) patterns.
Alerts & Table Stats
Generates alerts when a valid pattern completes.
Displays a live table showing:
Count of each pattern type found.
Total patterns detected.
Number of pivots tracked.
Potential Pattern Projection
If a potential pattern is forming (XAB complete, D pending), the indicator:
Projects the potential D point based on Fibonacci extensions.
Marks the path with dotted/dashed lines.
Displays a label with expected D price and pattern type.
Why Use This?
Automates advanced harmonic detection without manual drawing.
Helps in identifying precise reversal points for high-R/R trades.
Supports visual learning of harmonics while trading.
Previous Day O H L C Calculation By Md//@version=6
indicator("Previous Day O H L C Calculation By Md", overlay=true)
// Check if the previous daily candle is green (bullish) or red (bearish)
previousCandleBullish = close > open
previousCandleBearish = close < open
// Calculate the difference for bullish candles: previous day's high minus previous day's open
bullishCalculation = high - open
// Calculate the difference for bearish candles: previous day's low minus previous day's close
bearishCalculation = low - close
// Show the result at the top of the current daily candle if the previous candle was bullish
if previousCandleBullish
label.new(bar_index, high, "Bullish Calc: " + str.tostring(bullishCalculation), color=color.green, textcolor=color.white, style=label.style_label_left, size=size.small)
// Show the result at the bottom of the current daily candle if the previous candle was bearish
if previousCandleBearish
label.new(bar_index, low, "Bearish Calc: " + str.tostring(bearishCalculation), color=color.red, textcolor=color.white, style=label.style_label_left, size=size.small)

HTF Previous Candle Sweeps (1H–4D) - Safesa f as. as f. f sf s. sa fs. fsadsjaf dsadf jsdaf sdjf sajk fj sdfj saf d sj sadsd

HTF Previous Candle Sweeps (1H–4D)This is a TVS entry module, marking out the DOL and Previous candle sweeps.

Fred - FVG BOS ToolsCombining the BOS and FVG tool. I combined these 2 tools due to the lack of indicators on the free version of TradingView

HTF Previous Candle Sweeps (1H–4D)This is the TVS indicator, marking out DOL and previous candle sweeps.

Rapid Candle PATTERNS V2.0Indicator Title: Rapid Candle Patterns - High-Probability Signals
Description
Tired of noisy charts filled with weak and ambiguous candlestick patterns? The Rapid Candle Patterns indicator is engineered to solve this problem by moving beyond simple textbook definitions. It identifies only high-probability reversal and continuation signals by focusing on the underlying market dynamics: momentum, liquidity, and confirmation.
This is not just another pattern indicator; it's a professional-grade tool designed to help you spot truly significant price action events.
How The Logic Works & Why It's More Accurate
Each pattern in this script has been enhanced with stricter, more intelligent rules to filter out noise and reduce false signals. Here’s what makes our logic superior:
1. The Liquidity Grab Hammer & Inverted Hammer
Standard Logic: A simple hammer shows a long lower wick, suggesting buyers pushed the price back up.
Our Enhanced Logic: We don't just look for a hammer shape. Our signal is only valid if the hammer’s low takes out the low of the previous candle (a "liquidity grab" or "stop hunt").
Why It's More Accurate: This sequence is incredibly powerful. It shows that sellers attempted to push the market lower, triggered stop-loss orders below the prior low, and then were decisively overpowered by buyers who reversed the price. This isn't just a reversal; it's a failed breakdown, often trapping sellers and fueling a stronger move in the opposite direction.
2. The "True" Bullish & Bearish Harami
Standard Logic: A small candle forms within the high-low range of the previous candle. This can often be misleading if the prior candle has long wicks and a tiny body.
Our Enhanced Logic: We enforce a "dual containment" rule. For a Harami to be valid, its body must be contained within the body of the previous candle. We also ensure the Harami candle itself is not a Doji, meaning it must show some conviction.
Why It's More Accurate: This ensures you are seeing a genuine and significant contraction in momentum. It filters out scenarios where a large-bodied candle forms inside the wicks of a doji-like candle, which is not a true Harami. Our logic captures the "pregnant" pattern as it was intended—a moment of quiet consolidation before a potential new move.
3. The "Power" Bullish & Bearish Engulfing
Standard Logic: A candle's body engulfs the body of the previous candle. This is a common signal, but it often lacks follow-through.
Our Enhanced Logic: Our "Power Engulfing" requires two conditions: (1) The body must engulf the prior candle's body, AND (2) the candle must close beyond the entire high/low range of the prior candle.
Why It's More Accurate: This is the ultimate sign of confirmation. It doesn't just show that one side has won the battle for the session; it proves they had enough force to break the entire structure of the previous candle. This signifies immense momentum and dramatically increases the probability that the trend will continue in the direction of the engulfing candle.
4. The Quantified Doji
Our Logic: Instead of being a subjective pattern, a Doji is defined quantitatively. It's a candle whose body is less than or equal to a user-defined percentage (default 9%) of its total range.
Why It's More Accurate: It provides a consistent and objective measure of market indecision. Furthermore, any candle identified as a Doji is automatically disqualified from being a Hammer, ensuring clear and distinct signals.
User Customization
Toggle Patterns On/Off: Declutter your chart by only showing the patterns you want to see.
Fine-Tune Logic: Use the "Pattern Logic" settings to adjust the sensitivity of the Doji and Harami detectors to perfectly match your trading style, asset, and timeframe.
Disclaimer: This indicator is a powerful tool for identifying high-probability price action. However, no single indicator is a complete trading system. Always use these signals as part of a comprehensive strategy, combined with analysis of market structure, support/resistance levels, and other forms of confluence.


lon super chart## LON Super Chart Indicator
### Overview
The LON Super Chart indicator is a sophisticated volume-price momentum oscillator that combines price action with volume analysis to identify potential trading opportunities. It features a unique DNA spiral visualization that provides real-time insights into market dynamics.
### Key Features
- **Dual Line System**: Main indicator line and moving average for trend confirmation
- **DNA Spiral Visualization**: Unique spiral connection lines between the two main lines
- **Dynamic Color Coding**: Spiral colors change based on line convergence/divergence
- **Volume-Price Integration**: Combines price movements with volume density analysis
### Visual Elements
- **Red Main Line**: Primary LON indicator line
- **Green Moving Average**: Trend confirmation line
- **DNA Spiral Lines**: Dynamic connection lines with color-coded behavior
- **Zero Axis**: Reference line for trend direction
### Color Interpretation
#### Spiral DNA Colors
- **Red Spiral**: Lines are diverging (increasing distance) - potential trend continuation
- **Green Spiral**: Lines are converging (decreasing distance) - potential reversal signal
- **Gray Spiral**: No significant change in line distance
### Trading Strategy
#### Entry Signals
1. **Convergence Signal**: When spiral turns green (lines converging)
- May indicate potential reversal or consolidation
- Look for additional confirmation signals
2. **Divergence Signal**: When spiral turns red (lines diverging)
- May indicate trend continuation
- Consider following the trend direction
#### Trend Analysis
- **Above Zero**: Bullish momentum
- **Below Zero**: Bearish momentum
- **Line Crossovers**: Potential trend change signals
### Best Practices
- **Timeframe**: Works best on 1H, 4H, and Daily charts
- **Markets**: Effective on stocks, forex, and crypto
- **Confirmation**: Always combine with other technical analysis tools
- **Risk Management**: Use stop losses and position sizing
### Usage Tips
- Monitor spiral color changes for early trend signals
- Use zero axis crossovers for major trend direction
- Combine with volume analysis for stronger signals
- Avoid trading against strong spiral color trends
This indicator excels at identifying momentum shifts and trend dynamics through its innovative visual approach, making it ideal for swing trading and medium-term position management.

Previous Day/Week/Month - High/Lows + Open/Close (RC) 1.0it is an indicator for Previous Day, Week, Month's, Open-High-Low-Close

Morning & Evening Star (with Alerts)This indicator will print a marker whenever a morning or evening star pattern is created.
The condition is that the 3rd candle needs to have higher volume than the 2nd candle or the 2nd candle has to have 1.5x the volume of the first candle.
You can also create alerts with it.
Context is this pattern needs to be visible at key points as support & resistance, Supply and demand, Trendlines..etc

EUR/USD & DXY StrategyTVS entry module, SMT with DXY and EUR/USD, previous candle sweeps and SELL/BUY above and below opens.

Engulfing CandlesDetects Engulfing Candles with tha addition of an extra condition so that the volume of the engulfing candle is greater than the volume of the last four candles

Bollinger Bands Entry/Exit ThresholdsBollinger Bands Entry/Exit Thresholds
Author of enhancements: chuckaschultz
Inspired and adapted from the original 'Bollinger Bands Breakout Oscillator' by LuxAlgo
Overview
Pairs nicely with Contrarian 100 MA
The Bollinger Bands Entry/Exit Thresholds is a powerful momentum-based indicator designed to help traders identify potential entry and exit points in trending or breakout markets. By leveraging Bollinger Bands, this indicator quantifies price deviations from the bands to generate bullish and bearish momentum signals, displayed as an oscillator. It includes customizable entry and exit signals based on user-defined thresholds, with visual cues plotted either on the oscillator panel or directly on the price chart.
This indicator is ideal for traders looking to capture breakout opportunities or confirm trend strength, with flexible settings to adapt to various markets and trading styles.
How It Works
The Bollinger Bands Entry/Exit Thresholds calculates two key metrics:
Bullish Momentum (Bull): Measures the extent to which the price exceeds the upper Bollinger Band, expressed as a percentage (0–100).
Bearish Momentum (Bear): Measures the extent to which the price falls below the lower Bollinger Band, also expressed as a percentage (0–100).
The indicator generates:
Long Entry Signals: Triggered when the bearish momentum (bear) crosses below a user-defined Long Threshold (default: 40). This suggests weakening bearish pressure, potentially indicating a reversal or breakout to the upside.
Exit Signals: Triggered when the bullish momentum (bull) crosses below a user-defined Sell Threshold (default: 80), indicating a potential reduction in bullish momentum and a signal to exit long positions.
Signals are visualized as tiny colored dots:
Long Entry: Blue dots, plotted either at the bottom of the oscillator or below the price bar (depending on user settings).
Exit Signal: White dots, plotted either at the top of the oscillator or above the price bar.
Calculation Methodology
Bollinger Bands:
A user-defined Length (default: 14) is used to calculate an Exponential Moving Average (EMA) of the source price (default: close).
Standard deviation is computed over the same length, multiplied by a user-defined Multiplier (default: 1.0).
Upper Band = EMA + (Standard Deviation × Multiplier)
Lower Band = EMA - (Standard Deviation × Multiplier)
Bull and Bear Momentum:
For each bar in the lookback period (length), the indicator calculates:
Bullish Momentum: The sum of positive deviations of the price above the upper band, normalized by the total absolute deviation from the upper band, scaled to a 0–100 range.
Bearish Momentum: The sum of positive deviations of the price below the lower band, normalized by the total absolute deviation from the lower band, scaled to a 0–100 range.
Formula:
bull = (sum of max(price - upper, 0) / sum of abs(price - upper)) * 100
bear = (sum of max(lower - price, 0) / sum of abs(lower - price)) * 100
Signal Generation:
Long Entry: Triggered when bear crosses below the Long Threshold.
Exit: Triggered when bull crosses below the Sell Threshold.
Settings
Length: Lookback period for EMA and standard deviation (default: 14).
Multiplier: Multiplier for standard deviation to adjust Bollinger Band width (default: 1.0).
Source: Input price data (default: close).
Long Threshold: Bearish momentum level below which a long entry signal is generated (default: 40).
Sell Threshold: Bullish momentum level below which an exit signal is generated (default: 80).
Plot Signals on Main Chart: Option to display entry/exit signals on the price chart instead of the oscillator panel (default: false).
Style:
Bullish Color: Color for bullish momentum plot (default: #f23645).
Bearish Color: Color for bearish momentum plot (default: #089981).
Visual Features
Bull and Bear Plots: Displayed as colored lines with gradient fills for visual clarity.
Midline: Horizontal line at 50 for reference.
Threshold Lines: Dashed green line for Long Threshold and dashed red line for Sell Threshold.
Signal Dots:
Long Entry: Tiny blue dots (below price bar or at oscillator bottom).
Exit: Tiny white dots (above price bar or at oscillator top).
How to Use
Add to Chart: Apply the indicator to your TradingView chart.
Adjust Settings: Customize the Length, Multiplier, Long Threshold, and Sell Threshold to suit your trading strategy.
Interpret Signals:
Enter a long position when a blue dot appears, indicating bearish momentum dropping below the Long Threshold.
Exit the long position when a white dot appears, indicating bullish momentum dropping below the Sell Threshold.
Toggle Plot Location: Enable Plot Signals on Main Chart to display signals on the price chart for easier integration with price action analysis.
Combine with Other Tools: Use alongside other indicators (e.g., trendlines, support/resistance) to confirm signals.
Notes
This indicator is inspired by LuxAlgo’s Bollinger Bands Breakout Oscillator but has been enhanced with customizable entry/exit thresholds and signal plotting options.
Best used in conjunction with other technical analysis tools to filter false signals, especially in choppy or range-bound markets.
Adjust the Multiplier to make the Bollinger Bands wider or narrower, affecting the sensitivity of the momentum calculations.
Disclaimer
This indicator is provided for educational and informational purposes only.

Previous Day/Week/Month - High/Lows + Open/Close (RC)Its an indicator for previous day, week, month's OPEN HIGH LOW CLOSE

Dinkan Price Action Tool | DinkanSmart Money Price Action & SMC Toolkit – ChoCH | BOS | FVG | Liquidity | Trendlines
Unlock precision in trading with this advanced Smart Money Concept (SMC) Price Action Toolkit, tailored for traders who follow institutional price movements.
🧠 Key Features:
🔄 Change of Character (ChoCH): Instantly spot trend reversals.
🔨 Break of Structure (BOS): Confirm market direction shifts.
💧 Liquidity Zones (LQDT): Detect liquidity traps and sweep zones.
📏 Fair Value Gaps (FVG): Visualize imbalance areas for entry/mitigation.
📦 Order Blocks (OB): Auto-highlighted supply/demand zones with mitigation logic.
🧬 IDMT (Internal Displacement Market Trend): Microstructure shift indicator.
🔀 Mitigation Zones: Refined trade zones post liquidity events.
📐 Dynamic Smart Trendlines:
Drawn based on recent highs/lows and structural pivot points.
Aligns with ChoCH and BOS for confluence-based entries.
Helps identify pressure zones and breakout retests.
🎯 Perfect For:
Price action & SMC traders (ICT, Wyckoff, Smart Money models).
Scalping, intraday, and swing strategies.
Assets like NIFTY, Bank Nifty, Forex, Crypto, and Commodities.
📊 Clean Visuals:
Chart-friendly color coding.
Easy to understand even for intermediate traders.
⚠️ Disclaimer:
This indicator is for educational and informational purposes only. It does not constitute financial advice or a recommendation to buy or sell any security. The creator is not responsible for any profit or loss incurred while using this script. Always do your own research and consult with a licensed financial advisor before making trading decisions.

SMA Background & Table Indicator# SMA Background & Table Indicator - User Guide
## What is this Indicator?
The **SMA Background & Table Indicator** is a powerful TradingView Pine Script tool that provides instant visual feedback about a stock's position relative to key Simple Moving Averages (SMAs). Instead of cluttering your chart with multiple SMA lines, this indicator uses background colors and a clean table to show you everything you need to know at a glance. You can also set custom time frame for SMA (i.e. Daily chart for SMA calculation) while watching price action in 15 min chart. You will quickly know if SMA200 losses its level on a daily without you having a need to switch back and worth between time frames. A very cool feature.
## Key Features
### 🎨 Smart Background Colors
- **Green Background**: Price is above SMA200 - Bullish trend
- **Red Background**: Price is below SMA200 - Bearish trend
- **Orange Background**: Price is near SMA200 - Caution zone (within 1% threshold)
### 📊 Clean SMA Status Table
Located in the bottom-right corner, showing:
- **SMA5, SMA20, SMA50, SMA100, SMA200** values
- **Color-coded dots** for each SMA:
- 🟢 **Green**: Price is above this SMA (bullish)
- 🟠 **Orange**: Price is close to this SMA (within 0.5%)
- 🔴 **Red**: Price is below this SMA (bearish)
### ⏰ Flexible Timeframe Options
- **Chart Timeframe**: Calculate SMAs from your current chart timeframe
- **Custom Timeframe**: Choose any timeframe (1m, 5m, 1H, 1D, 1W, etc.) for SMA calculations
### 🎨 Full Customization
- **Table Text Size**: Tiny, Small, Normal, Large, or Huge
- **Table Background Color**: Any color you prefer
- **Table Font Color**: Customize text color to match your theme
- **Background Transparency**: Adjust from 0% (opaque) to 100% (transparent)
## How to Use
### Basic Usage
1. **Add the indicator** to any stock chart
2. **Watch the background color** for overall trend direction:
- Green = Bullish (above SMA200)
- Red = Bearish (below SMA200)
- Orange = Neutral/Transition zone
3. **Check the table** for detailed SMA analysis
### Advanced Usage
#### Timeframe Selection
1. Click on the indicator name in the chart
2. Click the **settings gear icon**
3. Enable **"Use Custom Timeframe for SMAs"**
4. Select your preferred **"Custom Timeframe"**
**Example**: You're trading on a 15-minute chart but want to see daily SMA levels:
- Set Custom Timeframe to "1D"
- Now you'll see how the current price relates to daily SMAs while still viewing 15-minute price action
#### Customizing Appearance
In the indicator settings:
- **Table Text Size**: Choose readability preference
- **Table Background Color**: Match your chart theme
- **Table Font Color**: Ensure good contrast
- **Background Transparency**: Balance visibility with chart clarity
## Trading Applications
### Trend Identification
- **Green background** = Look for long opportunities
- **Red background** = Look for short opportunities
- **Orange background** = Wait for clearer direction
### Support/Resistance Levels
- **Green dots** in table = SMAs acting as support
- **Red dots** in table = SMAs acting as resistance
- **Orange dots** = Key levels to watch for breakouts
### Multi-Timeframe Analysis
- Set custom timeframe to higher timeframe (e.g., daily)
- Trade on lower timeframe with higher timeframe SMA context
- Example: Day trading with daily SMA guidance
## Pro Tips
1. **Clean Charts**: This indicator eliminates the need for multiple SMA lines, keeping your chart clean while providing all essential information
2. **Quick Assessment**: One glance tells you the overall trend (background) and detailed SMA relationships (table)
3. **Multi-Timeframe Strategy**: Use daily SMAs on intraday charts for better trend context
4. **Customization**: Adjust colors and transparency to match your trading platform's theme for optimal visibility
5. **Threshold Understanding**:
- Background changes use 1% threshold (reduces noise)
- Table dots use 0.5% threshold (more sensitive)
This indicator transforms complex SMA analysis into simple, actionable visual information - perfect for both beginner and advanced traders!

Previous Day/Week/Month - High/Lows + Open/Close (RC)Its an indicator marking previous day and previous week and last month's high, low open, close.
