Multi-Market ORB (15-min)plots the ORB line for NY and LO session. this will also give an entry signal based on a retest of the top side or bottom side ORB.
Indicators and strategies

Crowding model ║ BullVision🔬 Overview
The Crypto Crowding Model Pro is a sophisticated analytical tool designed to visualize and quantify market conditions across multiple cryptocurrencies. By leveraging Relative Strength Index (RSI) and Z-score calculations, this indicator provides traders with an intuitive and detailed snapshot of current crypto market dynamics, highlighting areas of extreme momentum, crowded trades, and potential reversal points.
⚙️ Key Concepts
📊 RSI and Z-Score Analysis
RSI (Relative Strength Index) evaluates the momentum and strength of each cryptocurrency, identifying overbought or oversold conditions.
Z-Score Normalization measures each asset's current price deviation relative to its historical average, identifying statistically significant extremes.
🎯 Crowding Analytics
An integrated analytics panel provides real-time crowding metrics, quantifying market sentiment into four distinct categories:
🔥 FOMO (Fear of Missing Out): High momentum, potential exhaustion.
❄️ Fear: Low momentum, potential reversal or consolidation.
📈 Recovery: Moderate upward momentum after a downward trend.
💪 Strength: Stable bullish conditions with sustained momentum.
🖥️ Visual Scatter Plot
Assets are plotted on a dynamic scatter plot, positioning each cryptocurrency according to its RSI and Z-score.
Color coding, symbol shapes, and sizes help quickly identify main market segments (BTC, ETH, TOTAL, OTHERS) and individual asset conditions.
🧩 Quadrant Classification
Assets are categorized into four quadrants based on their momentum and deviation:
Overbought Extended: High RSI and positive Z-score.
Recovery Phase: Low RSI but positive Z-score.
Oversold Compressed: Low RSI and negative Z-score.
Strong Consolidation: High RSI but negative Z-score.
🔧 User Customization
🎨 Visual Settings
Bar Scale: Adjust the scatter plot visual scale.
Asset Visibility: Optionally display key market benchmarks (TOTAL, BTC, ETH, OTHERS).
Gradient Background: Enhances visual interpretation of asset clusters.
Crowding Analytics Panel: Toggle the analytics panel on/off.
📊 Indicator Parameters
RSI Length: Defines the calculation period for RSI.
Z-score Lookback: Historical lookback period for normalization.
Crowding Alert Threshold: Sets alert sensitivity for crowded market conditions.
🎯 Zone Settings
Quadrant Labels: Displays descriptive labels for each quadrant.
Danger Zones: Highlights extreme RSI levels indicative of heightened market risk.
📈 Visual Output
Dynamic Scatter Plot: Visualizes asset positioning clearly and intuitively.
Gradient and Grid: Professional gridlines and subtle gradient backgrounds assist visual assessment.
Danger Zone Highlights: Visually indicates RSI extremes to warn of potential market turning points.
Crowding Analytics Panel: Real-time summary of market sentiment and asset distribution.
🔍 Use Cases
This indicator is particularly beneficial for traders and analysts looking to:
Identify crowded trades and potential reversal points.
Quickly assess overall market sentiment and individual asset strength.
Integrate a robust momentum analysis into broader technical or fundamental strategies.
Enhance market timing and improve risk management decisions.
⚠️ Important Notes
This indicator does not provide explicit buy or sell signals.
It is intended solely for informational, analytical, and educational purposes.
Past performance and signals are not indicative of future market results.
Always combine with additional tools and analysis as part of comprehensive decision-making.

GG ADRGG ADR Indicator
A compact volatility and price position table displaying key daily metrics:
• ADR% – Average Daily Range Percentage over a custom period
• ATR – Average True Range (daily), measuring market volatility
• LoD Dist – Distance from the current close to the Daily Low, expressed as a % of the ATR
• 8 EMA Distance – % distance from the current price to the 8-day EMA (based on daily timeframe only)
Customize visibility of each metric using the built-in input toggles. Ideal for tracking intraday positioning relative to historical ranges and key dynamic levels.
Based on ADR Indicator by © ArmerSchlucker

TrendZonesTrendZones
This is an indicator which I use, have tested, tweaked and added features to for use in my trend following investing system. I got the idea for it when for some reason I was looking for a dynamic reference to measure the height of a channel or something. In search of this I made MA’s of the high and low borders of a Donchian channel which turned out to be two near parallel and stunningly smooth curves. This visual was so appealing that I immediately tried to turn it into a replacement for the KeltCOG which I previously used in my system. First I created a curve in the middle of the upper and lower curves, which I called COG (Center Of Gravity). Then I decided to enter only one lookback and let the script create a Donchian channel with half the lookback and use this to create the curves with an MA of whole lookback. For this reason the minimum lookback is set to 14, enough room for the Donchian Channel of 7 periods. This Donchian ChanneI has a special way of calculating the borders, involving a 5 period Median value. Thanks to this these borders are really a resistance and support level, which won’t change at a whim, e.g. when a ‘dead cat bounce’ occurs. I prevented the Donchian channel to show itself between the curves and only pop out from behind these. These pop outs now function as “strong trend zones”. I gave it colors (blue:-strong up, green: moderate up, orange: moderate down, red: strong down, near COG: gray, curves horizontal: gray) and it looked very appealing. I tested it in different time frames. In some weekend, when I was bored, I observed for a few hours the minute chart of bitcoin. It turned out that you can reliably tell that an uptrend ends when the candles go under the COG beginning a downtrend. Uptrend starts again once the candles go above COG. As Trends on minute charts only last around half an hour, this entertainment made the potential of this indicator very clear to me in just one afternoon.
Risk Management, Safe Level and Logical Stops.
In the inputs are settings for “Risk Tolerance”, and to activate “Show Logical Stop Level” (activated in example chart) and “Show Safe Level”. As a rule of thump a trade should not expose the invested capital to a risk of losing more than 2 percent. I divided my investment capital in ten equal parts which are allocated to ten different stocks or other instruments or kept liquid. This means that when a position is closed by triggering a Stop with a loss of 20 percent, the invested capital suffers only 2 percent (20% x 10% = 2%). This is why the value for “Risk Tolerance” has a default of 20. Because I put my Stops on the lower curve, a “Safe Level” can be calculated such that when you buy for a price below or at this level, the stop will protect the position sufficiently. Because I only buy when the instrument is in uptrend, the buying price should be between COG and Safe Level. Although I never do that, putting the stop at other curves is feasible and when you want to widen the stop (I never lower my stops btw) in a downtrend situation, even 1 ATR below the “Low Border”. I call these “Logical Stop Levels”, marked with dark green circles on the lower curve when safe buying by placing the Stoploss on this curve is possible, gray circles on the other curves, on the Upper Curve navy when price enters very profitable level. In a downtrend situation maroon circles appear.
Target lines
When I open a position I always set a Stoploss and a Target, for this purpose two types of Target values can be set and corresponding Target lines activated. These lines are drawn above the “High Border” at the set distance. If one expects some price to be used, differences will occur.
Other Features
Support Zone, this is 1 ATR below the “Low Border”, the maroon circles of the “Logal Stops” are placed on this “Support level”.
Stop distance and Channel Width. (activated in example chart) These are reported in a two cell table in the right lower corner of the main panel. I created this because I want to be able to check the volatility, whether the channel shows a situation in which safe buying in most levels of the channel is possible or what risk you take when you buy now and set the Stop at the nearest logical level (which is not always the “Lower curve”). This feature comes in handy for creating a setup I propose in the “Day Trading Fantasy” below.
Some General and User Settings. I never activate this, perhaps you will.
Use Of TrendZones In My System.
Create a list of stocks in uptrend. I define ‘stock in uptrend’ as in uptrend zone in all three monthly, weekly and daily charts, all three should at the same time be in uptrend. The advantage of TrendZones is that you can immediately see in which zone the candle moves.
Opening a position in a stock from the above list. I do this only when in both the daily and weekly the green dot on the lower curve indicates a buying opportunity. This is usually not the case in most of the items of the list, this feature thus provides a good timing for opening a position. Sometimes you need to wait a few weeks for this to happen.
Setting a target over a position. For this I use the Target percent line of the weekly chart with the default value of 10.
Updating the Stoploss and Target values. Every week or two weeks I set these to the new values of the “Lower Curve” and the Target line of the weekly. Attention: never shift down Stops, only up or let them stay the same when the curve moves down. I never use Stop levels on other curves.
I Check the charts whenever I like to do this. Close the position when the uptrend obviously shifts down. Otherwise I let the profits run until the Target triggers which closes the position with some profit.
For selecting stocks an checking charts for volume events, I also use a subpanel indicator called “TZanalyser”, which borrows the visual of my “Fibonacci Zone Oscillator”, is based on TrendZones and includes code from my REVE indicators. I intend to publish that as well.
Day Trading Fantasy.
Day trading is an attempt to earn a dime by opening a position in the morning and close it during the day again with a profit (or a loss). Before the market closes, you close all day trading positions.
In my fantasy the “Logical Stop Level” is repurposed for use as entry point and the ATR-based Target line is used to provide a target setting in an intraday chart, like e.g. 15 minute. To do this the “Safe Level” should be limited to between Channel width and COG. This can be done by showing “Safe Level” and “Channel Width” and then set “Risk Tolerance” to around the shown Channel Width. In this setting you can then wait for the green circle to show up for entering your trade and protect it with the stop.
I don’t know if this works fine or if it’s better than other day trade systems, because I don’t do day trading.
Take care and have fun.


Bitcoin Cycle Log-Curve (JDK-Analysis)Important: The standard parameters provided in the script are specifically tuned for the TradingView Bitcoin Index chart on a monthly timeframe on logarithmic scale, and will yield the most accurate visual alignment when applied to that dataset. (more below)
This very simple script visualizes Bitcoin’s long-term price behavior using a logarithmic regression model designed to reflect the cyclical nature of Bitcoin’s historical market trends. Unlike typical technical indicators that react to recent price movements, this tool is built on the assumption that Bitcoin follows an exponential growth path over time, shaped by its fixed supply structure and four-year halving cycles.
The calculation behind the curved bands:
An upper boundary, a lower boundary, and a central midline, are calculated based on logarithmic functions applied to the bar index (which serves as a proxy for time). The upper and lower bounds are defined using exponential formulas of the type y = exp(constant + coefficient * log(bar_index)), allowing the curves to evolve dynamically over time. These bands serve as a macro-level guide for identifying periods of historical overvaluation (upper red curve) and undervaluation (lower green curve), with a central black curve representing the geometric average of the two.
How to customize the parameters:
The lower1_const and upper1_const values vertically shift the respective lower and upper curves—more negative values push the curve downward, while higher values lift it.
The lower1_coef and upper1_coef control the steepness of the curves over time, with higher values resulting in faster growth relative to time.
The shift_factor allows for uniform vertical adjustment of all curves simultaneously.
Additionally, the channel_width setting determines how far the mirrored bands extend from the original curves, creating a visual “channel” that can highlight more conservative or aggressive valuation zones depending on preference.
How to use this indicator:
This indicator is not intended for short-term trading or intraday signals. Rather, it serves as a contextual framework for long-term investors to identify high-risk zones near the upper curve and potential long-term value opportunities near the lower curve. These areas historically align with cycle tops and bottoms, and the model helps to place current price action within that broader cyclical narrative. While the concept draws inspiration from Bitcoin’s halving-driven market cycles and exponential adoption curve, the implementation is original in its use of time-based logarithmic regression to define dynamic trend boundaries.
It is best used as a strategic tool for cycle analysis, macro positioning, and trend anchoring—rather than as a short-term signal provider.

SR360 OSCILLATOR 2025Unlock deeper insights into momentum and trend strength with the SR360 Oscillator 2025, a high-precision dual-indicator system designed for traders focusing on NSE stocks.
🚀 Key Features:
🔹 GVR Oscillator (RSI on VWAP)
Identify powerful shifts in price momentum using a smart blend of RSI and VWAP — ideal for catching trend reversals and breakouts.
Dynamic coloring: 🔴 Overbought, 🟢 Oversold, 🔵 Neutral zones
🔹 Multi-Symbol Trend Table (Supertrend or EMA)
Stay ahead with a real-time trend dashboard for RELIANCE, SBIN, INFY, HDFCBANK, TCS, and more.
Choose your trend logic: Supertrend or EMA crossover
Custom watchlist + include current chart symbol
💼 Who’s It For?
Intraday & swing traders in the Indian equity markets
Analysts seeking clean, trend-verified setups
Anyone needing a reliable trend/momentum combo tool

BTCUSD Strategy %TP/%SL + Leverage with AlertsFuture segment alerts on BUY and SELL - Entry/Exit Levels Alerts for BTCUSD updated on 12/07/2025

Innotrade Market Cycle Orderflow + Volatiliy BandThis indicator provides a comprehensive and visually intuitive view of market momentum and volatility. It moves beyond standard oscillators by combining a powerful composite momentum engine—visualized as "Orderflow Candles"—with a dynamic Volatility Band (VB) Channel.
Instead of just telling you if the market is overbought or oversold, this tool helps you understand the energy behind market moves. Is momentum strong and sustained? Is the market coiling up for a breakout? Is a trend reaching its exhaustion point? This indicator is designed to answer those questions.
Core Components
Market Cycle (MC) Orderflow Candles: These are not price candles. Each candle is a visual representation of aggregate momentum, calculated from a weighted blend of three powerful oscillators: the Detrended Crystal Oscillator (DCO), the Relative Strength Index (RSI), and the Stochastic RSI.
Green Candles: Indicate rising buying momentum.
Red Candles: Indicate rising selling momentum.
Wicks: Show the highest and lowest momentum levels reached during the bar.
The VB (Volatility Band) Channel: This is the key addition that provides dynamic context. Based on the classic Traders Dynamic Index (TDI) logic, these blue bands are calculated using the RSI's standard deviation.
Bands Expand: Volatility is high; momentum is strong.
Bands Contract (Squeeze): Volatility is low; the market is consolidating and building energy for its next move.
Moving Average (Yellow Line): A simple moving average of the MC Orderflow's "close." It acts as a baseline, helping to spot short-term shifts in momentum. A crossover of the MA is often the first sign of a change in direction.
Trading Strategies & Interpretations
The real power of this indicator comes from observing the interaction between the MC Orderflow Candles and the VB Channel.
Strategy 1: The Squeeze and Breakout
This classic volatility strategy helps you pinpoint moments of market consolidation and enter just as a new, powerful trend begins.
The Setup: Look for the blue VB Channel bands to become very narrow and tighten around the MC Orderflow candles. This is the "squeeze," representing a period of low volatility and market indecision.
The Signal:
Bullish Breakout: A strong green MC candle breaks out of the squeeze, pushing the upper VB band open and crossing above the yellow MA. This signals that buying pressure is unleashing.
Bearish Breakout: A strong red MC candle breaks down from the squeeze, pushing the lower VB band open and crossing below the yellow MA. This signals that selling pressure is taking control.
Strategy 2: Riding the Trend ("Walking the Band")
This technique helps you stay in winning trades longer by confirming the strength and sustainability of a trend.
The Setup: You are in an established trend (e.g., a long position after a bullish breakout).
The Signal to Stay In: As long as the MC Orderflow candles are consistently "riding" along the outer edge of the VB Channel (the upper band in an uptrend, lower band in a downtrend), it confirms that momentum is strong and sustained. Don't exit prematurely.
The Signal of Weakness: If the candles begin to fall away from the outer band and move back towards the 50 midline or cross the yellow MA, it signals that momentum is fading and it may be time to take profits or tighten your stop.
Strategy 3: Exhaustion and Reversal Signals
This is a more aggressive, counter-trend strategy designed to identify points where a trend has become over-extended and is likely to reverse.
The Setup: The market has made a fast, parabolic move, and the VB Channel bands are very wide.
The Signal: Look for an MC Orderflow candle that pokes outside of the VB Channel. This signals a climactic, often emotional, and unsustainable move.
Sell Signal: The high of an MC candle pierces above the upper VB band, and the next candle's close is back inside the channel. This suggests the uptrend is exhausted.
Buy Signal: The low of an MC candle pierces below the lower VB band, and the next candle's close is back inside the channel. This suggests a capitulation bottom.
A Practical Example: Tying It All Together
The Squeeze: You spot the blue VB Channel bands tightening, signaling low volatility.
The Entry: A green MC candle breaks out of the top of the squeeze, expanding the upper band. You enter a long position.
The Trend: The green MC candles continue to form, "walking the band" higher. You hold your position.
The Exit: After a strong run, an MC candle's high briefly pokes outside the upper band. The next candle is red and closes back inside the channel. This is your exhaustion signal to exit the trade and lock in profits.
Disclaimer: This indicator is a tool for market analysis and should not be considered financial advice. All trading involves substantial risk. Always use proper risk management and trade responsibly.

SR 360 AI Algo 2025SR 360 AI Algo 2025 — By Stock Research 360
SR 360 AI Algo 2025 Charting is a SEBI registered Research Analyst Proprietary coding , a powerful multi-timeframe S & D indicator combined with trend confirmation and momentum-based trade signals.
🔍 Key Features:
Automatically Detects and plots high-probability demand and supply zones with optional retests and break alerts.
Analyses Multi-Timeframe up to 3 timeframes simultaneously to align higher-timeframe context.
Triple EMA (TEMA): Built-in trend indicator with dynamic color shift for visual cues.
MACD Filter: Optional MACD-based trend confirmation to filter out noise.
Buy/Sell Signals: Generates confirmed entries with optional labels or plot shapes.
Retest & Break Alerts: Real-time alerts when price revisits or breaks important zones.
Smart Zone Merging: Combines overlapping SD zones for cleaner charting.
⚙️ Highly Customizable:
Adjust the number of zones, momentum candle filters, timeframe resolution, and label visibility.
Enable or disable features like TEMA, trend coloring, percent tracker, and alert notifications.
🔔 Use Cases:
Ideal for intraday and swing traders looking to trade around institutional order blocks.
Works great with breakout/retest strategies and confluence-based setups.
💡 Best suited for experienced traders using Price Action + Trend + Volume Zones to make informed entries and exits.
📢 Don't forget to turn on alerts for retests and zone breaks to never miss a key move.

JWs EMA CrossoversJWs EMA Crossovers - A clean Pine Script v6 indicator that displays 8 and 21 period exponential moving averages with arrow signals when they cross. Shows bullish arrows when the faster EMA crosses above the slower EMA and bearish arrows when it crosses below. Includes customizable EMA periods and built-in alert conditions for trend change notifications. Perfect for identifying trend reversals without chart clutter.

Gil Stocks Custom WatermarkBased on Micha Stock
Adding Sell Based on ATR
stock price
i have noting to say so i write rowa

Intraday vs Overnight OBV🔍 Purpose
This indicator provides a volume-weighted cumulative flow model that mimics On-Balance Volume (OBV) logic but splits the volume impact into intraday vs. overnight sessions. It allows traders to track how volume contributes to price movement in each session and identify whether buying/selling pressure is stronger during or outside of regular trading hours.
This indicator attempts to alleviate some of the downfalls of the standard OBV indicator, which only looks at total volume and total direction. The price of stocks generally behaves extremely differently during market hours and outside market hours, and many of the large moves happen outside of regular market hours on low volume.
⚙️ Core Features
1) OBV-style calculation:
If price increases → volume is added to the OBV stream.
If price decreases → volume is subtracted.
If price is flat → OBV remains unchanged.
2) Session splitting:
Intraday session: movement from today's open to close.
Overnight session: movement from yesterday’s close to today’s open.
Volume is split proportionally between these two periods based on user input.
3) Four visualization modes:
"Intraday" — plots only OBV from intraday price movement.
"Overnight" — plots only OBV from overnight price movement.
"Aggregate" — plots the sum of intraday and overnight OBV for a holistic view.
"Both Intraday and Overnight" — plots intraday and overnight OBV separately on the same chart.
📐 Inputs
1) Synthetic OBV Type:
"Intraday" — Show OBV from open to close only.
"Overnight" — Show OBV from prior close to today's open only.
"Aggregate" — Show a single line combining both.
"Both Intraday and Overnight" — Show both lines on the same chart.
2) Estimated Overnight Volume %:
Percentage of total daily volume assumed to occur during extended hours.
The rest is allocated to regular session (intraday).
Default: 20% overnight, 80% intraday.
🧮 How It Works
Volume Splitting:
Total bar volume is split into overnight Volume and intraday Volume:
Intraday change is the difference between today’s close and open.
Overnight change is the difference between today’s open and yesterday’s close.
Session OBV Calculations:
OBV is incremented/decremented by the session's allocated volume, depending on whether the session’s price change was positive or negative.
Aggregate OBV:
Combines both session deltas for a holistic volume flow view.
📊 Interpretation
Rising OBV (any stream) suggests accumulation; falling OBV suggests distribution.
Divergences between price and OBV lines (especially overnight vs. intraday) can reveal where hidden buying/selling is occurring.
Comparing intraday vs overnight OBV can help:
Spot whether institutional demand is building off-hours.
Detect retail vs. institutional behavior (retail trades often dominate intraday; institutional may prefer after-hours).
💡 Use Cases
Identify whether overnight gaps are supported by overnight volume momentum.
Detect accumulation in low-volume overnight sessions.
Compare intraday and overnight strength during earnings season or news events.
Complement traditional OBV by seeing session-based breakdowns.

ORB Norman (2 Sessions, Auto Timezone)ORB Norman (2 Sessions, Auto Timezone)
This script plots Opening Range Breakout (ORB) levels for two configurable sessions. It’s designed for intraday traders—especially in futures markets like Gold (GC), Nasdaq (NQ), and S&P (ES)—who trade based on early session breakouts or range rejections. Unlike standard indicators, this tool auto-adjusts for timezones based on the instrument, ensuring precise session alignment.
Features:
Automatically adjusts for NQ/ES (Chicago time) and GC (New York time) based on the symbol.
Plots high, low, and optional midpoint lines for each session.
Clean, minimal settings with visual separation for better usability.
Ray extension length is fully customizable.
Works on any intraday chart (recommended: 5–15 minute timeframes).
Includes customizable session times, colors, ray length, and an optional midpoint line.
Default Sessions:
Session 1:
‣ 07:00–08:00 EST for GC
‣ 06:00–07:00 CT for NQ/ES
Session 2:
‣ 09:30–09:45 EST for GC
‣ 08:30–08:45 CT for NQ/ES
This tool is ideal for traders who scalp the early morning breakout or look for range rejections based on the opening auction.
This script was developed from scratch based on the author's own intraday trading needs.

JWs Algo — 8/21 EMA Crossover📊 JWs Algo — 8/21 EMA Crossover (Visual Study)
JWs Algo is a clean, momentum-based visual tool that highlights key trend reversal points using a classic 8/21 EMA crossover strategy.
This study does not place trades but instead helps traders visually spot potential buy/sell moments using:
📈 Green emoji label below candles when the 8 EMA crosses above the 21 EMA (bullish signal)
📉 Red emoji label above candles when the 8 EMA crosses below the 21 EMA (bearish signal)
🔍 Features:
Smooth and responsive EMA trend lines
Clear visual cues without clutter
Emoji signal bubbles with custom-colored backgrounds for enhanced readability
Works on any asset and timeframe
Ideal for trend-following traders and EMA-based setups
🧠 Use Cases:
Confirm momentum shifts visually
Use alongside other indicators (RSI, MACD, etc.)
Build discretionary or rules-based entries around clean signals

JWs Algo📈 JWs Algo — 8/21 EMA Crossover Strategy with Take Profit and Stop Loss
JWs Algo is a momentum-based trading strategy that uses a classic 8/21 Exponential Moving Average (EMA) crossover to identify trend reversals and generate long and short trade signals. It includes built-in take profit and stop loss parameters to manage risk and lock in profits automatically.
🔍 Core Logic
Long Entry: When the 8 EMA crosses above the 21 EMA (bullish signal)
Short Entry: When the 8 EMA crosses below the 21 EMA (bearish signal)
Exit: Each position is exited automatically upon hitting either:
A take profit, defined as a percentage gain from entry
A stop loss, defined as a percentage loss from entry
✅ Key Features
Supports both long and short trades
Configurable take profit (%) and stop loss (%)
Prevents overlapping trades — the strategy waits for one trade to fully close before opening another
Clean visualization with:
Buy and sell signal markers
Plotted 8 EMA and 21 EMA for trend context
Compatible with any symbol and timeframe
⚙️ Recommended Use
This strategy works best on trending markets and can be adapted for:
Crypto
Forex
Stocks
Indices
Tune the TP/SL values and timeframe based on asset volatility for best results. Backtest thoroughly.

Meta Bot ENGLISH⚙️ Meta Bot – A Smart System for Custom Bot Creation
Meta Bot is more than just a trading bot – it's a full system for creating customized bots with advanced capabilities, allowing you to build your own unique strategy from thousands of possible combinations of indicators, trends, and entry confirmations.
The bot runs on the TradingView platform and gives you full control over timing, logic, and execution – result-driven and adaptable to any trading style.
🕒 Full Control Over Trading Sessions
The system allows you to define up to 3 sessions per day, select specific days, set start/end times, and automatically block trades outside defined hours.
You can also set profit/loss limits per day, week, or session, as well as limit the number of trades to maintain full control over your performance.
📊 Precision Matching to Your Trading Style
Choose up to 2 core market trends from a variety of options:
True Day/Week Open
Higher Time Frame Sequences
SMT Analysis
Defined Session High/Low
Each trend can be fully customized – including time frame, candle count, open points, and more – to fit any market or trading method.
🧠 Modular Indicator System
Build your entry logic using up to 4 different indicators per direction, with full customization available for each one:
RSI, MACD, STOCHASTIC, VWAP
Volume, MA Ribbon, Bollinger Bands
CHOCH, RSI Divergence, Precision Candle, AMD
You can adjust thresholds, extremes, validation ranges, and more based on your trading preferences and the nature of each indicator.
🎯 Advanced Entry Confirmations
- Market Order – instant execution
Limit Order by ticks
Inside Bar – pattern-based entry
FVG – full control with 3 entry types
Trade Reversal – execute opposite trades based on confirmations
🛡 Precise Exit Conditions
- Stop loss by ticks or market structure (Swing High/Low)
- Take profit by RR ratio, fixed ticks, or pivot levels
- Control over candle structure for identifying valid exit points
🧩 Flexible System to Build Unlimited Bot Variants
Thanks to its modular structure, Meta Bot isn’t just a single bot – it’s a **platform for building your own bots**.
With unlimited combinations of trends, indicators, entry/exit conditions, time filters, and sessions – you can fine-tune every strategy, compare versions, and develop a system that fits your exact needs.
✅ Built for All Trader Levels – Including Evaluation Accounts
Meta Bot is fully compatible with funded account programs (like Apex, FTMO, and others), with built-in risk controls, trading hour limitations, and trade count restrictions.
Its user-friendly interface makes it suitable for beginners, while offering advanced logic control for experienced traders.
✅ What You Get:
Modular system with control over every component
Battle-tested logic for changing market conditions
Maximum flexibility with high execution precision
Easy-to-use interface with intuitive configuration

ATR Trailing + Alerts + Price LabelsATR Trend is a clean and intelligent trend-following overlay built for traders who want clarity during both trending and ranging markets.
This indicator dynamically detects bullish and bearish market trends using the Average True Range (ATR), applying a confirmation-based approach to filter out false signals and minor pullbacks.
The trend line is:
Blue 🔵 during uptrends.
Black ⚫ during downtrends.
Continuous, recalculating only when the market truly shifts — not just when price temporarily crosses the line.
When a confirmed trend reversal occurs:
A 🔼 or 🔽 label shows the exact price of the flip.
An alert can be triggered to notify the user immediately.
💡 Features:
✅ Single-line trend direction
✅ Filters out short-term noise
✅ Exact price labeling on trend change
✅ Built-in alerts for up/down trend shifts
⚙️ Inputs:
ATR Period – Length of ATR calculation (default: 14)
ATR Multiplier – Offset for trend line placement (default: 2.0)
Flip Sensitivity – Number of bars required to confirm a trend reversal (default: 3)
This tool is suitable for:
Swing traders avoid false breakouts
Scalpers looking for high-probability trend entries
Algorithmic setups requiring structured trend logic

My strategyThe Combination 1 strategy is a precision-based breakout and retest setup designed for the EUR/USD 2-minute chart, operating during the Asia and London sessions (UTC-4). It identifies a unique consolidation zone where price, the 20-period SMA, and the 200-period SMA all align within a tight 2-pip range, signaling potential buildup. Once price breaks 10 to 15 pips above this consolidation area, the strategy waits for a retest—specifically, a wick that touches the zone, followed by a bullish close. This confirms buyer strength and triggers a BUY alert, with the take profit set at the breakout high and the stop loss at the recent swing low. This strategy filters for clean trends and disciplined breakouts, minimizing noise and maximizing precision.

BTCUSD 3min LA Timezone | USdailyTrade.com### 📈 BTCUSD 3-Minute Opening Range Breakout Strategy (One Trade Per Day – LA Timezone)
This strategy is a **3-minute Opening Range Breakout (ORB)** system designed specifically for **BTCUSD**, optimized for the **Los Angeles trading session**.
It captures early volatility and momentum by identifying the **first 5-minute range** after the market opens (LA time). The system enters:
- 📈 A **long trade** when price breaks above the high of the range
- 📉 A **short trade** when price breaks below the low
(based on clean breakout price action)
---
### 🔑 Key Features:
- ⏱ **Time-based filter**
Trades only during a specific time window (first **30 minutes** after session opens)
- 🎯 **Dynamic Stop-Loss and Take-Profit**
Targets are calculated based on **range size** and **ATR**, adapting to volatility
- 🚫 **One Trade Per Day**
Limits execution to just one high-probability trade per day – no overtrading
- 🔔 **Built-in Buy/Sell Alerts**
Alerts are automatically triggered when a valid **BUY** or **SELL** signal appears
- ⚡ **Built for volatility**
Optimized for the sharp, directional moves commonly seen in BTCUSD during LA open
---
### 👤 Who Is It For?
This script is ideal for **active intraday traders** who want to trade the **BTCUSD opening breakout** with:
- Predefined risk
- Clear entry/exit logic
- **One high-quality signal per day**
- **Real-time alert notifications**
- Automated trade management
---
> 📌 Created by (www.USdailyTrade.com)
> 💡 AI-powered strategies for **Forex**, **U.S. Stocks**, and **Gold**

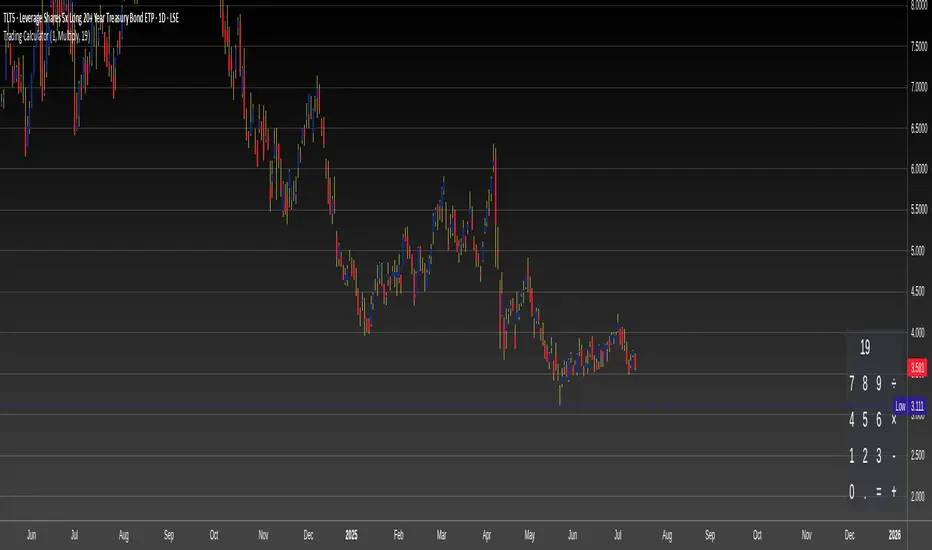
Trading CalculatorTrading Calculator Indicator
VIBE CODED WITH GROK 3
The Trading Calculator is a Pine Script indicator designed to perform quick and useful trading-related calculations directly on your chart. It allows traders to execute basic arithmetic operations—such as addition, subtraction, multiplication, and division—as well as calculate percent change and average using either numerical values or trading variables (e.g., close, open, high, low, volume). The indicator displays its results in a table that resembles a calculator interface, making it both functional and visually intuitive. Unlike typical indicators, it does not overlay on the price chart but instead appears in a separate pane.
Inputs
Formula (new | old): First value or variable (e.g., 100, close, close ). Example: close uses the current closing price.
Operator: Mathematical operation (e.g., Plus, Minus, Multiply). Example: Plus adds the two inputs.
Second Input: Second value or variable (e.g., 50, open, close ). Example: open uses the current opening price.
Golden Ratio Trend Persistence [EWT]Golden Ratio Trend Persistence
~~~~~~~~~~~~~~~~~~~~~~~~~~~~~~~~~~~~~~~~~~~~
Overview
The Golden Ratio Trend Persistence is a dynamic tool designed to identify the strength and persistence of market trends. It operates on a simple yet powerful premise: a trend is likely to continue as long as it doesn't retrace beyond the key Fibonacci golden ratio of 61.8%.
This indicator automatically identifies the most significant swing high or low and plots a single, dynamic line representing the 61.8% retracement level of the current move. This line acts as a "line in the sand" for the prevailing trend. The background color also changes to provide an immediate visual cue of the current market direction.
~~~~~~~~~~~~~~~~~~~~~~~~~~~~~~~~~~~~~~~~~~~~
The Power of the Golden Ratio (61.8%)
The golden ratio (ϕ≈1.618) and its inverse (0.618, or 61.8%) are fundamental mathematical constants that appear throughout nature, art, and science, often representing harmony and structure. In financial markets, this ratio is a cornerstone of Fibonacci analysis and is considered one of the most critical levels for price retracements.
Market movements are not linear; they progress in waves of impulse and correction. The 61.8% level often acts as the ultimate point of support or resistance. A trend that can hold this level demonstrates underlying strength and is likely to persist. A breach of this level, however, suggests a fundamental shift in market sentiment and a potential reversal.
~~~~~~~~~~~~~~~~~~~~~~~~~~~~~~~~~~~~~~~~~~~~
How to Use This Indicator
This indicator is designed for clarity and ease of use.
Identifying the Trend : The visual cues make the current trend instantly recognizable.
A teal line with a teal background signifies a bullish trend. The line acts as dynamic support.
A maroon line with a maroon background signifies a bearish trend. The line acts as dynamic resistance.
Confirming Trend Persistence : As long as the price respects the plotted level, the trend is considered intact.
In an uptrend, prices should remain above the teal line. The indicator will automatically adjust its anchor to new, higher lows, causing the support line to trail the price.
In a downtrend, prices should remain below the maroon line.
Spotting Trend Reversals : The primary signal is a trend reversal, which occurs when the price closes decisively beyond the plotted level.
Potential Sell Signal : When the price closes below the teal support line, it indicates that buying pressure has failed, and the uptrend is likely over.
Potential Buy Signal : When the price closes above the maroon resistance line, it indicates that selling pressure has subsided, and a new uptrend may be starting.
Think of this tool as an intelligent, adaptive trailing stop that is based on market structure and the time-tested principles of Fibonacci analysis.
~~~~~~~~~~~~~~~~~~~~~~~~~~~~~~~~~~~~~~~~~~~~
Input Parameters
You can customize the indicator's sensitivity through the following inputs in the settings menu:
Pivot Lookback Left : This number defines how many bars to the left of a candle must be lower (for a pivot high) or higher (for a pivot low) to identify a potential swing point. A higher value will result in fewer, but more significant, pivots being detected.
Pivot Lookback Right : This defines the number of bars that must close to the right before a swing point is confirmed. This parameter prevents the indicator from repainting. A higher value increases confirmation strength but also adds a slight lag.
Fibonacci Ratio : While the default is the golden ratio (0.618), you can adjust this to other key Fibonacci levels, such as 0.5 (50%) or 0.382 (38.2%), to test for different levels of trend persistence.
Adjusting these parameters allows you to fine-tune the indicator for different assets, timeframes, and trading styles, from short-term scalping to long-term trend following.
Sl/TP Daynamic Based on ATRATR Stop Loss Compact with Lines
By @Salarbb
This script calculates dynamic Stop Loss and Take Profit levels based on the Average True Range (ATR). It’s designed for traders who want a clean and flexible way to map volatility-adjusted SL and TP zones directly on the chart.
Features:
Uses a custom entry price or defaults to the current candle close
Calculates Long and Short stop loss and take profit levels using adjustable ATR and R multipliers
Draws visual lines for SL and TP levels with optional toggle controls
Includes a compact table showing SL, risk value (R), and TP for both long and short directions
Table position and visibility settings are fully user-configurable
This tool is handy for traders who size their positions externally and want to align stop zones with actual market volatility instead of arbitrary numbers. It’s simple, focused, and designed for practical use.
Use it as part of your planning process, not as a signal or system.
Drop a message on Twitter for me with your TradingView ID. I will grant you access for free.
x.com/salarbb
