Smart Money OscillatorSmart Money Oscillator — Description and Interpretation
The Smart Money Oscillator is a momentum-style indicator designed to highlight when informed, institutional traders (“smart money”) are likely accumulating (buying) or distributing (selling) assets.
Indicators and strategies

Smart Money vs Dumb Money ZonesSmart Money vs Dumb Money Buy & Sell Signals on Candle Chart
Smart Money Signals
Smart Money Buy: Indicates institutional or informed traders accumulating positions. This usually happens when volume spikes on a down candle near recent lows — a sign of savvy buying before price rises.
Smart Money Sell: Signals institutional distribution. Typically shown by volume spikes on up candles near recent highs — suggesting smart traders are offloading positions before a potential drop.
Dumb Money Signals
Dumb Money Buy: Reflects retail traders chasing price momentum at overbought levels, often buying near local or recent highs based on hype or fear of missing out.
Dumb Money Sell: Represents panic selling by retail traders at oversold levels near recent lows, often selling in fear as price falls further.
Visual on Candle Chart:
This data is restricted to paid members
Why It Matters:
Smart Money signals help identify potential turning points caused by large, well-informed players. Following these can help you align trades with market movers.
Dumb Money signals warn of retail emotional extremes — often contrarian trade opportunities when the crowd is overly optimistic or fearful.

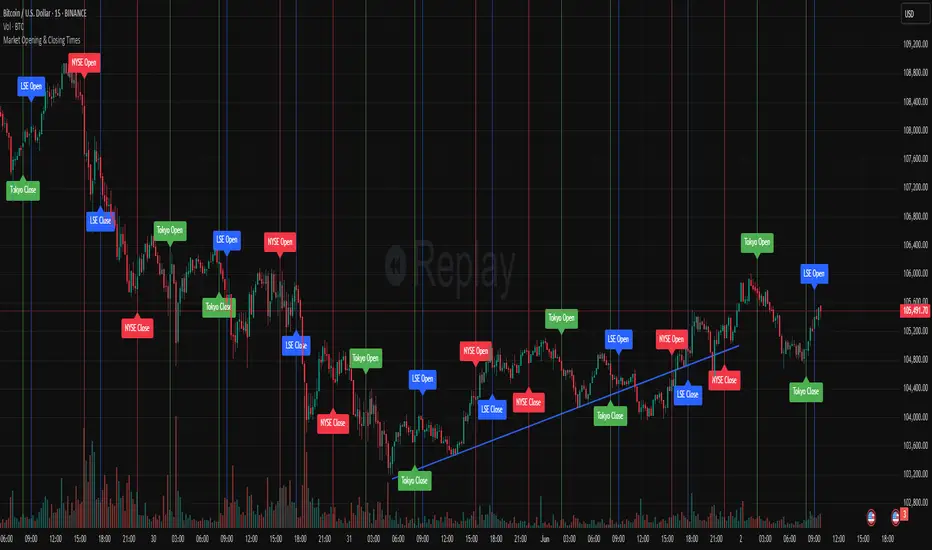
Market Opening & Closing TimesThis indicator highlights the opening and closing times of major global markets (NYSE, LSE, Tokyo) on any chart timeframe. Users can toggle the display of lines and labels, and customize colors per market.
Features:
Toggle each market’s Open/Close separately
Global toggles: Show/Hide all lines or labels
Customizable colors for NYSE, LSE, and Tokyo markers
Accurate event detection using timezone-aware timestamp checks within each bar
Ichimoku + RSI + VWMA Strategy Suite (w/ ATR SLTP)Ichimoku + RSI + VWMA indikatörleri kullanılarak üretilen seçmeli stratejiler.

MTF FVG with Hit Counter HarmoniXTradeMain Purpose of the Indicator:
This indicator is designed to automatically identify Fair Value Gaps (FVG) across three different timeframes simultaneously. The primary goal is to display these key zones on the chart and provide detailed information about price interaction with these levels, enabling traders to make more informed decisions.
Key Features:
Multi-Timeframe FVG Identification:
By default, the indicator identifies and displays FVGs on the Weekly (W), Daily (D), and 4-Hour (240) timeframes.
Users can customize these timeframes in the settings to fit their preferences.
Detailed Hit Counter:
This indicator goes beyond simply showing FVGs; it accurately counts the number of times the price has touched each of the three key FVG levels:
Up: The top line of the FVG
Mid: The midline (equilibrium) of the FVG
Down: The bottom line of the FVG
This information is displayed in a clear label next to each FVG zone, helping traders assess the strength and validity of each level.
Extensive Customization:
Appearance: You can change the colors for bullish and bearish FVGs for each timeframe individually, modify the style of the main and mid lines, and adjust the label size.
Detection Logic: Users can define the minimum size of an FVG for detection based on a percentage or point value.
Mitigation Logic: Two methods are provided for FVG invalidation:
Percentage Mitigation: The FVG is considered mitigated after the price has penetrated it by a specific percentage (e.g., 50%).
Full Fill: The FVG remains valid until the price has completely filled the gap and closed beyond it.
Extend Lines Capability:
To prevent chart clutter and get a better view of future price action, you can extend the FVG lines and labels to the right by a specified number of bars, creating distance from the current candle.
How to Use This Indicator:
Identifying Support and Resistance Zones: FVG areas can act as strong support and resistance levels.
Confirming Entry Points: A price touch and reaction to one of the FVG levels (especially the midline) can be used as a confirmation for entering a trade.
Assessing Level Strength: The number of hits on each level (Up, Mid, Down) indicates which price point within the zone has been more attractive to the market. For example, repeated reactions to the top line of a bearish FVG might suggest strong selling pressure at that level.
Your Feedback for Improvement:
You are invited to use this indicator and share any suggestions, ideas for improvement, or reports of potential issues. Your feedback will be valuable for implementation in future versions.

GB Time Tracker - DST AwareThis script shows certain GB times combinations based on Zurich/NY time. The idea of GB time as a concept comes from aka_shan/delboy26. This script is meant to follow his logic.

Annualized Historical VolatilityAnnualized, realized vol calculated as
hv = std_dev(log returns) x sqrt(trading periods)

XAU M1 Titan Strategy with Candle Pattern by Rifaat QariScript Features:
Multi-Indicator Strategy:
Combines SMA, RSI, ATR, MACD, and Bollinger Bands to detect trend direction, momentum, volatility, and support/resistance dynamically.
Candlestick Pattern Analysis:
Detects major candlestick patterns (like bullish/bearish engulfing, hammer, shooting star, doji, etc.) to confirm or weaken trade signals.
Dynamic Signal Strength:
Signals are classified as Strong Buy/Sell or Weak Buy/Sell based on confluence between indicators and candle pattern confirmation.
Automatic Take Profit (TP) and Stop Loss (SL) Levels:
Calculates TP1, TP2, TP3 and SL levels dynamically based on ATR and market conditions.
Entry Price Marking:
Shows the exact entry price for each signal on the chart.
Risk Management - Auto Lot Size Calculation:
Calculates suggested lot size automatically based on user-defined risk percentage, account balance, contract size, and point value.
Volume and Trend Zone Filters:
Uses volume spikes and price zones to avoid false signals and improve accuracy.
Visual Elements on Chart:
Entry, TP, SL lines and labels with exact price values and colored signals for clear visualization.
Alerts Ready:
Supports alerts for buy and sell signals that can be integrated with Telegram or other platforms.
How to Use the Script:
Add the Script to Your Chart:
Apply the indicator to a Gold (XAUUSD) 1-minute chart on TradingView.
Configure Inputs:
Adjust the input parameters to fit your trading style and account details:
SMA length, RSI period, ATR period, MACD settings, Bollinger Bands settings
Risk percentage per trade
Account balance and contract size
Minimum bars before confirming strong signals
Watch for Signals:
Strong Buy: When all indicators and candlestick patterns confirm bullish momentum.
Weak Buy: When indicators suggest buy but candlestick confirmation is less strong.
Strong Sell: When all indicators and candlestick patterns confirm bearish momentum.
Weak Sell: When indicators suggest sell but candlestick confirmation is less strong.
Trade Management:
Entry price and SL/TP levels are drawn automatically on the chart.
Lot size is suggested based on risk management inputs.
Use Alerts:
Set up alerts based on the script’s buy/sell signals to get notifications or trigger automatic actions

Breakout Strength Radar🚀 What It Does:
The Breakout Strength Radar tells you:
✅ Trend direction: Bullish / Bearish / Neutral
✅ Trend slope: Rising / Falling / Flat
→ Is the trend gaining strength or fading?
✅ Momentum: Strong Bullish / Strong Bearish / Neutral
→ Is there fuel behind the move?
✅ Volatility condition: Expanding / Contracting / Stable
→ Is the market opening up (breakout likely) or squeezing (consolidation)?
✅ Breakout Watch:
→ Tells you when the market just shifted from a squeeze to expansion — this is prime breakout territory.
🏗️ How It Works Under The Hood:
📈 Trend:
→ Compares EMA 50 vs EMA 200. Standard institutional trend filter.
⛰️ Slope:
→ Checks whether EMA50 is rising, falling, or flat based on its slope over the past 5 bars.
🚀 Momentum:
→ Uses RSI:
→ RSI > 55 → Momentum Bullish
→ RSI < 45 → Momentum Bearish
→ RSI between 45-55 → Neutral / No strong pressure
🌪️ Volatility:
→ Uses Bollinger Band Width (BB Width):
→ Expanding → Breakouts, volatility rising.
→ Contracting → Squeeze, compression, range.
💥 Breakout Watch:
→ Triggers when volatility was contracting for 5 candles → then starts expanding.
→ This often precedes massive directional moves.
🎯 How to Use It for Swing Trades:
🔥 Prime Swing Setup Checklist:
→ ✅ Trend: Bullish or Bearish (no Neutral).
→ ✅ Slope: Rising (Bull) or Falling (Bear).
→ ✅ Momentum: Strong Bullish or Strong Bearish.
→ ✅ Volatility: Expanding.
→ ✅ Breakout Watch: Active → If it just flipped from contraction to expansion, this is often the start of the move.
→ → This is a high-conviction swing setup.
🔥 Swing Entry Example (Long):
→ Trend: Bullish
→ Slope: Rising
→ Momentum: Strong Bullish
→ Volatility: Expanding
→ Breakout Watch: Active (optional but ideal)
→ ✅ → Look for pullbacks to support zones, moving averages, or breaks of recent highs.
→ Entry → On pullback confirmation or breakout candle.
→ Stop → Below swing low / ATR stop.
→ TP → Based on Risk/Reward or prior highs.
🔥 Swing Entry Example (Short):
→ Trend: Bearish
→ Slope: Falling
→ Momentum: Strong Bearish
→ Volatility: Expanding
→ ✅ Ideal when price is breaking down from a squeeze or retesting failed support.
🚫 Avoid Trades When:
Trend is Neutral.
Slope is Flat.
Volatility is Contracting.
Momentum is Neutral.
→ These are chop conditions → low win rate → avoid.
🧠 Pro Tips:
📊 Combine it with structure: Use it with supply/demand, support/resistance zones, or liquidity levels.
⏳ Hold during expansions: As long as Volatility = Expanding, the move often continues.
🚩 Exit or tighten stops if: Volatility contracts and slope flattens → move may be done.
🔥 Breakout Watch Active: Means a squeeze just broke → often the start of large moves.
🏆 Bottom Line:
→ This tool isn’t about buy/sell signals.
→ It’s a market condition scanner that tells you:
“Is this a time to hunt aggressive swing trades or stand down?”
→ When all conditions align → You have a high-probability trade environment.

Gold Power Hours StrategyStrategy: XAUUSD Gold Power Hours
(ideal for Tuesday to Thursday, 8:00–11:30 am NY and 1:30–3:30 pm NY)
Strategy Rules
1️⃣ Timeframe
Trade on 15 min and 1 hour charts
Confirm with the 4 h chart (trend direction)
2️⃣ Entry Conditions
✅ Main trend (confirmation):
50-period Simple Moving Average (SMA50) on the 4h chart
price above = only look for longs
price below = only look for shorts
✅ Momentum (confirmation):
RSI(14) on the 15 min chart
above 55 = bullish strength
below 45 = bearish strength
✅ Volume (validation):
Increasing volume (bar higher than previous) during NY open (8–9 am) or at 1:30 pm
confirms institutional interest
3️⃣ Entry Setup
🟢 Longs (buys):
Price above 4h SMA50
15 min RSI > 55
break of previous resistance (e.g., last hour’s high)
rising volume on the entry candle
👉 Enter on breakout + 2 pips of margin
🔴 Shorts (sells):
Price below 4h SMA50
15 min RSI < 45
break of previous support
rising volume on the entry candle
👉 Enter on breakout – 2 pips of margin
4️⃣ Trade Exits / Management
✅ Take profit (TP):
2 × the risk taken (e.g., SL 20 pips → TP 40 pips)
or the next significant support/resistance on H1
✅ Stop loss (SL):
below the last impulse candle (for longs)
or above the last impulse candle (for shorts)
minimum 15–20 pips to avoid stop hunts
✅ Break-even
move SL to entry point once +15 pips profit is reached
5️⃣ Additional Filters
✅ Avoid trading during red news (NFP, FOMC) until the first spike finishes.
✅ Avoid trading outside these windows:
8:00–11:30 am NY
1:30–3:30 pm NY

Mary Mount - Bean CounterAn attempt at capturing technically extraordinary moments of buy and sell pressure.

Fair Value Gap (FVG) Detector — ICT SMC BasedThis is an open-source Fair Value Gap (FVG) indicator, based on the principles taught in ICT (Inner Circle Trader) and Smart Money Concepts (SMC). It identifies imbalances or inefficiencies in price action where the body/wick of the middle candle in a three-candle formation does not overlap with the first and third candles.
🔹 What is an FVG?
An FVG is formed when there is a price imbalance, typically between three consecutive candles:
A bullish FVG forms when the low of candle 1 is above the high of candle 3.
A bearish FVG forms when the high of candle 1 is below the low of candle 3.
These gaps are believed to represent areas of institutional activity and are often used as potential entries, targets, or reaction zones.
🔹 Features:
Detects both bullish and bearish FVGs
Clean chart visuals using colored boxes
Adjustable box opacity and text alignment
Option to show or hide filled FVGs
Optional filter to only display gaps above a minimum size (e.g., 100 points)
Multi-timeframe support (if enabled in script settings)
Box label customization (text alignment: center/left/right)
🔹 How to Use:
Use the indicator on any timeframe or instrument
Larger gaps may indicate stronger price inefficiencies
Combine with market structure, liquidity zones, or order blocks for confirmation
This version is open-source, so traders can view and adapt the logic as needed.
The indicator is designed for transparency, education, and clarity of Smart Money Concepts.

SMA3 / EMA10 + MACD (9-10pm COL) | SL 10 pips, TP 10 pipsmedias movil de 3 periodos mas una ema de 10 + macd cruces, el tp y sl no se usan de la estrategia se usa minimo o maximo q marque el zigzag de 6 periodos.
3-period simple moving average plus a 10-period EMA and MACD crossovers. Take profit and stop loss are not fixed; instead, they are based on the most recent low or high marked by a 6-period ZigZag indicator."

PRO Trading: CCI Grid Master### English
**Strategy Name:**
PRO Trading: CCI Grid Master
**Description:**
Modern grid trading strategy combining CCI and RSI indicators with intelligent position management. Features 5-level averaging, adaptive stop loss, and three take profit calculation methods. Optimized for lower timeframes (1-15 minutes) where signals are more frequent - higher timeframes generate fewer trading opportunities.
---
#### 🌟 Concept and Uniqueness
CCI Grid Master stands out with its:
- Confirmed entry signals (2+ for longs, 4+ for shorts)
- Exponential position scaling
- Three TP calculation methods
- Visual grid levels on chart
- Risk-managed approach
*Secret ingredient: Custom indicator periods and specialized false signal filtration system that significantly reduces bad entries.*
Unlike basic grid strategies, it implements:
1. Signal confirmation to reduce false entries
2. Smart volume management
3. Multi-layer capital protection
4. Professional risk controls
---
#### 💰 Value Proposition
- **Beginners**: Clear visualization and simple setup
- **Pros**: Advanced risk management controls
- **Algo Traders**: Consistent logic for automation
- **Risk Managers**: Built-in capital protection
Tested across various market conditions (trend, flat, volatile) with consistent results.
---
#### ⚙️ How It Works
**Signal Generation:**
- CCI + RSI combo with custom periods
- Long: CCI < -100 & RSI < 20
- Short: CCI > 100 & RSI > 80
- Signal confirmation (2+ signals/4 bars for longs, 4+ for shorts)
**Grid Mechanics:**
1. First entry (5% equity default)
2. 5 averaging levels at 1.8% intervals
3. Exponential volume scaling (1.6x multiplier)
**Position Management:**
- 3 TP methods:
1. From First Entry
2. From Average (updated on averaging)
3. Realtime Average
- Adaptive stop loss (80% from avg price)
- Opposite signal closing option
**Visuals:**
- Green/Red line: Average entry price (Green for long, Red for short)
- Blue line: Take profit level
- Purple line: Stop loss
- Gray circles: Averaging levels
---
#### 🛠 Setup & Usage
**Recommended Settings:**
```ini
First Entry %: 5.0
Volume Multiplier: 1.6
Grid Step: 1.8%
Profit Target: 1.0%
Stop Loss: 80%
```
**Timeframe Note:**
Optimal performance on 1-15 min charts. Higher timeframes (1H+) may generate fewer signals but offer higher reliability.
**Customization:**
- Conservative:
- Lower First Entry % (2-3%)
- Increase Stop Loss (100-120%)
- Use "Realtime Average" TP
- Aggressive:
- Increase Volume Multiplier (1.8-2.0)
- Reduce Grid Step (1.0-1.5%)
- Use "From First Entry" TP
---
#### ❓ FAQ
**Q:** Why 4 signals for shorts?
**A:** Our proprietary filtration system requires stronger confirmation for short entries to avoid false signals in volatile markets.
**Q:** How to choose TP method?
**A:**
- First Entry: Strong trends
- From Average: Balanced approach
- Realtime: Volatile/range-bound markets
**Q:** Why exponential volume scaling?
**A:** Mathematical approach to lower average entry price while controlling risk exposure.
**Q:** Crypto compatibility?
**A:** Excellent for volatile assets (BTC, ETH, LTC).
---
#### ⚠️ Risk Warning
1. Grid strategies carry higher risk - use risk capital only
2. Always backtest before live trading
3. Minimum account: $1000+ for proper scaling
4. Avoid low-liquidity instruments
5. Never risk >5% per trade
---
#### 💡 Conclusion
PRO Trading: CCI Grid Master delivers professional-grade trading with visual clarity and advanced risk management. Perfect for traders seeking systematic approaches in any market.
*Happy Trading with PRO Trading!*
**Default Settings:**
Optimized for 1-15min timeframes. For daily charts, increase grid step to 2.5%. For crypto, reduce grid step to 1.5% and increase stop loss to 100%.
### Русское описание (Russian Description)
**Название стратегии:**
PRO Trading: CCI Grid Master
**Описание:**
Современная сеточная стратегия, сочетающая индикаторы CCI и RSI с интеллектуальным управлением позицией. Особенности: 5 уровней усреднения, адаптивный стоп-лосс и три метода расчета тейк-профита. Оптимизирована для младших таймфреймов (1-15 минут) с более частыми сигналами - на старших таймфреймах торговых возможностей меньше.
---
#### 🌟 Концепция и уникальность
CCI Grid Master выделяется:
- Подтвержденными сигналами входа (2+ для лонга, 4+ для шорта)
- Экспоненциальным наращиванием позиции
- Тремя методами расчета TP
- Визуализацией уровней сетки
- Профессиональным управлением рисками
*Секретный ингредиент: Кастомные периоды индикаторов и специальная система фильтрации ложных сигналов, значительно снижающая неверные входы.*
В отличие от простых сеточных стратегий:
1. Фильтрация сигналов снижает ложные входы
2. Умное управление объемом позиций
3. Многоуровневая защита капитала
4. Профессиональный контроль рисков
---
#### 💰 Ценность
- **Новичкам**: Простота настройки и визуализация
- **Профи**: Гибкое управление рисками
- **Алготрейдерам**: Стабильная логика для автоматизации
- **Риск-менеджерам**: Встроенная защита депозита
Протестирована в различных рыночных условиях с устойчивыми результатами.
---
#### ⚙️ Как работает
**Генерация сигналов:**
- Комбинация CCI + RSI с кастомными периодами
- Лонг: CCI < -100 и RSI < 20
- Шорт: CCI > 100 и RSI > 80
- Подтверждение сигнала (2+ сигнала за 4 бара для лонга, 4+ для шорта)
**Механика сетки:**
1. Первый вход (5% от депозита)
2. 5 уровней усреднения с шагом 1.8%
3. Экспоненциальное увеличение объема (множитель 1.6х)
**Управление позицией:**
- 3 метода TP:
1. От первого входа
2. От средней цены (обновляется при усреднении)
3. От текущей средней цены (реалтайм)
- Адаптивный стоп-лосс (80% от средней цены)
- Опция закрытия при противоположном сигнале
**Визуализация:**
- Зеленая/Красная линия: Средняя цена входа (Зеленая для лонга, Красная для шорта)
- Синяя линия: Уровень тейк-профита
- Фиолетовая линия: Стоп-лосс
- Серые кружки: Уровни для усреднения
---
#### 🛠 Настройка и использование
**Рекомендуемые параметры:**
```
Процент первого входа: 5.0
Множитель объема: 1.6
Шаг сетки: 1.8%
Цель прибыли: 1.0%
Стоп-лосс: 80%
```
**Примечание по таймфреймам:**
Лучшие результаты на таймфреймах 1-15 минут. На старших таймфреймах (1H+) сигналов меньше, но выше надежность.
**Кастомизация:**
- Консервативно:
- Уменьшить процент входа (2-3%)
- Увеличить стоп-лосс (100-120%)
- Использовать "Realtime Average" TP
- Агрессивно:
- Увеличить множитель объема (1.8-2.0)
- Уменьшить шаг сетки (1.0-1.5%)
- Использовать "From First Entry" TP
---
#### ❓ FAQ
**В:** Почему для шорта нужно 4 сигнала?
**О:** Наша система фильтрации требует более сильного подтверждения для шортовых входов, чтобы избежать ложных сигналов на волатильном рынке.
**В:** Как выбрать метод TP?
**О:**
- От первого входа: Сильные тренды
- От средней цены: Сбалансированный подход
- Realtime Average: Волатильные/боковые рынки
**В:** Зачем экспоненциальное увеличение объема?
**О:** Математический подход к снижению средней цены входа при контроле риска.
**В:** Подходит для крипторынка?
**О:** Отлично работает на волатильных активах (BTC, ETH, LTC).
---
#### ⚠️ Предупреждение о рисках
1. Сеточные стратегии несут повышенный риск - используйте только риск-капитал
2. Всегда тестируйте на исторических данных
3. Минимальный депозит: $1000+
4. Избегайте низколиквидных активов
5. Риск на сделку не должен превышать 5%
---
#### 💡 Заключение
PRO Trading: CCI Grid Master - профессиональный инструмент с продвинутым управлением рисками. Идеально подходит для системной торговли на любом рынке.
*Удачных торгов с PRO Trading!*
---
**Параметры по умолчанию:**
Оптимизированы для таймфреймов 1-15 мин. Для дневных графиков увеличьте шаг сетки до 2.5%. Для крипторынка уменьшите шаг до 1.5% и увеличьте стоп-лосс до 100%.

Pivot + Supports and ResistancesBot that automatically takes the high, low, and close of the previous day and gives three supports and three resistances

Satyam: Custom IndicatorThis script has two main functions focusing on EMAs (Exponential Moving Average) and Stochastic RSI.
EMAs
EMAs are typically used to give a view of bullish / bearish momentum. When the shorter EMA (calculated off more recent price action) crosses, or is above, the slower moving EMA (calculated off a longer period of price action), it suggests that the market is in an uptrend. This can be an indication to either go long on said asset, or that it is more preferable to take long setups over short setups. Invalidation on long setups is usually found via price action (e.g. previous lows) or simply waiting for an EMA cross in the opposite direction (i.e. shorter EMA crosses under longer term EMA).
This is not a perfect system for trade entry or exit, but it does give a good indication of market trends. The settings for the EMAs can be changed based on user inputs, and by default the candles are coloured based on the crosses to make it more visual. The default settings are based on “Trader XO’s” settings who is an exceptional swing trader.

Price Cross Over LcfxKey Features:
HalfTrend Calculation:
Uses amplitude value (default 100)
Calculates based on highest/lowest prices and smoothed moving averages
Includes volatility adjustment using ATR
Signal Detection:
Buy signals when price closes ABOVE HalfTrend line
Sell signals when price closes BELOW HalfTrend line
Uses actual candle close prices for reliable signals
Visual Elements:
Plots HalfTrend line in blue
Shows green "BUY" labels below bars
Shows red "SELL" labels above bars
Alerts created for both signal types
Input Customization:
Adjustable amplitude parameter
Min value constrained to 1
Usage:
Apply to any chart
Signals appear at the close of the candle that crosses the HalfTrend line
Alerts can be set for automated notifications

Multi-Confluence Swing Hunter V1# Multi-Confluence Swing Hunter V1 - Complete Description
Overview
The Multi-Confluence Swing Hunter V1 is a sophisticated low timeframe scalping strategy specifically optimized for MSTR (MicroStrategy) trading. This strategy employs a comprehensive point-based scoring system that combines optimized technical indicators, price action analysis, and reversal pattern recognition to generate precise trading signals on lower timeframes.
Performance Highlight:
In backtesting on MSTR 5-minute charts, this strategy has demonstrated over 200% profit performance, showcasing its effectiveness in capturing rapid price movements and volatility patterns unique to MicroStrategy's trading behavior.
The strategy's parameters have been fine-tuned for MSTR's unique volatility characteristics, though they can be optimized for other high-volatility instruments as well.
## Key Innovation & Originality
This strategy introduces a unique **dual scoring system** approach:
- **Entry Scoring**: Identifies swing bottoms using 13+ different technical criteria
- **Exit Scoring**: Identifies swing tops using inverse criteria for optimal exit timing
Unlike traditional strategies that rely on simple indicator crossovers, this system quantifies market conditions through a weighted scoring mechanism, providing objective, data-driven entry and exit decisions.
## Technical Foundation
### Optimized Indicator Parameters
The strategy utilizes extensively backtested parameters specifically optimized for MSTR's volatility patterns:
**MACD Configuration (3,10,3)**:
- Fast EMA: 3 periods (vs standard 12)
- Slow EMA: 10 periods (vs standard 26)
- Signal Line: 3 periods (vs standard 9)
- **Rationale**: These faster parameters provide earlier signal detection while maintaining reliability, particularly effective for MSTR's rapid price movements and high-frequency volatility
**RSI Configuration (21-period)**:
- Length: 21 periods (vs standard 14)
- Oversold: 30 level
- Extreme Oversold: 25 level
- **Rationale**: The 21-period RSI reduces false signals while still capturing oversold conditions effectively in MSTR's volatile environment
**Parameter Adaptability**: While optimized for MSTR, these parameters can be adjusted for other high-volatility instruments. Faster-moving stocks may benefit from even shorter MACD periods, while less volatile assets might require longer periods for optimal performance.
### Scoring System Methodology
**Entry Score Components (Minimum 13 points required)**:
1. **RSI Signals** (max 5 points):
- RSI < 30: +2 points
- RSI < 25: +2 points
- RSI turning up: +1 point
2. **MACD Signals** (max 8 points):
- MACD below zero: +1 point
- MACD turning up: +2 points
- MACD histogram improving: +2 points
- MACD bullish divergence: +3 points
3. **Price Action** (max 4 points):
- Long lower wick (>50%): +2 points
- Small body (<30%): +1 point
- Bullish close: +1 point
4. **Pattern Recognition** (max 8 points):
- RSI bullish divergence: +4 points
- Quick recovery pattern: +2 points
- Reversal confirmation: +4 points
**Exit Score Components (Minimum 13 points required)**:
Uses inverse criteria to identify swing tops with similar weighting system.
## Risk Management Features
### Position Sizing & Risk Control
- **Single Position Strategy**: 100% equity allocation per trade
- **No Overlapping Positions**: Ensures focused risk management
- **Configurable Risk/Reward**: Default 5:1 ratio optimized for volatile assets
### Stop Loss & Take Profit Logic
- **Dynamic Stop Loss**: Based on recent swing lows with configurable buffer
- **Risk-Based Take Profit**: Calculated using risk/reward ratio
- **Clean Exit Logic**: Prevents conflicting signals
## Default Settings Optimization
### Key Parameters (Optimized for MSTR/Bitcoin-style volatility):
- **Minimum Entry Score**: 13 (ensures high-conviction entries)
- **Minimum Exit Score**: 13 (prevents premature exits)
- **Risk/Reward Ratio**: 5.0 (accounts for volatility)
- **Lower Wick Threshold**: 50% (identifies true hammer patterns)
- **Divergence Lookback**: 8 bars (optimal for swing timeframes)
### Why These Defaults Work for MSTR:
1. **Higher Score Thresholds**: MSTR's volatility requires more confirmation
2. **5:1 Risk/Reward**: Compensates for wider stops needed in volatile markets
3. **Faster MACD**: Captures momentum shifts quickly in fast-moving stocks
4. **21-period RSI**: Reduces noise while maintaining sensitivity
## Visual Features
### Score Display System
- **Green Labels**: Entry scores ≥10 points (below bars)
- **Red Labels**: Exit scores ≥10 points (above bars)
- **Large Triangles**: Actual trade entries/exits
- **Small Triangles**: Reversal pattern confirmations
### Chart Cleanliness
- Indicators plotted in separate panes (MACD, RSI)
- TP/SL levels shown only during active positions
- Clear trade markers distinguish signals from actual trades
## Backtesting Specifications
### Realistic Trading Conditions
- **Commission**: 0.1% per trade
- **Slippage**: 3 points
- **Initial Capital**: $1,000
- **Account Type**: Cash (no margin)
### Sample Size Considerations
- Strategy designed for 100+ trade sample sizes
- Recommended timeframes: 4H, 1D for swing trading
- Optimal for trending/volatile markets
## Strategy Limitations & Considerations
### Market Conditions
- **Best Performance**: Trending markets with clear swings
- **Reduced Effectiveness**: Highly choppy, sideways markets
- **Volatility Dependency**: Optimized for moderate to high volatility assets
### Risk Warnings
- **High Allocation**: 100% position sizing increases risk
- **No Diversification**: Single position strategy
- **Backtesting Limitation**: Past performance doesn't guarantee future results
## Usage Guidelines
### Recommended Assets & Timeframes
- **Primary Target**: MSTR (MicroStrategy) - 5min to 15min timeframes
- **Secondary Targets**: High-volatility stocks (TSLA, NVDA, COIN, etc.)
- **Crypto Markets**: Bitcoin, Ethereum (with parameter adjustments)
- **Timeframe Optimization**: 1min-15min for scalping, 30min-1H for swing scalping
### Timeframe Recommendations
- **Primary Scalping**: 5-minute and 15-minute charts
- **Active Monitoring**: 1-minute for precise entries
- **Swing Scalping**: 30-minute to 1-hour timeframes
- **Avoid**: Sub-1-minute (excessive noise) and above 4-hour (reduces scalping opportunities)
## Technical Requirements
- **Pine Script Version**: v6
- **Overlay**: Yes (plots on price chart)
- **Additional Panes**: MACD and RSI indicators
- **Real-time Compatibility**: Confirmed bar signals only
## Customization Options
All parameters are fully customizable through inputs:
- Indicator lengths and levels
- Scoring thresholds
- Risk management settings
- Visual display preferences
- Date range filtering
## Conclusion
This scalping strategy represents a comprehensive approach to low timeframe trading that combines multiple technical analysis methods into a cohesive, quantified system specifically optimized for MSTR's unique volatility characteristics. The optimized parameters and scoring methodology provide a systematic way to identify high-probability scalping setups while managing risk effectively in fast-moving markets.
The strategy's strength lies in its objective, multi-criteria approach that removes emotional decision-making from scalping while maintaining the flexibility to adapt to different instruments through parameter optimization. While designed for MSTR, the underlying methodology can be fine-tuned for other high-volatility assets across various markets.
**Important Disclaimer**: This strategy is designed for experienced scalpers and is optimized for MSTR trading. The high-frequency nature of scalping involves significant risk. Past performance does not guarantee future results. Always conduct your own analysis, consider your risk tolerance, and be aware of commission/slippage costs that can significantly impact scalping profitability.

SMC Prime Matrix🧠 SMC Prime Matrix — Multi-Concept Smart Money Indicator
The SMC Prime Matrix is an advanced Pine Script indicator that brings together multiple Smart Money Concepts (SMC) into a single, modular tool. Designed for institutional-style traders and students of market structure, this overlay visualizes key price action events, liquidity levels, and trend shifts across all timeframes.
It aims to simplify complex institutional concepts such as BOS, CHoCH, Order Blocks, Fair Value Gaps, SFPs, and premium/discount analysis into a cohesive and customizable framework.
🔍 Key Features
📆 Institutional Key Levels: Automatically plots weekly, monthly, and yearly opens (including previous sessions) to identify institutional reference levels often used for bias setting and liquidity targeting.
🧱 Order Blocks & Breaker Blocks: Detects bullish/bearish order blocks and breaker blocks using custom swing logic. Boxes are drawn with dynamic labels and styling to highlight the most relevant zones.
📉 Market Structure Detection: Identifies Break of Structure (BOS) and Change of Character (CHoCH) at both internal and major swing levels, helping determine trend continuation or reversal points.
🌀 Fair Value Gaps (FVGs): Highlights price imbalances (inefficient zones) based on swing displacement. Options include real-time filtering, styling, and visibility limits.
🧠 Swing Points & Liquidity Zones: Marks swing highs/lows and detects equal highs/lows (EQH/EQL) to expose areas prone to liquidity grabs or stop runs.
⚠️ Swing Failure Patterns (SFPs): Identifies potential liquidity sweeps or failed swing breakouts, with debounce logic and MTF integration to reduce signal noise.
🕓 Multi-Timeframe Integration: Displays key swing highs/lows and SFPs from higher timeframes (daily, weekly, monthly) directly on lower timeframe charts.
🧩 Highly Customizable: Users can toggle individual modules, adjust detection sensitivity, line/label styles, debounce filtering, and theme presets to suit different trading styles.
🧠 How It Works
The script uses a combination of:
Swing detection algorithms (including internal vs. major pivots)
Price displacement logic (for BOS/CHoCH/FVG)
Multi-timeframe request.security() calls (without lookahead bias)
Real-time plotting of levels, boxes, and labels with visual efficiency in mind
All calculations are done in real-time using a structured top-down flow that integrates structural, value-based, and liquidity-based models in one overlay.
📈 Use Cases
Trend Direction: Determine market bias using CHoCH, BOS, and swing structure shifts.
Liquidity Mapping: Visualize likely liquidity pools via EQH/EQL, FVGs, and SFPs.
Refined Entries: Use OBs or Breaker Blocks within premium/discount zones for better R/R setups.
Confluence Building: Overlay higher-timeframe levels for stronger confirmation with intraday trades.
Discretionary & Systematic Trading: Modular layout makes it suitable for both styles.
💡 Originality & Integration
This is an original implementation that combines multiple Smart Money trading ideas into a tightly integrated and performant script. Each component is coded for interoperability, rather than being a visual mashup of disconnected ideas. It is designed for those who want to study or emulate institutional trading behavior within Pine Script limitations.
📌 Limitations & Notes
This is not a signal generator. All elements are for informational and analytical use only.
Some features (FVGs, SFPs, CHoCH) rely on historical pivots and may repaint as new bars form.
Market structure is subjective — settings may need tuning depending on asset volatility.
For educational purposes only. This script does not constitute financial advice or trading recommendations.
✅ How to Use
Add the indicator to any chart or asset.
Open the settings panel to enable/disable modules or adjust sensitivity.
Use tooltips and label text to gain insights into the detected events.
Combine this tool with your own technical or fundamental analysis and proper risk management.

MABB55 Full-CrossIndicates when the MABB55 crosses the:
MABB13
MABB21
EMA8
When a full crossover happens, where the long-term average (MABB 55) moves above or below the faster ones (EMA 8, MABB 13, and 21) it means the trend has shifted so strongly and consistently that it overcomes short-term price movement. That kind of shift usually signals a trend reversal.
Bullish reversals with the MABB55 crossing from above, indicated by a green arrowl.
Bearish reversals with the MABB55 crossing from below, indicated by a red arrow.

Satyam: Custom IndicatorThis script has two main functions focusing on EMAs (Exponential Moving Average) and Stochastic RSI.
EMAs
EMAs are typically used to give a view of bullish / bearish momentum. When the shorter EMA (calculated off more recent price action) crosses, or is above, the slower moving EMA (calculated off a longer period of price action), it suggests that the market is in an uptrend. This can be an indication to either go long on said asset, or that it is more preferable to take long setups over short setups. Invalidation on long setups is usually found via price action (e.g. previous lows) or simply waiting for an EMA cross in the opposite direction (i.e. shorter EMA crosses under longer term EMA).
This is not a perfect system for trade entry or exit, but it does give a good indication of market trends. The settings for the EMAs can be changed based on user inputs, and by default the candles are coloured based on the crosses to make it more visual. The default settings are based on “Trader XO’s” settings who is an exceptional swing trader.
RSI
Stochastic RSI is a separate indicator that has been added to this script. RSI measures Relative Strength (RSI = Relative Strength Index). When RSI is <20 it is considered oversold, and when >80 it is overbought. These conditions suggests that momentum is very strong in the direction of the trend.
If there is a divergence between the price (e.g. price is creating higher highs, and stoch RSI is creating lower highs) it suggests the strength of the trend is weakening. Whilst this script does not highlight divergences, what it does highlight is when the shorter term RSI (K) crosses over D (the average of last 3 periods). This can give an indication that the trend is losing strength.
Combination
The EMAs indicate when trend shifts (bullish or bearish).
The RSI indicates when the trend is losing momentum.
The combination of the two can be used to suggest when to prefer a directional bias, and subsequently shift in anticipation of a trend reversal.
Note that no signal is 100% accurate and an interpretation of market conditions and price action will need to be overlayed to

Position Trading Strategy - EMA + FVGMulti-Timeframe Momentum & Pattern Recognition System
This comprehensive trading indicator combines multiple technical analysis components to identify high-probability entry and exit signals for Bitcoin and other assets. The system utilizes:
LuxAlgo Fair Value Gap Detection - Identifies institutional order flow imbalances
Hull Suite & MACD Integration - Confirms trend direction and momentum shifts
Pyramid Scoring System - Ranks signal strength using multiple confluences
Smart Position Management - Provides clear long/short entry and exit alerts
Visual Market Structure - Displays key support/resistance levels and gap zones
The indicator generates scored signals based on the alignment of trend, momentum, and market structure, helping traders identify optimal entry points while managing risk through systematic exit conditions. Perfect for swing trading and scalping strategies on multiple timeframes.
Best Used For: BTC/USD, major forex pairs, and liquid cryptocurrency markets
Recommended Timeframes: 5M, 15M, 1H for optimal signal accuracy

Volume Pressure Analyzer)The Volume Pressure Analyzer is a clean, table-only TradingView indicator that helps traders visually assess buy/sell pressure based on simulated buyer and seller volume over a recent period.
It calculates the average buyer and seller volume over a user-defined number of candles and compares them to determine market pressure. The results are shown in a live-updating table (top right of the chart) — with no clutter on the price chart itself.
