Trading Psychology Trap: The Dark Side of Hedging a Bad Trade⚡ Important Clarification Before We Begin
In professional trading, real hedging involves sophisticated strategies using derivatives like options, futures, or other financial instruments.
Banks, funds, and major institutions hedge to manage portfolio risk, based on calculated models and complex scenarios.
This article is not about that.
We are talking about the kind of "hedging" retail traders do — opening an opposite position at the broker to "protect" a losing trade.
It may feel smart in the moment, but psychologically, it can be a hidden trap that damages your trading discipline.
Let’s dive into why emotional hedging rarely works for independent traders.
________________________________________
In trading, there’s a moment of panic that every trader has faced:
"My short position is in the red… maybe I’ll just open a long to balance it out."
It feels logical. You’re hedging. Protecting yourself. But in reality, you might be stepping into one of the most deceptive psychological traps in trading.
Let’s unpack why emotional hedging is rarely a good idea—and how it quietly sabotages your progress.
________________________________________
🧠 1. Emotional Relief ≠ Strategic Thinking
Hedging often arises not from a solid strategy, but from emotional discomfort.
You don’t hedge because you’ve analyzed the market. You hedge because you can’t stand the pain of a losing position.
This is not trading.
This is emotional anesthesia.
You’re trying to feel better—not trade better.
________________________________________
🎭 2. The Illusion of Control
Opening a hedge feels like taking back control.
In reality, you’re multiplying complexity without clarity.
You now have:
• Two opposing positions
• No clear directional bias
• An unclear exit strategy
You’ve replaced one problem (a loss) with two: mental conflict and strategic confusion.
________________________________________
🎢 3. Emotional Volatility Rises Sharply
With two positions open in opposite directions:
• You root for both sides at once.
• You feel relief when one wins, and stress when the other loses.
• Your mind becomes a battleground, not a trading desk.
This emotional volatility leads to irrational decisions, fatigue, and trading paralysis.
________________________________________
🔄 4. You Delay the Inevitable
When you hedge a losing position, you don’t fix the mistake.
You prolong it.
Eventually, you’ll have to:
• Close one side
• Add to one side
• Or exit both at the wrong moment
Hedging here is just postponed decision-making—and it gets harder the longer you wait.
________________________________________
🧪 5. You Build a Dangerous Habit
Hedging out of fear creates a reflex:
"Every time I’m losing, I’ll hedge."
You’re not learning to cut losses or reassess your strategy.
You’re learning to panic-protect.
And over time, you start to rely on hedging as a crutch—rather than developing real confidence and discipline.
________________________________________
✅ The Healthier Alternative
What should you do instead?
• Cut the loss.
• Review the trade.
• Wait for a fresh setup that aligns with your plan.
Accepting a losing trade is hard. But it’s a sign of maturity, not weakness.
Hedging may feel clever in the moment, but long-term consistency comes from clarity, not complication.
________________________________________
🎯 Final Thought
Emotional hedging isn’t about strategy.
It’s about fear.
The best traders don’t hedge to escape a loss.
They manage risk before the trade starts —and have the courage to close what’s not working.
Don’t fall into the illusion of safety.
Master the art of decisive action. That’s where real edge lives. 🚀
Beyond Technical Analysis

Digital Asset Backed by Physical Gold: Gold ownership, redefined
In today’s rapidly evolving financial landscape, PAX Gold (PAXG) stands out as a compelling fusion of traditional asset security and blockchain-enabled efficiency. As an asset-backed token, PAXG represents ownership of real, physical gold — specifically, one fine troy ounce of a London Good Delivery gold bar held in fully insured, professional vault facilities.
What sets PAXG apart is its unique structure: anyone who holds the token has legal ownership rights to the underlying gold, which is securely managed under the custody of Paxos Trust Company — a regulated financial institution based in New York.
This digital asset offers a number of powerful advantages:
🔹 Physical ownership meets digital flexibility
PAXG gives investors the benefits of physical gold ownership with the speed, divisibility, and mobility of a blockchain-based token. Investors can hold fractional amounts of gold — something traditionally difficult or expensive to manage.
🔹 Efficient conversion and reduced settlement risk
Through the Paxos platform, users can seamlessly convert between PAXG, allocated or unallocated gold, and fiat currency. This efficient process significantly reduces settlement risk compared to traditional gold markets.
🔹 Liquidity and accessibility
PAXG is available for trading on Paxos’ itBit exchange and is also being integrated into a wide range of crypto exchanges, wallets, and DeFi platforms — expanding its reach and use cases within the digital asset ecosystem.
🔹 True market value
Since PAXG is fully backed by physical gold, its price is tied directly to the real-time market value of gold. This provides a reliable hedge against market volatility and inflation while maintaining the flexibility of a tokenized asset.
As the lines continue to blur between traditional finance and digital innovation, assets like PAX Gold are pioneering a new standard — one that merges trust, transparency, and technology. For investors seeking the security of gold and the utility of crypto, PAXG may just be the golden bridge.

Learn the Harsh Truth About Success & Failure in Trading
The picture above completely represents the real nature of trading:
We all came here because we all wanted easy money.
Being attracted by catchy ads, portraying the guys on lambos, wearing guccies and living fancy lives, we jump into the game with high hopes of doubling our tiny initial trading accounts.
However, the reality quickly kicks in and losing trades become the norm.
The first trading account will most likely be blown .
In just one single month, 40% of traders will be discouraged and abandon this game forever.
The rest will realize the fact that the things are not that simple as they seemed to be and decide to start learning.
The primary obstacle with trading education though is the fact that there are so much data out there, so many different materials, so many strategies and techniques to try, so the one feels completely lost .
And on that stage, one plays the roulette: in the pile of dirt, he must find the approach that works .
80% of the traders, who stay after the first month, will leave in the next 2 years. Unfortunately, the majority won't be able to find a valid strategy and will quit believing that the entire system is the scam.
After 5 years, the strongest will remain. The ones that are motivated and strong enough to face the failures.
With such an experience, the majority of the traders already realize how the things work. They usually stuck around breakeven and winning trades start covering the losing ones.
However, some minor, tiny component is still missing in their system. They should find something that prevents them from becoming consistently profitable.
Only 1% of those who came in this game will finally discover the way to make money. These individuals will build a solid strategy, an approach that will work and that will let them become independent .
That path is hard and long. And unfortunately, most of the people are not disciplined and motivated enough to keep going. Only the strongest ones will stay. I wish you to be the one with the iron discipline, titanic patience and nerves of steel.
❤️Please, support my work with like, thank you!❤️
I am part of Trade Nation's Influencer program and receive a monthly fee for using their TradingView charts in my analysis.

Serios Traders Trade Scenarios, Not Certaintes...If you only post on TradingView, you're lucky — moderation keeps discussions professional.
But on other platforms, especially when you say the crypto market will fall, hate often knows no limits.
Why?
Because most people still confuse trading with cheering for their favorite coins.
The truth is simple:
👉 Serious traders don't operate based on certainties. They work with living, flexible scenarios.
In today's educational post, I'll show you exactly how that mindset works — using a real trade I opened on Solana (SOL).
________________________________________
The Trading Setup:
Here’s the basic setup I’m working with:
• First sell: Solana @ 150
SL (stop-loss): 175
TP (take-profit): 100
• Second sell: Solana @ 160
SL: 175
TP: 100
I won’t detail here why I believe the crypto market hasn’t reversed yet — that was already explained in a previous analysis.
Today, the focus is how I prepare my mind for different outcomes, not sticking to a fixed idea.
________________________________________
The Main Scenarios:
Scenario 1 – The Pessimistic One
The first thing I assume when opening any position is that it could fail.
In the worst case: Solana fills the second sell at 160 and goes straight to my stop-loss at 175.
✅ This is planned for. No drama, no surprise. ( Explained in detail in yesterday's educational post )
________________________________________
Scenario 2 – Pessimistic but Manageable
Solana fills the second sell at 160, then fluctuates between my entries and around 165.
If I judge that it’s accumulation, not distribution, I will close the trade early, taking a small loss or at breakeven.
________________________________________
Scenario 3 – Mini-Optimistic
Solana doesn’t even trigger the second sell.
It starts to drop, but stalls around 120-125, an important support zone as we all saw lately.
✅ In this case, I secure the profit without waiting stubbornly for the 100 target.
Important tactical adjustment:
If Solana drops below 145 (a support level I monitor), I plan to remove the second sell and adjust the stop-loss on the initial position.
________________________________________
Scenario 4 – Moderately Optimistic
Solana doesn’t fill the second order and drops cleanly to the 100 target.
✅ Full win, perfect scenario for the first trade
________________________________________
Scenario 5 – Optimistic but Flexible
Solana fills the second sell at 160, then drops but gets stuck at 120-125(support that we spoken about) instead of reaching 100.
✅ Again, the plan is to close manually at support, taking solid profit instead of being greedy.
________________________________________
Scenario 6 – The Best Scenario
Solana fills both sell orders and cleanly hits the 100 target.
✅ Maximum reward.
________________________________________
Why This Matters:
Scenarios Keep You Rational. Certainties Make You Fragile.
In trading, it's never about being "right" or "wrong."
It's about having a clear plan for multiple outcomes.
By thinking in terms of scenarios:
• You're not emotionally attached to a single result.
• You're prepared for losses and quick to secure wins.
• You're flexible enough to adapt when new information appears.
Meanwhile, traders who operate on certainties?
They get blindsided, frustrated, and emotional every time the market doesn’t do exactly what they expected.
👉 Trading scenarios = trading professionally.
👉 Trading certainties = gambling with emotions.
Plan your scenarios, manage your risk, and stay calm. That's the trader's way. 🚀

Gold and Chart Patterns I’m dropping this XAU/USD M30 insight because my system’s a damn executioner, and you need to see how I hunt the market. This chart is a textbook of bearish patterns—first a bearish three drives showing smart money exhausting buyers with three weakening upward pushes, then a head and shoulders with the neckline break confirming the reversal, and now a bearish shark forming to seal the deal, all playing out within my descending trendlines. Smart money’s been in control from the start, distributing at the peaks, grabbing liquidity, and dumping price to hunt stop-losses below key levels. Supply and demand zones are my edge—supply at the right shoulder of the head and shoulders where sellers stacked orders before the break, demand near the lower trendline where buyers might step in, my target for this bearish move. My checklist operations are a predator’s playbook. I start with harmonic patterns, hunting XABCD structures like the bearish shark I’m seeing now, signaling smart money’s reversal zones. I confirm market structure, looking for breaks of structure to show trend shifts—here, the neckline break confirms bearish continuation. I identify order blocks, those consolidation zones where smart money stacks orders, like the bearish order block at the right shoulder where sellers distributed. Volume profile is key—I check for high volume nodes where price stalls, like the neckline where sellers defended, and low volume nodes that act as magnets, like gaps below the neckline. Top-down analysis keeps me sharp—four-hour timeframe sets the bearish trend, one-hour confirms the break, thirty-minute narrows the setup, fifteen-minute is my strike zone, waiting for a neckline retest. I use Heikin Ashi for confirmation—red candles mean sell, waiting for red on the fifteen-minute at the retest. Fibonacci levels mark my targets—I focus on key extensions to set exits, like targeting the lower trendline of the channel. Gann theory adds confluence—I look for angles or retracements to align with my setups, like a Gann angle pointing to the lower trendline. MACD and RSI measure momentum—MACD’s bearish crossover and negative histogram confirm the downtrend, RSI below fifty with bearish divergence at the right shoulder seals it. Risk management is my law—I risk small to win big, stop-loss above the right shoulder, take-profit at the lower trendline, aiming for a high reward ratio. I monitor news and liquidity traps—fake spikes above the neckline are smart money’s tricks, so I stay sharp. I wait for confirmation—every piece aligns, or I walk, then I document to keep my edge razor-sharp. I’m rating this system a ten out of ten—harmonic patterns, Smart Money Concepts, volume profile, top-down analysis, and now MACD and RSI for momentum make it untouchable. I’ve fine-tuned this over six months, backtesting until it’s a weapon. I need two of you to join me at Academia—let’s hunt together.DYOR
Shieldsmine Diaries

Navigating Trump Tariffs on the Dow JonesNavigating the movements of the **US30 (Dow Jones Industrial Average)** can be challenging, especially amid shifting economic policies. The Dow, which tracks 30 major U.S. companies, is highly sensitive to trade policies, corporate earnings, and geopolitical risks. Trump’s plan to impose **10% across-the-board tariffs** and **60%+ tariffs on Chinese goods** has sparked concerns about inflation, supply chain disruptions, and retaliatory trade measures. Investors are closely watching how these policies could impact multinational companies within the index, particularly those reliant on global trade, such as **Boeing, Apple, and Caterpillar**.
For everyday Americans, higher tariffs could mean **rising prices on imported goods**, from electronics to household items, worsening inflation. While tariffs aim to protect domestic industries, they often lead to **higher production costs** for businesses that rely on foreign materials, potentially triggering job cuts or reduced consumer spending. The stock market’s reaction—volatility in the US30—reflects these uncertainties, as investors weigh the risks of slower growth against potential benefits for U.S. manufacturers.
Traders navigating the US30 must monitor **Fed policy, corporate earnings, and trade war developments**. If tariffs escalate, defensive stocks (utilities, healthcare) may outperform, while industrials and tech could face pressure. Long-term investors might see dips as buying opportunities, but short-term traders should prepare for turbulence. Ultimately, Trump’s tariff policies could reshape market dynamics, making adaptability key for those trading the Dow.

Option Insights – Trading the Greeks Part 3 of 4: Gamma ScalpingOption Insights – Trading the Greeks Part 3 of 4: Gamma Scalping
Gamma Scalping is a trading strategy that combines long option positions with a hedging position in the underlying asset to isolate and profit from the convexity of options. It is essentially a non-directional swing trading strategy that aims to capture price swings—regardless of direction—by neutralizing the linear component of option value changes and focusing on the convexity gains.
________________________________________
How It Works
Gamma Scalping begins by purchasing a single option or a strangle, and simultaneously entering a hedging position in the underlying to achieve Delta neutrality (the "Delta hedge"). The strategy then waits for a swing in the underlying price in either direction.
Because of the long Gamma position, the position’s value is a convex function of the underlying price. This means that the position will either:
• Gain more than the Delta hedge in a favorable move, or
• Lose less in an adverse move.
The combined position becomes profitable as the underlying moves, regardless of direction. The linear component of the option’s value change—driven by Delta—is hedged, so any residual profit comes from the convexity, i.e., the Gamma.
To realize this convexity profit, the Delta hedge is re-adjusted after the swing has played out. In other words, after the market appears to have reached a turning point, the position is brought back to Delta neutral.
The optimal adjustment points are at the sequential peaks and troughs of the market. Rebalancing at intermediate points captures some convexity value, but typically less than adjusting only at clear turning points.
This is illustrated in the two subcharts of the introductory chart.
________________________________________
How Does Gamma Scalping Make Money?
The change in the value of an option due to a change in the underlying price is approximately the sum of the Delta-weighted change in the underlying (the linear portion) plus a Gamma-weighted convexity component (convexity portion).
• The linear portion is hedged by the underlying.
• The convexity portion remains and represents the profit opportunity.
While the convexity component is typically smaller than the potential linear gain, it is always positive—unlike the linear term, which is only profitable when the direction is predicted correctly.
________________________________________
What’s Being Traded?
Gamma scalping involves adjusting the hedging position—not the options—at perceived turning points in price swings. The options position is kept intact as long as it maintains sufficient Gamma to deliver meaningful convexity.
Even in volatile markets that demand frequent trading, all activity is confined to the underlying, which tends to be liquid and low-cost to trade.
Once the option’s Gamma decays significantly, the entire position (options + hedge) may be reset to “refresh” the Gamma exposure.
________________________________________
What’s the Catch?
The convexity value isn’t free—it comes at the cost of time value decay, as measured by Theta.
If Delta neutrality isn’t re-established promptly during a swing, even a brief counter-move in the underlying can erode the accumulated convexity gains due to time decay. Gamma scalping thus becomes a race between capturing convexity and losing value to Theta.
The key challenge lies in timing:
• Too early: Frequent adjustments reduce overall convexity capture.
• Too late: Time decay eats into the gains.
• Too slow: As expiration approaches, the range in which sufficient Gamma exists narrows, shrinking the window of opportunity.
Despite these challenges, Gamma scalping offers an appealing alternative to traditional directional swing trading, with a more nuanced risk profile. However, it does require experience in managing Theta—especially with short-dated options.
________________________________________
Is Gamma Scalping the Opposite of Time Value Trading?
In a way, yes, but not quite.
Time value trading involves selling options and Delta hedging them—such as in volatility premium strategies (e.g., selling index strangles). These traders aim to minimize realized volatility and capture the decay of implied volatility.
By contrast, Gamma scalping buys options and seeks to maximize realized volatility—through the trader’s own hedging actions. The subtle differences in hedge execution distinguish these two approaches.
This contrast—and what it means to minimize or maximize realized volatility in a hedging strategy as well as time value trading itself—will be explored in more depth in Part 4 of the “Options Insights – Trading the Greeks” series.
________________________________________
Coming Up Next:
📘 Part 4: Time Value Trading and Volatility Premium
by parsifaltrading

Why I Deal With Losses Before They Even Appear📉 Mastering the mindset that most traders avoid
There’s a moment that happens in every trader’s journey — not during a win, but during a loss.
A frozen moment where your mind screams, “It shouldn’t have gone this way!”
You look at the screen, your stop is hit, your equity drops, and your brain starts the negotiation:
“What if I held a bit longer?”
“Maybe the stop was too tight.”
“I need to make this back. Now.”
But the problem didn’t start with that loss.
It started long before you placed the trade.
________________________________________
💡 The Biggest Lie in Trading: “I’ll Deal With It When It Happens”
Too many traders operate from a place of reactivity.
They focus on the chart, the breakout, the “R:R,” the indicator... but they forget the only thing that actually matters:
❗️ What if this trade fails — and how will I handle it?
That’s not a pessimistic question.
It’s the most professional one you can ask.
If you only accept the possibility of a loss after the loss happens, it’s too late.
You’ve already sabotaged yourself emotionally — and probably financially, too.
So here's the core principle I apply every single day:
________________________________________
🔒 I Accept the Loss Before I Enter
Before I click "Buy" or "Sell," I already know:
✅ What my stop is.
✅ How much that stop means in money.
✅ That I am 100% okay losing that amount.
If any of those don’t align, the trade is dead before it begins.
This is not negotiable.
________________________________________
🚫 Don’t Touch the Stop. Touch the Volume.
One of the biggest mistakes I see — and I’ve done it too, early on — is this:
You find a clean technical setup. Let’s say the proper stop is 120 pips away.
You feel it’s too wide. You want to tighten it to 40. Why?
Not because the market structure says so — but because your ego can’t handle the potential loss.
❌ That’s not trading. That’s emotional budgeting.
Instead, keep the stop where it technically makes sense.
Then reduce the volume until the potential loss — in money, not pips — is emotionally tolerable.
We trade capital, not distance.
________________________________________
🧠 This Is the Only Risk Model That Makes Sense
Your strategy doesn’t need to win every time.
It just needs to keep you in the game long enough to let the edge play out.
If your risk is too big for your mental tolerance, it’s not sustainable.
And if it’s not sustainable, it’s not professional trading.
The goal isn’t to be right. The goal is to survive long enough to be consistent.
________________________________________
📋 My Framework: How I Deal with Losses Before They Show Up
Here’s my mental checklist for every trade:
1. Accept the loss before entering.
If I’m not okay losing X, I reduce the volume or skip the trade.
2. Set the stop based on structure, not comfort.
If the setup needs a 150-pip stop, so be it. It’s not about feelings.
3. Adjust volume to match my comfort zone.
I never trade “big” just because a setup looks “great.” Ego has no place here.
4. View trades as part of a series.
I expect losses. I expect drawdowns. One trade means nothing.
5. Be willing to exit early if the story changes.
If price invalidates the idea before the stop is hit (or the target), I’m gone.
________________________________________
🧘♂️ If You Can’t Sleep With the Trade, You’re Doing It Wrong
Peace of mind is underrated.
If a trade is making you anxious — not because it’s near SL, but because it’s threatening your sense of control — something is off.
And that something is usually your risk size.
Professional trading isn’t built on adrenaline.
It’s built on calm decisions, repeated for years.
________________________________________
🏁 Final Thoughts: Profit is Optional. Loss Management is Mandatory.
If you want to become consistent, start every trade with a simple, brutally honest question:
“Can I lose this money and still feel calm, focused, and in control?”
If the answer is no, you’re not ready for the trade — no matter how good the chart looks.
Profit is a possibility.
Loss is a certainty.
Master the certainty. The rest will follow.
🚀 Keep learning, keep growing.
Best of luck!
Mihai Iacob

How To Customize The 1 Minute Scalping IndicatorThis tutorial explains each setting of the 1 Minute Scalping Indicator in detail so you understand exactly how to adjust your settings to get the results you would like from the indicator.
Here is a list of the details we discuss:
How to fix loading errors
Tooltips that explain each setting for your reference
Trade modes and how they are affected by other settings
Average candle size rejection parameters
Higher timeframe candle filters, settings and levels
External indicator trend filtering capabilities and how to set them up correctly
Stoploss and take profit calculations and settings you can adjust
Signal arrow customization options
Candle coloring adjustments
Visual/styling options
Make sure to watch the whole video so you fully understand how each setting affects the indicator for best results.

How do I know if a day will be bullish?"Daily Bias" is one of the most asked questions by traders!
You’ve probably heard someone say:
“If only I knew where the candle would expand, I’d be rich!”
Well, today I’m sharing a framework that can help you start answering that exact question.
🚶🏽♂️Walk with me as we break down the ES Futures Daily Candle for April 24, 2024.
By the end of this video, you'll have a solid starting point to study and apply this method—
#OneCandlestickAtATime

Why Should You Care About ER?🚀 Hey Traders! Have You Ever Felt Lost in the Chaos of Market Fluctuations?
What if I told you there’s a powerful tool that can help you cut through the noise and give you a statistical edge to predict SUPPORT and RESISTANCE movements with confidence?
Let me take 5 minutes of your time to introduce you to something that could transform your trading game: Expected Range Volatility (ER) .
What is Expected Range Volatility (ER)?
The Expected Range (ER) is a framework that helps traders understand how much an asset is likely to move within a specific timeframe. Based on CME market data and Nobel Prize-winning calculations, price movements within the expected volatility corridor have a 68% probability of staying within those boundaries.
💡 Key Insight: When the price approaching certain levels, there’s a 68% chance the price won’t break through those boundaries. This means you can use ER as a powerful filter to identify more precise entry and exit points for your trades.
Why Should You Care About ER?
When I first discovered the ER tool, it felt like stumbling upon a gold mine in the trading world. Here’s why:
It’s free and available on the CME exchange’s website.
It’s underutilized —95% of traders don’t even know it exists.
It provides statistical clarity in a world full of uncertainty.
I remember the first time I used ER in my analysis—it completely changed the way I approached intraday trading. Now, I never make a trade without checking the ER data. It’s become an essential part of my strategy.
How to Use ER in Your Trading
1️⃣ Input the Data: Head over to the CME website, plug in the necessary parameters, and get your ER values.
2️⃣ Set Boundaries: Use the ER range as a guide to set potential support and resistance levels.
3️⃣ Filter Trades: Only take trades that align with the ER framework to improve your precision.
A recent example is the Japanese yen futures market.
Don't be confused by the fact that we take futures levels, it can easily be plotted on a spot chart for forex market (the dollar/yen).
Limitations to Keep in Mind
While ER is a powerful tool, it’s not a crystal ball. Here are some limitations:
Market Dynamics: Short-term price movements can be unpredictable due to sentiment, news, or economic events. ER provides a statistical estimate, but it doesn’t guarantee outcomes.
Assumptions: The formula assumes price movements follow a log-normal distribution , which may not hold true in all market conditions.
Your Turn: Are You Using ER in Your Strategy?
💭 Here’s the million-dollar question: Are you leveraging the power of Expected Range Volatility in your trading? If not, why not start today?
💬 Share your thoughts in the comments below:
Do you currently use ER or similar statistical tools?
Want to Dive Deeper?
If you’re ready to take your trading to the next level, don’t miss out on our all-in-one resource designed to help you master tools like ER and other valuable sources to gain market edge!
🔥 Remember:
No Valuable Data = No Edge!

Option Insights – Trading the Greeks (Part 2 of 4):Gamma Effects# Option Insights – Trading the Greeks (Part 2 of 4)
## Option Convexity and Gamma Effects
### Gamma – The Convexity of Options
Gamma measures how much the Delta of an option changes in response to movements in the underlying asset’s price. Mathematically, it is the second derivative of the option’s value with respect to the price of the underlying. In simpler terms, Gamma quantifies the curvature—or convexity—of the option’s price sensitivity.
- Positive Gamma: Accelerating Delta as the underlying moves.
- Negative Gamma: Decelerating Delta as the underlying moves.
This convexity becomes especially important for traders managing exposure. A directional trader might seek:
- Positive Gamma near anticipated breakouts to increase exposure during favorable moves.
- Negative Gamma in areas where they want to taper exposure, such as in covered call setups (where the short call reduces gains as price rises).
---
## Gamma and Delta Hedging
Traders who Delta hedge their option positions using the underlying (or a Delta-1 instrument) face the reality of nonlinearity: Delta changes as the market moves, and Gamma determines how fast.
In practice, this means hedgers must adjust frequently to maintain a neutral Delta—Gamma tells them how often and how aggressively.
---
## Hedging a Position with Positive Gamma
When hedging and holding positive Gamma:
- If the underlying price rises → Delta increases → Sell the underlying.
- If the underlying price falls → Delta decreases → Buy the underlying.
This results in countercyclical trading, i.e., trading against the market trend.
**Advantages:**
- Potentially dampens volatility.
- Allows for limit order execution (e.g., sell at offer when price rises), capturing bid-offer spreads.
- Automated or semi-automated setups possible.
---
## Hedging a Position with Negative Gamma
With hedging and holding negative Gamma, the adjustments are procyclical:
- Price rises → Delta drops → Buy more underlying.
- Price falls → Delta rises → Sell more underlying.
**This means:**
- You're chasing the market, increasing exposure in the direction of the move.
- You likely cross the spread to ensure execution (lifting the offer or hitting the bid).
- This behavior tends to amplify volatility and incurs transaction costs.
---
## Summary: Gamma's Impact on Hedging
- Long Gamma → Hedge countercyclically, dampen market movements, and potentially profit from spreads.
- Short Gamma → Hedge pro-cyclically, amplify market movements, and pay the spread.
This distinction underscores a critical point: hedging Delta is not just about neutralizing exposure—it’s about managing how that exposure evolves, which is precisely what Gamma represents.
---
## Can You Hedge Delta Without Gamma Risk?
**In theory?** Yes.
**In practice?** Not really.
Hedging an option (a nonlinear instrument) with the underlying (a linear one) means you’re using a linear approximation of a curved payoff structure. This hedge is only locally accurate—it must be rebalanced frequently to remain effective.
While it’s theoretically possible to hedge both Delta and Gamma using other options, this introduces complexity:
- Other Greeks (like Theta and Vega) enter the equation.
- Option hedges are often illiquid, expensive, or difficult to scale.
For most traders, hedging Delta with the underlying remains the simplest, most liquid, and most cost-effective approach—despite the need for Gamma-based adjustments.
---
## Gamma Trading & Gamma Scalping
Even in non-directional strategies, Gamma has value.
Gamma scalping involves actively trading the underlying around an options position to exploit short-term price swings:
- You buy low and sell high as the underlying fluctuates,
- Profiting from volatility, not direction.
This is a powerful technique for monetizing Gamma, particularly when implied volatility is elevated relative to realized moves.
---
## Coming Up Next:
📘 Part 3: Gamma Scalping – Monetizing Convexity Through Active Hedging
by parsifaltrading

Option Insights – Trading the Greeks (Part 1 of 4): Delta Target# Option Insights – Trading the Greeks (Part 1 of 4)
## Delta Targeting
Options are often utilized by traders as a leveraged tool, akin to generating lottery tickets. By selecting the appropriate expiration time and strike price, it's possible to achieve significant leverage on an underlying asset, potentially yielding high profits in percentage terms, albeit with a low probability of occurrence.
However, trading options offers more than just directional bets on the underlying asset. Due to their dependence on various factors with distinct characteristics, option strategies enable flexible exposure management and innovative risk profiles.
To fully exploit the potential of options, risk factors are quantified using the **Greeks** – Greek letters (not all of them) that assess the sensitivity of option prices to changes in different risk factors ("primary Greeks") or second-order effects ("secondary Greeks").
### Primary Greeks:
- **Delta** – sensitivity to changes in the underlying price
- **Theta** – sensitivity to changes in time
- **Vega** – sensitivity to changes in implied volatility
- **Rho** – sensitivity to changes in interest rates
### Secondary Greeks:
- **Gamma** – rate of change of Delta with respect to the underlying
- **Vanna** – rate of change of Delta with respect to implied volatility
- **Charm** – rate of change of Delta with respect to time
- **Volga** – rate of change of Vega with respect to implied volatility
For trading purposes, **Delta, Gamma, Theta, and Vega** are the most critical Greeks.\
They are depicted in the introductory graphs for Call Options, showing their behavior as a function of the underlying price across various levels of implied volatility.
*(Graphs not shown here — you can add screenshots as image uploads if needed.)*
---
## Trading the Greeks: Delta
The art of trading options is fundamentally the art of managing an option portfolio by **trading the Greeks**. For short-term options (from same-day expiration, or 0DTE, up to about three months), **Delta** is the dominant risk factor. The influence of other Greeks is limited to a narrow range around the strike price — this range becomes even narrower as expiration approaches.
When managing an options position, **controlling Delta is the first and most critical step**.
- Delta values range from 0% to 100% for long calls and short puts
- From -100% to 0% for long puts and short calls
- Delta represents the participation rate of an option in the underlying asset’s price movement
Example:\
If an option has a Delta of 40% and the underlying asset moves by 10 points, the option’s price will typically move by approximately 4 points in the same direction.
Delta can also be loosely interpreted as the **implied probability** that the option will expire in the money — though this is only an approximation.
---
## Delta-Neutral Strategy
The most common Delta-targeting strategy is the **Delta-neutral strategy**.
It aims to hedge the Delta of an options position by taking an **offsetting position in a Delta-1 instrument**. These instruments replicate the price movements of the underlying asset (e.g., the underlying itself, ETFs, futures, or CFDs).
### Example:
- If an options position has a Delta of 40% and a notional exposure of 100 units
- → Take a short position in 40 units of the underlying (or equivalent Delta-1 instrument)
But:\
Delta is **not constant** — it evolves over time (**Charm**), with price changes (**Gamma**), and with changes in implied volatility (**Vanna**).\
This means the hedge must be **adjusted regularly** to maintain Delta neutrality.
Adjustments are typically:
- Made at discrete intervals (e.g., daily)
- Or when Delta changes by a set amount (e.g., more than 5%)
---
## Delta Target Strategy (More General)
The Delta-neutral strategy is a **specific case** of a broader **Delta target strategy**, where the Delta target is explicitly set to zero.
### Who uses Delta target strategies?
- Option **market makers** to hedge inventory
- Traders aiming to **isolate other risk factors** (e.g., volatility premium strategies like short strangles)
These traders seek to:
> **Capture the volatility premium** — the difference between implied volatility at entry and realized volatility after
Delta target strategies with **non-zero targets** are used for managing portfolio-level risk when options are used alongside other instruments.
---
## Why Adjust Delta Target Strategies?
The main reasons for adjusting:
- **Gamma (convexity)**: Delta changes as the underlying moves
- **Time decay**:
- For OTM options: Delta decreases (calls), increases (puts)
- For ITM options: Opposite behavior
- **Changes in implied volatility or skew**: also affect Delta
---
## Coming Up Next:
📘 *Part 2: The Concept of Convexity and the Role of Gamma in Managing Delta Target Strategies*
---

How To Filter Signals On The 1 Minute Scalping IndicatorThis tutorial shows you how to use external indicators to filter out signals on the 1 Minute Scalping Indicator so that you only get signals that are in the direction of the trend.
Step By Step Process:
1. Pick an external indicator that provides an output value of 1 for bullish, -1 for bearish or 0 for neutral and add it to your chart. We have multiple indicators that can do this, but you can also customize your own indicators to provide this value and use that to filter out signals.
2. Set your desired trend parameters on your external indicator and make sure that indicator is on the same chart as the 1 Minute Scalping Indicator.
3. Go to the indicator settings for the 1 Minute Scalping Indicator and turn on one of the 3 available External Indicator Filters. Then from the dropdown menu, select the external indicator you want to use and make sure to choose the output value that gives the 1, -1 or 0 output for trends. Our indicators will have an output titled "Trend Direction To Send To External Indicators" to make that value easy to find in the dropdown menus.
That's it! Let the 1 Minute Scalping Indicator reload with the external indicator trend values and it will only show buy signals during bullish trends, only show sell signals during bearish trends or no signals during neutral markets. Make sure to back test your setup until you find the best external indicators and settings to use that work best for your trading style and then apply that setup to any chart you would like.
Here is the code you can use to add a trend value to your own custom indicators and send it to the 1 Minute Scalping Indicator:
trendDirection = 0
if close > ema1
trendDirection := 1
else if close < ema1
trendDirection := -1
else
trendDirection := 0
plot(trendDirection, title="Trend Direction To Send To External Indicators", color=#00000000, display=display.data_window)
Change the (close > ema1) and (close < ema1) to use your own variables from within your script.

How Many Trades Does It Take to Get Rich?Let me tell you straight — one trade won’t make you rich. It’s almost impossible. The odds are simply too low. And that’s the very foundation of my approach — an approach that has already brought me meaningful results.
The Myth of the One Trade
The biggest trap traders fall into is placing all their hopes on a single trade — one that’s supposed to fix everything. That’s where the problems begin: oversized positions, impatience, emotional attachment... and eventually, tilt. And tilt does exactly the opposite — it wipes out your account.
The solution? Stretch the process out over time. Doing this alone significantly increases your chances of actual profit — instead of blowing everything up in a short burst.
What That Creates
By shifting away from the “one big trade” mindset, you remove urgency, bring risk under control, and turn your trading into a stable process. That’s the core of what I teach: break your trading into as many small, manageable episodes as possible.
Divide your “luck” into smaller parts — and you’ll be able to attract it in the long run.
This mindset comes with far more advantages than downsides. And deep down, you already know that. So start applying it — make this your starting point toward meaningful results.
Letting Go of the Old Way
Don’t worry about how long it might take to see significant growth in your account. You can always go back to your old way of trading — jumping in and trying to “make money today.” But ask yourself: how many times do you need to get burned before you finally shift from a short-term mindset to a long-term one?
Add to that some information isolation — stop feeding your brain constant news noise. Let go of headlines that pretend to predict the market. Free yourself from that influence, and you’ll start to see the charts clearly — without the illusions, without the made-up narratives.
One Last Thing
If you’re still holding on to the idea that you can achieve serious results without deeply studying this craft — and without putting in real time — let me suggest something: drop that belief now, before you even begin.
You don’t have to. But eventually, after enough feedback from the market, you’ll let it go anyway. It’s just a matter of time. The sooner you accept this, the easier your path will become.
And if you can’t let go of that illusion — your only real option is to leave the market.
Social media exists to drive engagement. And where there’s engagement, there’s exaggeration. That’s what feeds the false ideas you might unknowingly absorb about trading and beyond.
People show the upside — but rarely the downside.
Discipline in Trading: The Indicator That Works 100% of the TimeEvery trader has that one folder — “Winning Indicators,” “Secret Scripts,” or the iconic “Final Strategy v12_REAL_THIS_ONE_WORKS.” It's where we hoard indicators like Pokémon, convinced the next RSI+MACD+SMA combo tweak will finally reveal the holy grail of trading.
Spoiler: it won’t. Because the real indicator that works — actually works — isn’t on your chart. It’s not in a TradingView script. It’s not even on your screen.
But it’s there — etched into your trade history, tattooed into your losses, and reflected in your ability (or inability) to stop yourself from clicking “buy” because Elon Musk tweeted a goat emoji.
It’s called discipline . And it’s the only thing in trading that has a 100% hit rate… if you let it.
Let’s talk about why discipline isn’t just a virtue — it’s the foundation of every successful trader you admire. And why, ironically, it’s forged in the moments you want to throw your monitor out the window.
👋 Everyone’s a Genius — Until the Market Slaps You
When things are going well, discipline feels unnecessary. You enter a trade on a hunch, it flies. You skip the stop loss, and price reverses right where you “felt” it would. You’re up three trades in a row, so clearly you’ve transcended markets and deserve your own hedge fund. Right?
Until you don’t. And the one time you triple down on a loser “because it always bounces”… it doesn’t. And suddenly you're not a genius — you’re Googling how to recover a blown account and wondering if that crypto bro who offered signals still has his DMs open.
The reality is that everyone trades well in good times — bulls make money in rising markets and bears make money in falling markets. But real traders are made in the bad times. That’s where discipline is forged.
🧐 No Pain, No Gain
Here’s the deal: discipline is not something you're born with. It’s built, brick by painful brick, on the smoldering ruins of your worst trades.
The overleveraged EUR/USD short you held through an ECB rate hike? Discipline.
The meme stock you bought at the top because your barista mentioned it? Discipline.
The four back-to-back trades you entered on revenge mode after getting stopped out? Discipline — with a side of therapy.
These moments suck. But they’re also where the learning happens. You don’t develop discipline from your wins. You develop it from losses that leave a mark. The kind of mark you think about while brushing your teeth. The kind that whispers: “maybe follow the plan next time.”
🤝 Success Leaves Clues
You’ve probably heard the phrase “plan your trade and trade your plan” so many times it’s lost all meaning. But it’s the foundation of discipline. Not because rules are fun, but because rules are the only thing that can protect you from… well, yourself.
Let’s be honest — if left to your own devices, you run the risk of:
Entering too early because “it looks like it’s going to move.”
Exiting too late because “it might come back.”
Increasing the leverage because “I’m due for a win.”
Successful traders are those who follow a disciplined, rule-based approach to trading. Discipline says no. It says “this is the plan” and makes you stick to it — even when your ego is telling you to wing it. Discipline doesn’t care about your feelings. It cares about consistency. And that’s what makes it powerful.
🎯 Hedge Fund Bros Who Didn’t Win by Binge-Clicking
Let’s talk about those who actually did launch a fund — and didn’t blow it up in three months. Stanley Druckenmiller, former lead portfolio manager for George Soros’s Quantum Fund who later went on to launch his own Duquesne family office, famously said:
“The key to making money in markets is to have an opinion and to bet it big. But only when the odds are heavily in your favor.”
Notice what he didn’t say: “Click as many buttons as possible and hope it works out.”
Druckenmiller didn’t trade because he was bored. He waited. He watched. And when his setup came, he struck with discipline. Not with fear. Not with greed. With process.
If one of the greatest macro traders of all time had the patience to wait for his edge, maybe you don’t need to scalp every green candle on the 1-minute chart.
Ray Dalio — the one who built Bridgewater into a hedge fund juggernaut — doesn’t sugarcoat it: trading is hard. And mistakes are inevitable. Discipline, Dalio says, is what turns mistakes into evolution. His famous mantra?
“Pain + Reflection = Progress.”
He built a company culture (and a personal philosophy) around radical transparency — writing down every mistake, analyzing every trade, and building systems that override ego.
Most traders experience pain. Very few pause to reflect. Fewer still build processes to avoid making the same mistake twice. So next time you get stopped out for the third time in a row, don’t curse the chart. Open your journal. Write it down. Check what you missed. That’s what turns amateurs into professionals.
👀 Discipline in Trading: How It Actually Looks
Discipline isn’t glamorous. You won’t post it on Instagram (maybe it's good for LinkedIn, though). But here’s what it looks like in the wild:
Passing on a trade that doesn’t check all the boxes — even though you’re “pretty sure it’ll work.”
Taking a small win and moving on, even when your gut says to hold and “let it ride.”
Staying flat on FOMC day because you know news candles have a personal vendetta against your stop-losses.
Journaling a bad trade and owning the mistake. No excuses. Just honesty.
💪 How to Build Discipline
Building discipline isn’t about becoming a robot. It’s about creating a process that works even when your emotions don’t.
Here’s how to start:
Journal everything : Not just your trades, but your thoughts before and after. Discipline grows in awareness.
Have a checklist: Make it stupidly simple. If a trade doesn’t check every box, don’t take it.
Pre-set your risk: Before the trade. Not after. You’re not negotiating with yourself mid-trade.
Set trade limits: Three trades per day. One setup per session. Whatever keeps you from spiraling.
Take breaks: If you’re chasing losses, walk away. The markets will be there tomorrow. Will you?
📌 Final Thought: Why Discipline Works
You can have the best tools, the slickest chart setup, and the strongest trade ideas. But if you can’t follow your own rules, you won’t go far.
Discipline isn’t flashy. It doesn’t promise 1,000% returns or viral content. It just works. Quietly. Relentlessly. Predictably.
And when the market turns — because it always does — discipline is what will keep you standing.
Because it’s not the indicator that matters. It’s the trader using it.
So, be honest—where has discipline made (or broken) your trading? And what’s your best tip for sticking to the plan when your brain wants to do anything but?

The Importance of Framing a NarrativeIn this video I go through a trade setup and the importance of framing a narrative in your trading. This allows you to wait for trades to come to you, rather than making up trades out of thin air, which we all know does not usually end well.
I hope you find this video insightful.
- R2F Trading

Best Liquidity Grab / Sweep Strategy For Trading Forex & Gold
Learn how to trade liquidity grab / sweep with multiple time frame analysis.
Discover how to combine top-down analysis and smart money concept SMC for trading forex and gold.
You will get a complete step by step trading strategy with entry, stop loss and target.
1. In order to trade liquidity grab / sweep properly, you need to find liquidity zones first.
For this trading strategy, the best liquidity zones will be on a daily time frame.
Check these 2 significant liquidity zones on EURAUD forex pair on a daily.
The zone where the selling activity concentrate will be called a supply zone. While the zone with a strong concentration of a buying activity will be a demand zone.
2. After that, you should look for a liquidity grab / sweep.
For a valid liquidity grab / sweep the daily candle should violate the liquidity zone only with the tail / wick of the candle , while the body should stay within the zone.
Above is the example of a liquidity grab of a demand zone.
While the daily candle closed within the underlined area, the wick went beyond that.
3. After you identified a liquidity grab/sweep, start analyzing lower time frames . For this strategy, the best time frames are 4H and 1H.
On these time frames, you should look for a consolidation and a formation of a horizontal range.
Here is such a range on EURAUD on a 4H.
These ranges will be used for confirmation .
Your bullish signal will be a breakout of the resistance of the range ,
it will confirm a strong buying interest after a liquidity grab.
That is the example of such a confirmation.
4. After that, set a buy limit order on a retest of a broken resistance of the range. Take profit will be the closest strong resistance, stop loss will be below the support of the range.
That is how we trade a liquidity grab/sweep of a demand zone.
With the supply zone liquidity grab trading strategy, you should wait for a bullish liquidity sweep followed by a bearish breakout of a range on a 4H / 1H time frames.
I always say to my students that a single time frame analysis is not sufficient for profitable trading SMC.
A proper combination of multiple time frames is the key to consistent profits.
Following this strategy, you should achieve up to 80% winning rate trading liquidity grabs / sweeps.
❤️Please, support my work with like, thank you!❤️
I am part of Trade Nation's Influencer program and receive a monthly fee for using their TradingView charts in my analysis.

AMP Futures - Boost your analysis with TPO summary info.In this idea we will demonstrate how to add the new Summary info table for TPO charts using Tradingview.

Emotional Management — The Hidden ComponentIn this piece, I’ll touch on one of the most important topics — a core obstacle on the path to consistent and profitable trading.
We need to explore where certain emotions come from and how to work with them in order to better understand ourselves. What truly fits our nature, what common mistakes we make, and how to avoid them moving forward.
Until we learn how to navigate these internal roadblocks, we won’t be able to achieve stable financial results.
The Scariest Part
Let’s get straight to the point. The scariest thing that can happen to us in trading is a stop-loss being hit — in other words, taking a loss on a trade.
Scary? I don’t think so. This is a parameter we can control ourselves.
If we’re building a setup, we must define the size of the stop-loss — the amount we’re willing to risk if things go wrong.
And keep in mind: this risk will always be there, no matter how experienced or skilled you become. Don’t fall into the trap of thinking that this time is different — that this setup feels so strong, so obvious, that there’s no way it could fail.
Spoiler: that’s exactly when you should start tracking your trades.
Every time you feel this kind of overconfidence, log it in a spreadsheet. I can already tell you what you’ll find: 1 to 3 out of 10 of those “super strong” setups will end up hitting your stop. Which means — your feeling of conviction had zero correlation with how price actually moved. The market simply didn’t care what you thought about it.
And one step further: even if your technical model is solid and well-developed, you still can’t predict the future with certainty. That means you also can’t ever be 100% sure your stop won’t get hit.
Does that make sense? Good — let’s move on.
Loss
Since we’re not all-powerful, we have to use stop-losses — and calculate them in a way that, at the very least, doesn’t make us feel pain when they’re hit. At the same time, the stop should be set at an optimal level, so we still feel the potential for profit. Otherwise, our brain won’t engage with the market properly — it won’t sense the reward, and that can distort our analysis.
This often leads to vague, low-quality setups — but even that is far less dangerous than oversizing positions to the point where potential losses feel unbearable.
See that fine line? Most of trading psychology and emotional control comes down to how we relate to loss. That’s where the real pressure is rooted.
Emotional Space
We experience both negative and positive emotions — that’s the full spectrum.
Your trading will only be high-quality if you avoid emotional imbalance. In other words, you need to stay centered and calm. Any excess emotional charge — whether negative or positive — will inevitably work against you.
If you’re stuck in the negative zone, you’ll start feeling anger and frustration, which will cloud your judgment and prevent you from thinking clearly during the trading process.
But being too far into the positive zone is just as dangerous — it leads to greed and overconfidence, which often result in oversized positions and dangerously wide stop-losses.
Both ends of the spectrum, if left unchecked, will push you into tilt — a state where you can no longer evaluate reality objectively and start making impulsive decisions. This is how traders end up losing a significant part — if not all — of their account.
The Algorithm
Let’s go back to what we covered earlier — the core catalyst behind tilt: violating your predefined stop-loss size.
You must first determine a loss amount that feels emotionally tolerable to you. Ideally, this number should be fixed, and you should never exceed it (except later, as your account grows). Once you’ve done that, you now have a simple algorithm: you build your setups using the same fixed-risk amount — and under no circumstances should you go beyond that limit.
This creates awareness in the brain. It knows the predefined threshold, is prepared for a negative outcome, and remains calm. Imagine a circle — as long as you stay within it, in your zone of comfort, you can operate with clarity and discipline.
But the moment you step outside that circle, your mind starts to feel stress. And if you don’t catch yourself in time, that stress escalates — leading you straight into a tilt state.
Emotional Triggers
Here’s where it gets both complicated — and surprisingly simple. All you need to do is follow one rule. But even that becomes difficult for many, because they give in to greed — the kind that pushes you to increase position size just because the setup “feels certain” (something I’ve already mentioned before).
On the other side of the spectrum, anger and frustration start to build — especially if you’ve just taken a loss and your mind shifts into “recovery mode.”
That emotional urge makes you want to win it all back quickly, so you raise the size of your next trade — planning to return to your original account balance first, and then go back to your normal risk-management rules. That’s a fatal mistake.
Here’s my advice: when you're in a drawdown — emotionally and financially — you should actually lower your stop size, not increase it, until you get back to a neutral baseline.
Both negative emotions (sadness, anger, frustration, disappointment) and positive ones (joy, excitement, euphoria) can push you to break your risk limits. The emotional trigger may be different, but the outcome is the same: you oversize.
The only time you should be trading is when you're in a neutral state of mind — for example, operating from a place of interest or curiosity.
It’s All in Our Hands
Understand this: we are the only ones truly responsible for executing our plan. If we increase our position size beyond what we should — that’s on us. If you know you’re making a mistake, why let it happen anyway? We control the entire process. If we truly don’t want to blow the account, we won’t — because we’ve calculated the risk beforehand.
Let me repeat: if we follow the plan and don’t act impulsively, we will never blow our account. That’s the foundation for building consistency in trading.
But the more unstable our emotional state becomes, the easier it is to step outside that “mental circle” and trigger a stress response. That stress inevitably leads to tilt. You’ll start reacting to everything — someone was rude to you, a fear of not having money for food, whatever. It all begins to pour into your trading: chaotic entries, random sizing, total abandonment of your risk rules. And in most cases, this spiral ends with one thing — a blown account.
The Solution
That’s why you should always monitor your emotional state — and ideally, keep a journal where you track how you feel each day. The moment you notice that you’re starting to lose control, step away from trading immediately. That’s the smartest decision you can make. I say this from experience — it’s been proven many times.
Yes, it’s hard to do — I get it. But remind yourself of this: if you keep trading in that state, there’s a high chance you’ll lose a significant part of your account. And when that happens, you’ll feel even worse — blaming yourself for not stepping away when you could have.
So yes, it’s difficult — but still far easier than dealing with the damage. The best move is to shut down your trading platform and avoid looking at charts for at least three full days. Shift your focus to something else entirely — anything that helps you stop obsessing over the market.
When those thoughts disappear — the ones about urgently making money back or hitting a certain target — that’s when you’re ready to return to trading with a clear and steady mindset.
The Takeaway
This is the core of what happens inside us — and how to respond to it. In most cases, this is the exact cycle that plays out. Everything else — more unique emotional patterns, sudden urges to break your own limits — will emerge with time.
Your job is to learn how to spot those triggers, notice your internal reactions, and pull yourself away from the screen before the damage is done.
Wishing you strength and clarity on this path.

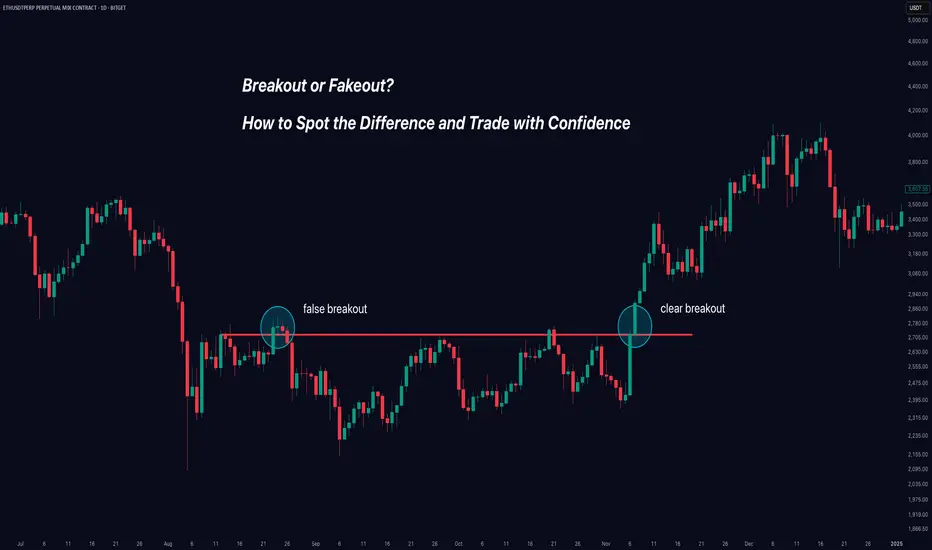
Breakout or Fakeout? How to Spot the Difference and Trade.Trading breakouts can be exciting - and profitable - when they're real. But how do you avoid getting caught in those frustrating false breakouts (fakeouts) that trap many traders?
In this clear and practical guide, you'll learn exactly how to identify genuine breakouts, avoid traps, and improve your trading decisions instantly.
Here's what we'll cover:
✅ Real Breakouts vs Fakeouts: Why it matters.
✅ Market Psychology: Why false breakouts happen.
✅ Volume: Your best friend for spotting authenticity.
✅ Price Structure & Context: When breakouts mean business.
✅ Momentum Confirmation: The hidden indicator that changes everything.
Let’s dive in!
🚩 Real Breakout vs Fakeout: Know the Difference
A breakout occurs when price decisively moves beyond a clear support or resistance level. Imagine Bitcoin breaking above $50,000 or Gold dropping below $1,900.
A fakeout happens when price briefly breaks these key levels—but quickly reverses, leaving traders stuck on the wrong side of the market.
Why it matters: Fakeouts aren't just frustrating—they’re costly. They drain your capital and confidence. Recognizing them early keeps you profitable and disciplined.
🧠 Why Do Fakeouts Happen? (The Psychology)
Fakeouts thrive because traders chase excitement and fear missing out (FOMO). Here’s the secret many traders overlook:
Bull and Bear Traps: Institutional traders deliberately push prices slightly past key levels to trigger stop orders—only to reverse the price sharply.
FOMO-driven trades: Retail traders jump in excitedly at any small breakout, providing fuel for these short-lived moves.
Understanding these tactics can help you stay calm and avoid impulsive entries.
🔥 Volume: The Ultimate Breakout Indicator
Want to know if a breakout is real? Look at volume—it reveals the market’s true intention.
High Volume: Means broad market participation and conviction, supporting a genuine breakout.
Low Volume: A red flag! This signals low market conviction and a higher likelihood of reversal.
Example: If Ethereum breaks above $4,000 with unusually high volume, that's a strong signal. But if volume remains low, beware—it's likely a fakeout.
📐 Context and Price Structure Make a Difference
Not all breakouts are created equal. Pay attention to these key context clues:
Trend Alignment: Breakouts in the direction of a clear existing trend are more reliable.
Significance of Level: Breakouts of major support/resistance levels (weekly or monthly highs/lows) have higher odds of success.
Follow-through and Retests: Genuine breakouts often retest broken levels, turning old resistance into new support.
⚡ Momentum Confirmation: Your Secret Weapon
Momentum indicators (like RSI or MACD) tell you what's happening beneath the surface. They help confirm or reject breakout validity:
Strong Momentum: If indicators confirm the breakout direction, the breakout is more reliable.
Divergence (Warning Sign): If price makes a new high but momentum indicators show lower highs, beware—a fakeout could be near.
Use momentum as your final confirmation step. It’s the missing piece that many traders ignore.
🎯 Quick Breakout Checklist
Use this simple checklist next time you're assessing a breakout:
🚦 Trade Breakouts Wisely: Final Tips
Be Patient: Waiting for breakout confirmation saves you from costly mistakes.
Set Clear Stops: If a breakout fails, exit quickly. Small losses protect your capital.
Scale into Trades: Enter gradually to manage your risk effectively.
Mind Market Context: Always align breakouts with the broader market direction.
Trading breakouts doesn't have to be stressful. When you know what signs to watch for, you trade with confidence—not guesswork.
🚀 Conclusion: Trade Better, Not Harder
Avoiding fakeouts is all about patience, confirmation, and understanding market psychology. By using volume, context, and momentum effectively, you'll greatly improve your breakout trading.
Now, put these strategies into practice. Stop guessing—start confidently trading real breakouts today!
Happy Trading!
Like this post? Follow us for more clear, actionable trading education.
#TradingTips #Breakouts #TechnicalAnalysis #TradingEducation #Crypto #Forex #StockTrading
MAY 1-1-1 TRADING CHALLENGEI’ve been thinking about how messy trading can get.
One day you're watching a video on scalping, the next you're trying to swing trade five different pairs. Then before you know it, your screen is cluttered with a million indicators, your confidence is shot, and your results? Even worse.
So for the month of May, I’m doing something different.
I’m calling it the 1-1-1 Challenge
1 Mentor. 1 Instrument. 1 Setup.
For me, that means:
- I’m sticking with Tori as my mentor. No other videos, no mixed signals.
- I’m focusing only on Crude Oil. That’s my chart, my market.
- And I’m trading only Trendline Breaks. Clean and simple.
That’s it. Pure focus. Pure discipline.
Let’s see what happens when I stop trying to trade everything — and start mastering one thing.
If you’ve been feeling the same kind of overwhelm, maybe this challenge is for you too.
Want to join me in May?
Let’s go all in:
1 Mentor
1 Instrument
1 Setup
I'll be sharing my progress and documenting my journey here. Follow me!

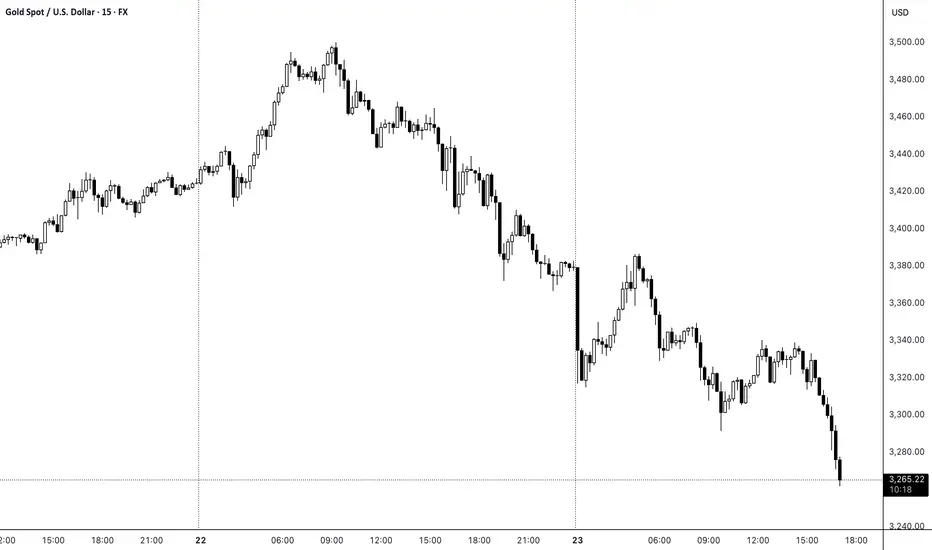
No Setup, No Trade: Staying Sane in Gold’s MadnessToday, Gold hit $3500.
And while that may not sound like a shock on its own, what is unprecedented is the fact that in the past 10 days, Gold has climbed 5,000 pips.
That's not a normal rally.
That’s a vertical explosion.
And yes — it is looking “overextended”, but so it dit at 3300...
But then it went up another 2000 pips.
Will it drop? Probably — and hard.
When? No one knows.
Will it rise another 2000 pips before that?
Again, no one knows.
This is where most traders lose themselves — not because they don’t have tools, but because they pretend to know what’s unknowable.
________________________________________
🎯 The Strongest Skill: Admit When You Don’t Know
Every trader wants clarity.
But real professionals know when they’ve entered the fog.
The market is not obligated to give you structure just because you want to trade.
And the worst trades often happen when:
• You think it's overbought (but it keeps going)
• You think it’s due for a correction (but it doesn't care)
• You think it can't go higher (but it does)
This isn’t analysis — it’s wishful thinking.
________________________________________
🧠 Do You Actually Have Edge? Ask Yourself:
1. Do I see a structured setup, or just a reaction to “how far it’s gone”?
2. Can I define my entry, stop, and exit in advance?
3. Am I trading because I have a plan — or because it feels like a top (or simply have nothing better to do)?
If you can’t answer these — you don’t have edge.
You’re just guessing with conviction.
________________________________________
✅ The Only Thing That Matters: A Valid Trade
If you’re going to trade this madness, make sure your trade is:
• Planned (with defined risk)
• Repeatable (not emotional)
• Based on structure or volatility patterns
Otherwise, it’s just ego vs. market.
And the market always wins that fight.
________________________________________
🧘♂️ Final Thought: When Things Get Wild, Stay Sane
There’s no shame in stepping aside when things make no sense.
In fact, that’s where the real skill begins.
“Knowing when you don’t know isn’t weakness — it’s your strongest edge.”
So take a breath.
Zoom out.
And wait for the moment when you actually know what you're doing — not just think you do.
________________________________________
And remember:
No setup, no trade. No clarity, no risk. No ego, no drama.
Disclosure: I am part of Trade Nation's Influencer program and receive a monthly fee for using their TradingView charts in my analyses and educational articles.
