About the Volume OBV indicator...
Hello, traders.
If you "Follow", you can always get new information quickly.
Please click "Boost" as well.
Have a nice day today.
-------------------------------------
I think TradingView is attractive because users can create charts as they want.
However, since the number of indicators that can be added to the chart is limited depending on the plan, you have to add indicators that fit your plan.
As a result, I ended up integrating multiple indicators into one indicator.
-
The HA-MS indicator in this chart is a public indicator.
If you search the Internet, you can find detailed explanations on how to interpret the OBV indicator.
I expressed it as follows to make this interpretation method more realistic.
The body color of the candlestick is indicated by the 4-stage OBV indicator.
The OBV indicator is distinguished in the same way as the Price Channel indicator.
You can interpret it like the Bollinger Band.
That is, if the middle line that divides 2 and 3 rises by more than 3, you can interpret that the buying force is increasing.
1: It means below the lower line of the Price Channel and is indicated in dark red.
If you enter this section, there is a high possibility of a sharp decline.
You should check the support and resistance points because it is likely to stop falling soon and rise to 2.
2: It means between the lower line and the middle line of the Price Channel and is indicated in red.
This section is likely to show a weak downward sideways movement.
Therefore, if it rises from 1->2, there is a possibility of a short rise. However, if it fails to rise to 3, it is likely to fall back to 1, so it is recommended to make short trades.
3: It means between the middle line and the upper line of the Price Channel and is displayed in green.
This section is likely to show a weak upward sideways movement.
If it rises from 2 -> 3 and shows a sideways movement, you should focus on finding a buying point.
4: It means above the upper line of the Price Channel and is displayed in dark green.
If it enters this section, there is a high possibility of a sharp rise.
Since it is likely to stop rising soon and fall to 3, you should check the support and resistance points.
-
What we should pay attention to is when it changes from 1 -> 2, 4 -> 3.
As explained above, 1 is a section located below the lower line of the Price Channel, so there is a high possibility of a sharp fall.
4 is a section located above the upper line of the Price Channel, so there is a high possibility of a sharp rise.
Therefore, you can proceed with an aggressive buy when it changes from 1 -> 2, and you can proceed with a sell when it changes from 4 -> 3.
In the case of futures, it can be used as reference information for entering and liquidating LONG and SHORT positions.
-
They say that the only things you need on a chart are price and trading volume.
However, it is not easy to interpret this in reality.
To compensate for this, we hid the colors of the existing candles and displayed them in 4 stages of OBV so that you can intuitively see which stage the current price is at.
-
Thank you for reading to the end.
I hope you have a successful transaction.
--------------------------------------------------
Beyond Technical Analysis

AMP Futures - Instant order placementIn this idea we will go over how the instant order placement feature works in Tradingview.

Hidden Forces: Decoding Buyer & Seller Activity on ChartsTotal Volume vs. Volume Delta: The total volume on the chart includes both buys and sells, making it less useful for analysis. Volume Delta, however, shows whether buyers or sellers dominated within a candle.
A green Delta candle means more aggressive retail buying; a red one means more retail selling. This helps analyze market sentiment beyond price movement.
Price & Delta Relationships:
1. Price and Delta move together → Organic movement, likely driven by retail.
2. Delta moves, but price doesn’t → Retail is heavily biased in one direction, absorbing limit orders. Possible smart money trap.
3. Price moves, but Delta doesn’t → Retail didn’t participate in the move. Lack of belief or failed market-making attempt.
4. Price moves against Delta → Strong indication of market manipulation. Large players using aggressive strategies against retail.
Market Manipulation & Smart Money:
* Whales leverage retail psychology and order flow to position themselves.
* Retail often gets caught in fake moves, unknowingly providing liquidity to big players.
Final Thought: By analyzing Delta and price movement together, we can spot hidden large buyers and sellers and understand market dynamics beyond surface-level price action.

How to Actually Do Backtesting?Welcome back guys, I’m Skeptic!
Today, I’m gonna break down one of the most important and fundamental skills every trader needs: Backtesting .
Backtesting is the very first step on your trading journey and probably the most crucial one. It’s all about putting your theoretical knowledge and trading plan to the test by evaluating them against historical market data. The goal? To see whether your strategy actually works — with what win rate, R/R ratio , and more.
But here’s the problem: many traders do it wrong. They end up getting unreliable results, which leads to self-doubt when it comes to forward testing. The real issue is not your strategy but how you conduct your backtest.
Let’s dive into the complete process! 💪
🛠️ Tools You Need
To start backtesting, you’ll need some software that supports the replay feature, allowing you to move through historical data as if it were live.
The best platforms for this are TradingView and MetaTrader . Personally, I use TradingView because it’s super intuitive and has great backtesting capabilities.
Also, make sure to choose appropriate timeframes for backtesting that align with your strategy.
🕰️ Choosing Market Conditions:
You need to backtest your strategy in all types of market conditions:
Uptrend
Downtrend
Range-bound
High Volatility
🚀 Step-by-Step Backtesting
1.Choose the Timeframe:
Make sure your backtesting timeframe matches your strategy’s timeframe. For example, if your strategy works on the 4H chart, don’t backtest on the 1H chart.
2.Select Your Strategy:
Stick to your written trading plan without improvising.
3.Pick the Asset Pair:
Test on at least three different pairs or assets (e.g., EUR/USD, XAU/USD, GBP/NZD) to get diverse results.
4.Define Entry and Exit Rules:
Clearly specify your entry, stop loss, and target levels. Never change these rules mid-backtest, even if it seems illogical. In real trading, you won’t have the luxury of endless contemplation.
🎯 Running the Backtest
Use the Replay Tool to move through historical data.
Never peek at the future price movement. If you accidentally see it, restart from a different point.
Open a minimum of 30 positions for each market condition (e.g., uptrend, downtrend, range).
Record each trade in a spreadsheet (Excel, Google Sheets, etc.) with the following columns:
Date
Time
Entry strategy
Stop loss
Target
Result (profit/loss as R/R ratio)
Exit time
📊 Analyzing Your Results
After completing your backtest, it’s time to analyze the data. Key metrics to focus on include:
R/R Ratio
Win Rate (%)
Drawdown (%)
Losing Streaks
Position Frequency
🚩 Common Mistakes to Avoid
Inconsistent Strategy: Changing your rules during backtesting is a no-go. Stick to the plan.
Incomplete Testing: Don’t cut corners and always aim for a substantial number of trades.
Ignoring Market Conditions: Make sure your strategy is tested in all four market scenarios.
Lack of Patience: Just because the first few trades are losses doesn’t mean the strategy is a failure. Sometimes, a losing streak can be followed by a winning trade that covers it all.
💡 Conclusion
Backtesting is the beating heart of any trader’s skill set. It builds confidence and lays the foundation for a profitable strategy. If you found this tutorial helpful, give it a boost and share it with your fellow traders. Let’s grow together, not alone!
And as Freddie Mercury once said:
We are the champions, my friends! :)🏆
Happy trading, and see you in the next analysis! 💪🔥

Revenge Trading vs. Roaring Comeback: How to Tell the Difference“I’m going to get even with the market and I’m going to get even today!” We’ve all been there. You take a loss—maybe a small one, maybe an account-crushing one—and something inside you snaps.
Logic leaves the chat, and a new trader takes over: the vengeful, angry version of you who’s out to "get back" at the market.
Welcome to the world of revenge trading, where decisions are fueled by frustration, and the market does what it always does: punishes impatient and emotional traders.
But what if there’s a better way? What if instead of spiraling into self-destruction, you could channel that energy into a thoughtful and strategic comeback? That’s the difference between revenge trading and a true trader’s rebound. Grab your hot coffee and let’s talk about it.
💥 Revenge Trading: The Fastest Way to Financial Self-Sabotage
Revenge trading isn’t a trading strategy—it’s an emotional response masquerading as a quick-witted reaction. The thought process goes like this: "I just lost money. I need to make it back—fast."
So you double down, size up, stretch out the leverage ratio and ignore your usual risk management rules. Maybe you trade assets you don’t even understand because the price looks juicy. Maybe you jump into a leveraged position without a stop loss because, hey, you’re in it to win it. What could go wrong?
Everything. Everything can go wrong.
Revenge trading is the financial equivalent of trying to punch the ocean. The market doesn’t care that you’re mad. It doesn’t owe you a winning trade. And when you start making impulsive decisions, the only thing that may get hurt is your trading mindset.
📢 Signs You’re Revenge Trading
You’re taking trades you wouldn’t normally take.
You’re increasing position sizes irrationally.
You’re ditching risk management (stop losses, position sizing, logic, etc.).
You feel desperate to "make it back"—right now.
You’re ignoring your trading plan, assuming you had one to begin with.
Recognizing these signs is the first step to stopping the cycle. But avoiding revenge trading is only half of the battle—you need to know how to stage a real comeback.
🦁 Staging the Roaring Comeback
A roaring comeback isn’t about making back your losses in one dramatic trade. It’s about recalibrating, reassessing, and regaining control. Here’s how traders who actually recover from losses do it:
📌 Recognize the Signs Early
If your heart rate spikes and your fingers are itching to “fix” a bad trade immediately, stop. That’s not a setup. That’s an emotional reaction.
📌 Set Daily Loss Limits
If you hit your max loss for the day, you’re done. No exceptions. Your best decision at that point is to fight another day with a clear head.
📌 Step Away from the Screens
Revenge trading thrives on impulsivity, and the best way to kill that impulse is to take a break. Go outside. Breathe. The market isn’t going anywhere. Now touch that grass.
📌 Post-Loss Review: What Actually Happened?
Was the loss due to a bad strategy, poor execution, or just market randomness? Pull up your trading journal ( you do keep one, right ?) and break it down.
📌 Reaffirm Your Strategy (Tweak if Necessary)
If your loss came from a solid trade setup that just didn’t work, then there’s nothing to change. If it came from a mistake, figure out how to prevent that mistake from repeating.
📌 Reduce Risk for the Next Trades
After a loss, the worst thing you can do is over-leverage. Instead, cut your position size and take smaller, high-probability trades to rebuild confidence. Howard Marks, a firm believer in market psychology, always reminds investors that the biggest risk is emotional overreaction. Stay disciplined.
📌 Trust the Process
The best traders understand that one trade does not define them. They trust their system, stick to their edge, and take losses as part of the game. Trading is a long-term play, not a single battle to be won or lost.
💚 Turning Losses into Lessons
Losses are tuition fees for the market’s greatest lessons. Every great trader has taken hits—what separates them from the rest is how they respond. The thing is this can happen anywhere—from an ill-fated trade in the crypto market (it’s wild out there) to an account-battering reaction to anything that pops out of the earnings calendar .
How do you deal with a trading loss? And when’s the last time you had to stiffen that upper lip and make your comeback? Share your experience in the comments!

Trading Miscalibration: Crypto Aims Too High, FX Aims Too LowI was thinking about something fascinating—the way traders approach different markets and, in my opinion...
One of the biggest mistakes traders make is failing to calibrate their expectations based on the market they’re trading.
📌 In crypto, traders dream of 100x gains, refusing to take profits on a 30-50% move because they believe their coin is going to the moon.
📌 In Forex and gold, the same traders shrink their expectations, chasing 20-30 pip moves instead of riding 200-500 pip trends.
Ironically, both approaches lead to frustration:
🔴 Crypto traders regret not taking profits when the market crashes.
🔴 FX and gold traders regret not holding longer when the market runs without them.
If you want to be a profitable trader, you must align your strategy with the reality of the market you’re trading.
________________________________________
Crypto: Stop Aiming for the Moon—Trade Realistic Outcomes
Crypto markets are highly volatile, and while 10x or 100x gains can happen, they are rare and unpredictable. However, many traders have been conditioned to expect extreme returns, leading them to ignore solid 30-50% gains—which are already fantastic trades in any market.
🔴 The Problem: Holding Too Long & Missing Profits
Many traders refuse to take profits on a 30-50% move, convinced that a 10x ride is around the corner. But when the market reverses, those unrealized gains disappear—sometimes turning into losses.
🚨 Frustration:
"I was up 50%, but I got greedy, and now I’m back to break-even—or worse!"
✅ The Fix: Take Profits at 30-50% Instead of Waiting for 10x
✔️ Take partial profits at key resistance levels.
✔️ Use a trailing stop to lock in gains while allowing for further upside.
✔️ Understand that even professional traders take profits when they’re available—they don’t blindly hold for the next 100x.
📉 Example:
If Bitcoin jumps 30% in a month, that’s already a massive move! Instead of waiting for 200%, a disciplined trader locks in profits along the way. Similarly, if an altcoin is up 50% in two weeks, securing profits makes sense—instead of watching it all disappear in a market dump.
________________________________________
FX and Gold: Stop Thinking Small—Aim for Big Market Trends
On the other hand, when it comes to Forex and gold, many traders shrink their expectations too much. Instead of capturing multi-hundred-pip moves, they settle for 20-30 pip scalps, constantly entering and exiting the market, exposing themselves to unnecessary whipsaws.
🔴 The Problem: Exiting Too Early & Missing Big Trends
Unlike crypto, where traders hold too long, in FX and gold, they don’t hold long enough. Instead of riding a 200-500 pip move, they panic-exit for a small profit, only to watch the market continue without them.
🚨 Frustration:
"I closed at 30 pips, but the market kept running for 300 pips! I left so much money on the table!"
✅ The Fix: Target 200-500 Pip Moves Instead of Scalping
✔️ Focus on higher timeframes (4H, daily) for clearer trends.
✔️ Set realistic yet ambitious targets —200-300 pips in Forex, 300-500 pips in gold.
✔️ Use a strong risk-reward ratio (1:2, 1:3, even 1:5) instead of taking premature profits.
📉 Example:
• If EUR/USD starts a strong downtrend, why settle for 30 pips when the pair could drop 250 pips in a week?
• If gold breaks a major resistance level, a move of 300-500 pips is entirely possible—but you won’t catch it if you exit at 50 pips.
________________________________________
Why Traders Fail to Calibrate Properly
So why do traders fall into this misalignment of expectations?
1️⃣ Social Media & Hype Culture – Crypto traders are bombarded with "to the moon" narratives, making them feel like 30-50% gains are not enough. Meanwhile, in Forex, traders get stuck in a scalping mindset, thinking that small, frequent wins are the only way to trade.
2️⃣ Fear of Missing Out (FOMO) vs. Fear of Losing Profits (FOLP)
• In crypto, FOMO keeps traders holding too long. They don’t want to miss "the big one," so they refuse to take profits.
• In FX and gold, fear of losing small profits makes traders exit too soon. They don’t let trades develop because they fear a pullback.
3️⃣ Misunderstanding Market Structure – Each market moves differently. Crypto is highly volatile but doesn’t always go 10x. Forex and gold move slower but offer consistent multi-hundred-pip trends. Many traders don’t adjust their strategies accordingly.
________________________________________
The Solution: Align Your Strategy with the Market
🔥 In crypto, don’t wait for 10x— start taking profits at 30-50%.
🔥 In FX and gold, don’t settle for 30 pips—hold for 200-500 pip moves.
By making this simple mental shift, you’ll:
✅ Trade smarter, not harder
✅ Increase profitability by targeting realistic moves
✅ Reduce stress and overtrading
________________________________________
Final Thoughts: No More Frustration!
The calibration problem leads to frustration in both cases:
⚠️ Crypto traders regret not taking profits when the market crashes.
⚠️ FX and gold traders regret not holding longer when the market trends.
💡 The solution? Trade according to the market's behavior, not emotions.

Stop chasing 20-30 pips if you want to become profitableOne of the biggest obstacles for traders who want to become consistently profitable is the mindset of chasing small 20-30 pip moves.
While it may seem appealing to enter and exit trades quickly for immediate profits, this strategy is often inefficient, risky, and unsustainable in the long run. Here’s why you should change your approach if you want to succeed in trading.
________________________________________
1. Trading Costs Eat Into Your Profits
When you target small moves, you need to open and close many trades. This means that spreads and commissions will eat up a significant portion of your profits. If you have a spread of 2-3 pips (depending on the pair) and you’re only aiming for 20-30 pips per trade, a consistent percentage of your potential gains is lost to execution costs.
________________________________________
2. High Risk Compared to Reward
A smart trader focuses on a favorable risk-reward ratio, such as 1:2, 1:3 or even 1:4. When you chase just 20-30 pips, your stop-loss has to be very tight, making you highly vulnerable to the normal volatility of the market. An unexpected news release or a liquidity spike can stop you out before the price even reaches your target.
________________________________________
3. You Miss Big Moves and Real Opportunities
Professional traders focus on larger trends and significant price movements of hundreds of pips. The market doesn’t move in a straight line; it goes through consolidations, pullbacks, and major trends. If you’re busy trading short-term 20-30 pip moves, you’ll likely miss the big trends that offer more sustainable profits and better risk management.
________________________________________
4. Increased Stress and Emotional Trading
Short-term trading requires constant monitoring and quick decision-making. This increases your level of stress and negative emotions like fear and greed, leading to costly mistakes. In the long run, this trading style is mentally exhausting and difficult to sustain.
________________________________________
How to Change Your Approach to Become Profitable
✅ Think in terms of larger trends – Focus on 200-300+ pip moves instead of small fluctuations.
✅ Aim for a strong risk-reward ratio – Look for setups with at least 1:2 risk-reward to maximize your profits.
✅ Use higher timeframes – Charts like 4H or daily provide clearer signals and reduce market noise.
✅ Be patient and wait for the best setups – Don’t enter trades just for the sake of activity; wait for high-probability opportunities.

Geopolitical Analysis and Impacts on Currency Markets
Hello, my name is Andrea Russo and today I want to talk to you about how recent geopolitical news is impacting the Forex market, analyzing the main currency pairs and providing a detailed technical picture.
Current Geopolitical Context
This week, the geopolitical landscape has been characterized by a series of significant events. Among them, tensions between the United States and Russia have dominated the scene, with a phone call between Donald Trump and Vladimir Putin that has opened up the possibility of a negotiation in Ukraine. However, the situation on the ground remains critical, with Russian forces advancing in several Ukrainian regions2. Furthermore, uncertainty over gas supplies in Europe has led to significant volatility in energy markets, with the price of gas falling by 3%.
Impacts on the Forex Market
Geopolitical tensions have had a direct impact on the Forex market, influencing volatility and capital flows. For example:
EUR/USD: The pair has been showing a bearish trend, influenced by economic uncertainty in Europe and the strength of the dollar as a safe haven.
USD/JPY: The dollar has gained ground against the yen, thanks to the perception of economic stability in the United States.
GBP/USD: The British pound has been under pressure due to concerns about economic growth in the United Kingdom.
Technical Analysis
A technical analysis of the major currency pairs reveals the following trends:
EUR/USD: Technical indicators suggest a "sell" position, with key support at 1.0832 and resistance at 1.0862.
USD/JPY: The pair is showing "buy" signals, with an uptrend supported by resistance at 148.09.
GBP/USD: Indicators are mixed, with resistance at 1.2944 and support at 1.2920.
Conclusion
Geopolitical dynamics continue to play a crucial role in determining the movements of the Forex market. Investors should carefully monitor global developments and use technical tools to make informed decisions. The current volatility offers opportunities, but also requires careful risk management.
I hope this analysis has been useful to you in better understanding the connections between geopolitics and Forex. Stay tuned for more updates!

Crypto: From "HODL Paradise" to a Speculator’s PlaygroundDuring past bull markets, a simple HODL strategy worked wonders.
Bitcoin and Ethereum set the market trend, and altcoins followed with explosive gains. If you bought the right project before the hype wave, the profits were massive.
However, today’s market is vastly different:
✅ Liquidity is unevenly distributed – Only a handful of major projects attract serious capital, while many altcoins stagnate.
✅ Investors are more sophisticated – Institutional players and smart money dominate, making retail-driven pumps less frequent.
✅ Not all coins pump together – Only projects with real utility and solid tokenomics see sustainable growth.
________________________________________
2. What Matters Now? Strategies for the New Crypto Era
To succeed in the current market, you need a more calculated approach. Here’s what you should focus on:
🔹 Technical Analysis
You can’t just buy blindly and hope for a moonshot. Understanding support and resistance levels, price patterns, trading volumes, etc. is crucial.
Example: If an altcoin has surged 50% in a few days and reaches a strong resistance level, it’s not a buying opportunity—it’s a sell signal for short-term traders.
🔹 Tokenomics and Supply Mechanics
In 2017 and 2021, as long as a project had a compelling whitepaper, it could attract investors. Now, you need to analyze total token supply, distribution models, utility, and vesting schedules.
Example: If a project has an aggressive vesting schedule where early investors and the team receive new tokens monthly, there will be constant selling pressure. No matter how good the technology is, you don’t want to be caught in a dumping cycle.
🔹 Market Psychology and Speculative Cycles
Crypto is driven by emotions. You need to recognize when the crowd is euphoric (time to sell) and when fear dominates (time to buy).
Example: If a project is all over Twitter, Telegram, and TikTok, it might already be near the top. On the other hand, when a solid project is ignored and trading volume is low, it could be a prime accumulation opportunity.
________________________________________
3. Realistic Expectations: 30-50-100% Are the New "100x"
If catching a 10x or 100x was common in the past, those days are largely over. Instead, 30-50-100% gains are far more realistic and sustainable.
Why?
• The market is more mature, and liquidity doesn’t flood into random projects.
• Most "100x" gains were pump & dump schemes, which are now avoided by smart investors.
• Experienced traders take profits earlier, limiting parabolic price action.
Recommended strategy:
1. Enter early in a solid project with clear utility and strong tokenomics.
2. Set realistic profit targets (e.g., take 30% profit at +50%, another 30% at +100%, and hold the rest long-term).
3. Don’t wait for a “super cycle” to make money—take profits consistently.
________________________________________
4. Conclusion: Adapt or Get Left Behind
The crypto market has evolved from a “HODL Paradise” where almost any coin could 10-100x into a speculator’s playground, favoring skilled traders and informed investors.
To stay profitable, you must:
✅ Master technical analysis and identify accumulation vs. distribution zones.
✅ Pick projects with solid tokenomics and avoid those with aggressive unlock schedules.
✅ Set realistic expectations—forget about 100x and aim for sustainable 30-100% gains.
✅ Stay flexible and adapt to market psychology and emerging trends.
Crypto is no longer a game of luck. It’s a game of knowledge and strategy. If you don’t adapt, you’ll be stuck waiting for a 100x that may never come.
So, at least this is my opinion. But what about you? Do you think crypto is still a "HODL paradise," or are we fully in the era of skilled traders and speculators?
Will we ever see another cycle where almost everything pumps together, or is selective investing the new reality?
I’d love to hear your thoughts—drop a comment below and let’s discuss

Institute of Intermediation and 24 Coffee LoversWhen the market is efficient, the most efficient strategy will yield zero financial return for the investor. Therefore, firstly, it is necessary to strive to find inefficiencies in the market itself to apply a strategy that will be effective for it.
What creates market inefficiency? First, there are delays in disseminating important information about the company, such as the approval of a contract with a major customer or an accident at a plant. If current and potential investors do not receive this information immediately, the market becomes inefficient at the time such an event occurs. In other words, objective reality is not considered by market participants. This makes the stock price obsolete.
Secondly, the market becomes inefficient during periods of high volatility. I would describe it this way: when uncertainty hits everyone, emotions become the main force influencing prices. At such times, the market value of a company can change significantly within a single day. Investors have too many different assessments of what is happening to find the necessary balance. Volatility can be triggered by the bankruptcy of a systemically important company (for example, as happened with Lehman Brothers), the outbreak of military action, or a natural disaster.
Third, there is the massive action of large players in a limited market - a "bull in a china shop" situation. A great example is the story of 2021, when the Reddit community drove up the price of GameStop shares, forcing hedge funds to cover their short positions at sky-high prices.
Fourthly, these are ineffective strategies of the market participants themselves. On August 1, 2012, American stock market trading company Knight Capital caused abnormal volatility in more than 100 stocks by sending millions of orders to the exchange over a 45-minute period. For example, Wizzard Software Corporation shares rose from $3.50 to $14.76. This behavior was caused by a bug in the code that Knight Capital used for algorithmic trading.
The combination of these and other factors creates inefficiencies that are exploited by trained traders or investors to make a profit. However, there are market participants who receive their income in any market. They are above the fray and are engaged in supporting and developing the infrastructure itself.
In mathematics, there is a concept called a “zero-sum game”. This is any game where the sum of the possible gains is equal to the sum of the losses. For example, the derivatives market is a perfect embodiment of a zero-sum game. If someone makes a profit on a futures contract, he always has a partner with a similar loss. However, if you dive deeper, you will realize that this is a negative-sum game, since in addition to profit and loss, there are commissions that you pay to the infrastructure: brokers, exchanges, regulators, etc.
To understand the value of these market participants and that you are paying them well, imagine a modern world without them. There is only a company issuing shares and investors in them.
Such a company has its own software, and you connect to it via the Internet to buy or sell shares. The company offers you a quote for buying and selling shares ( bid-ask spread ). The asking price ( ask ) will be influenced by the company's desire to offer a price that will help it not lose control over the company, consider all expected income, dividends, etc. The purchase price ( bid ) will be influenced by the company's desire to preserve the cash received in the capital market, as well as to earn money on its own shares by offering a lower price. In general, in such a situation, you will most likely get a huge difference between the purchase and sale prices - a wide bid-ask spread .
Of course, the company understands that the wider the bid-ask spread , the less interest investors have in participating in such trading. Therefore, it would be advisable to allow investors to participate in the formation of quotes. In other words, a company can open its order book to anyone who wants to participate. Under such conditions, the bid-ask spread will be narrowed by bids from a wide range of investors.
As a result, we will get a situation where each company will have its own order book and its own software to connect to it. From a portfolio investor's perspective, this would be a real nightmare. In such a world, investing in not one, but several companies would require managing multiple applications and accounts for each company at the same time. This will create a demand from investors for one app and one account to manage investments in multiple companies. Such a request will also be supported by the company issuing the shares, as it will allow it to attract investors from other companies. This is where the broker comes in.
Now everything is much better and more convenient. Investors get the opportunity to invest in multiple companies through one account and one application, and companies get investors from each other. However, the stock market will still be segmented, as not all brokers will support cooperation with individual companies, for technical or other reasons. The market will be fragmented among many brokerage companies.
The logical solution would be to create another market participant that would have contracts with each of the companies and universal software for trading their shares. The only thing is that it will be brokers, not investors, who will connect to such a system. You may have already guessed that this is an exchange.
On the one hand, the exchange registers shares of companies, on the other hand, it provides access to trading them through brokers who are its members. Of course, the modern structure of the stock market is more complex: it involves clearing, depository companies, registrars of rights to shares, etc.* The formation of such institutions and their licensing is handled by a regulator, for example, the Securities and Exchange Commission in the United States ( SEC ). As a rule, the regulator is responsible for legislative initiatives in the field of the securities market, licensing of market participants, monitoring violations in the market and supporting its efficiency, protecting investors from unfair manipulation.
*Clearing services are activities to determine, control and fulfill obligations under transactions of financial market participants. Depository services - services for the storage of securities and the recording of rights to them.
Thus, by making a transaction on the exchange, we contribute to the maintenance of this necessary infrastructure. Despite the fashion for decentralization, it is still difficult to imagine how one can ensure speed, convenience and access to a wide range of assets due to the absence of an intermediary institution. The other side of the coin of this institution is infrastructure risk. You can show phenomenal results in the market, but if your broker goes bankrupt, all your efforts will be nullified.
Therefore, before choosing an intermediary, it is useful to conduct a mental survey of the person you will be dealing with. Below you will find different types of intermediaries, which I have arranged according to their distance from the central elements of the infrastructure (exchanges, clearing houses, depositories).
Prime broker
Exchange Membership: mandatory
License: mandatory
Acceptance and accounting of your funds/shares: mandatory
Order execution: mandatory
Clearing and depository services: mandatory
Marginal services: mandatory
Remuneration: commission income from trades, clearing, depository and margin services
This category includes well-known financial houses with history and high capitalization. They are easily verified through lists of exchange members, clearing and depository companies. They provide services not only to individuals, but also to banks, funds and next-level brokers.
Broker
Exchange membership: mandatory
License: mandatory
Acceptance and accounting of your funds/shares: mandatory
Order execution: mandatory
Clearing and depository services: on the prime broker side
Margin services: on the prime broker side or own
Remuneration: commission income from trades and margin services
This category includes intermediaries with a focus on order routing. They delegate participation in depository and clearing services to a prime broker. However, such brokers can also be easily verified in the lists of exchange members.
Sub-broker
Exchange Membership: no
License: mandatory
Acceptance and accounting of your funds/shares: mandatory
Order execution: on the broker or prime broker side
Clearing and depository services: on the prime broker side
Margin services: on the broker or prime broker side
Remuneration: commission income from trades
This category includes brokers who have a brokerage license in their country, but do not have membership in foreign exchanges. To provide trading services on these exchanges, they enter into agreements with brokers or prime brokers from another country. They can be easily verified by license on the website of the regulator of the country of registration.
Introducing Broker
Exchange Membership: no
License: optional, depending on the country of regulation
Acceptance and accounting of your funds / shares: no
Order execution: on the side of the sub-broker, broker or prime broker
Clearing and depository services: on the prime broker side
Margin services: on the broker or prime broker side
Remuneration: commission income for the attracted client and/or a share of the commissions paid by them
This category includes companies that are not members of the exchange. Their activities may not require a license, since they do not accept funds from clients, but only assist in opening an account with one of the top-tier brokers. This is a less transparent level, since such an intermediary cannot be verified through the exchange and regulator’s website (unless licensing is required). Therefore, if an intermediary of this level asks you to transfer some money to his account, most likely you are dealing with a fraudster.
All four categories of participants are typical for the stock market. Its advantage over the over-the-counter market is that you can always check the financial instrument on the exchange website, as well as those who provide services for its trading (membership - on the exchange website, license - on the regulator's website).
Pay attention to the country of origin of the broker's license. You will receive maximum protection in the country where you have citizenship. In case of any claims against the broker, communication with the regulator of another country may be difficult.
As for the over-the-counter market, this segment typically trades shares of small-cap companies (not listed on the exchange), complex derivatives and contracts for difference ( CFD ). This is a market where dealers rule, not brokers and exchanges. Unlike a broker, they sell you their open position, often with a lot of leverage. Therefore, trading with a dealer is a priori a more significant risk.
In conclusion, it should be noted that the institution of intermediation plays a key role in the development of the stock market. It arose as a natural need of its participants for concentration of supply and demand, greater speed and security of financial transactions. To get a feel for this, let me tell you a story.
New Amsterdam, 1640s
A warm wind from the Hudson brought the smell of salt and freshly cut wood. The damp logs of the palisade, dug into the ground along the northern boundary of the settlement, smelled of resin and new hopes. Here, on the edge of civilization, where Dutch colonists were reclaiming their homes and future fortunes from the wild forest, everything was built quickly, but with a view to lasting for centuries.
The wooden wall built around the northern border of the town was not only a defense against raids, but also a symbol. A symbol of the border between order and chaos, between the ambitions of European settlers and the freedom of these lands. Over the years, the fortification evolved into a real fortification: by 1653, Peter Stuyvesant, appointed governor of New Netherland by the West India Company, ordered the wall to be reinforced with a palisade. It was now twelve feet high, and armed sentries stood on guard towers.
But even the strongest walls do not last forever. Half a century after their construction, in 1685, a road was built along the powerful palisade. The street received a simple and logical name - Wall Street. It soon became a bustling commercial artery for the growing city. In 1699, when the English authorities had already established themselves here finally, the wall was dismantled. She disappeared, but Wall Street remained.
A century has passed
Now, at the end of the 18th century, there were no walls or guard towers on this street. Instead, a plane tree grew here - a large, spreading one, the only witness to the times when the Dutch still owned this city. Traders, dealers, and sea captains met under its shadow. Opposite the buttonwood tree stood the Tontine Coffee House, a place where not just respectable people gathered, but those who understood that money makes this world go round.
They exchanged securities right on the pavement, negotiated over a cup of steaming coffee, and discussed deals that could change someone's fate. Decisions were made quickly - a word, backed up by a handshake, was enough. It was a time when honor was worth more than gold.
But the world was changing. The volume of trades grew, and chaos demanded rules.
May 17, 1792
That spring day turned out to be decisive. Under the branches of an old buttonwood tree, 24 New York brokers gathered to start a new order. The paper they signed contained only two points: trades are made only between their own, without auctioneers, and the commission is fixed at 0.25%.
The document was short but historic. It was called the Buttonwood Agreement, after the tree under which it was signed.
Here, amid the smell of fresh coffee and ink, the New York Stock Exchange was born.
Soon, deals were being concluded under the new rules. The first papers to be traded were those of The Bank of New York , whose headquarters were just a few steps away at 1 Wall Street. Thus, under the shade of an old tree, the history of Wall Street began. A story that will one day change the whole world.
Buttonwood Agreement. A fresco by an unknown artist who adorns the walls of the New York Stock Exchange.
Behind the DCA Strategy: What It Is and How It WorksWho invented the Dollar Cost Averaging (DCA) investment strategy?
The concept of Dollar Cost Averaging (DCA) was formalized and popularized by economists and investors throughout the 20th century, particularly with the growth of the U.S. stock market. One of the first to promote this strategy was Benjamin Graham , considered the father of value investing and author of the famous book The Intelligent Investor (published in 1949). Graham highlighted how DCA could help reduce the risk of buying assets at excessively high prices and improve investor discipline.
When and How Did Dollar Cost Averaging Originate?
The concept of DCA began to take shape in the early decades of the 20th century when financial institutions introduced automatic purchase programs for savers. However, it gained popularity among retail investors in the 1950s and 1960s with the rise of mutual funds.
Overview
The core principle of DCA involves investing a fixed amount of money at regular intervals (e.g., every month. This approach allows investors to purchase more units when prices are low and fewer units when prices are high, thereby reducing the impact of market volatility.
Why Was DCA Developed?
The strategy was developed to address key challenges faced by investors, including:
1. Reducing Market Timing Risk
Investing a fixed amount periodically eliminates the need to predict the perfect market entry point, reducing the risk of buying at peaks.
2. Discipline and Financial Planning
DCA helps investors maintain financial discipline, making investments more consistent and predictable.
3. Mitigating Volatility
Spreading trades over a long period reduces the impact of market fluctuations and minimizes the risk of experiencing a significant drop immediately after a large investment.
4. Ease of Implementation
The strategy is simple to apply and does not require constant market monitoring, making it accessible to all types of investors.
Types of DCA
Dollar Cost Averaging (DCA) is an investment strategy that can be implemented in two main ways:
Time-Based DCA → Entries occur at regular intervals regardless of price.
Price-Based DCA → Entries occur only when the price meets specific criteria.
1. Time-Based DCA
How It Works: The investor buys a fixed amount of an asset at regular intervals (e.g., weekly, monthly). Entries occur regardless of market price.
Example: An investor decides to buy $200 worth of Bitcoin every month, without worrying whether the price has gone up or down.
2. Price-Based DCA
How It Works: Purchases occur only when the price drops below a predefined threshold. The investor sets price levels at which purchases will be executed (e.g., every -5%). This approach is more selective and allows for buying at a “discount” compared to the market trend.
Example: An investor decides to buy $200 worth of Bitcoin only when the price drops by at least 5% compared to the last entry.
Challenges and Limitations
1. DCA May Reduce Profits in Bull Markets
If the market is in an bullish trend, a single trade may be more profitable than spreading purchases over time or price dips.
2. Does Not Fully Remove Loss Risk
DCA helps mitigate volatility but does not protect against long-term bearish trends. If an asset continues to decline for an extended period, positions will accumulate at lower values with no guarantee of recovery.
3. May Be Inefficient for Active Investors
If an investor has the skills to identify better entry points (e.g., using technical or macroeconomic analysis), DCA might be less effective. Those who can spot market opportunities may achieve a better average entry price than an automatic DCA approach.
4. Does Not Take Full Advantage of Price Drops
DCA does not allow aggressive buying during market dips since purchases are fixed at regular intervals. If the market temporarily crashes, an investor with available funds could benefit more by buying larger amounts at that moment.
5. Higher Transaction Costs
Frequent small investments can lead to higher trading fees, which may reduce net returns. This is especially relevant in markets with fixed commissions or high spreads.
6. Risk of Overconfidence and False Security
DCA is often seen as a “fail-proof” strategy, but it is not always effective. If an asset has weak fundamentals or belongs to a declining sector, DCA may only slow down losses rather than ensure future gains.
7. Requires Discipline and Patience
DCA is only effective if applied consistently over a long period. Some investors may lose patience and leave the strategy at the wrong time, especially during market crashes.

123 Quick Learn Trading Tips - Tip #6 - Defensive or Aggressive?123 Quick Learn Trading Tips - Tip #6 - Defensive or Aggressive?
To make money in trading, you need to control your emotions.
Traders often fall into two emotional traps:
Overly Aggressive: After several wins , a trader may become too confident. They might increase their position sizes or take on riskier trades. This can lead to significant losses if the market turns.
Overly Defensive: After several losses , a trader may become too fearful. They might hesitate to enter good trades or exit trades too early. This can lead to missed profit opportunities.
Maintaining a balance between these states is key. Learn to recognize and control your emotions. Discipline and a calm mind are essential for successful trading.
In trading, you must simultaneously be
defensive and aggressive.
Balance is Key ⚖️
Navid Jafarian
Every tip is a step towards becoming a more disciplined trader. Look forward to the next one! 🌟

AMP Futures - Profile mode, and ladder type (Volume footprint)In this idea we will demonstrate how to apply the new profile mode and ladder type display to the volume footprint charts using Tradingview.

The Four Fears of Trading and the Law of HarmonyTrading is not just about charts, strategies, and numbers. It’s a psychological battlefield, where fear dominates — but there’s also an often-overlooked factor: harmony. WD Gann’s Law of Harmony teaches that markets, like people, have unique vibrations. When you trade in sync with stocks or currency pairs that ‘resonate’ with you, your confidence and performance improve. Let’s explore how combining Gann’s insights with an understanding of the Four Fears of Trading can create a balanced, more successful trading mindset.
What Is the Law of Harmony?
The Law of Harmony is one of WD Gann’s foundational principles. Gann believed that everything in the universe moves according to natural laws, and markets are no different. Each stock, commodity, or currency pair has its own ‘vibration’ or rhythm — a unique frequency that determines how it behaves. When a trader finds a market whose vibration aligns with their own psychological makeup and trading style, they experience greater clarity, confidence, and success. This is trading in harmony.
Gann used this principle to select markets that matched his analysis style, making it easier to forecast price movements. He believed that recognizing harmony between the trader and the market was just as important as the technical setup itself. He meticulously studied time cycles, price patterns, and astrological influences to find markets that moved in predictable, harmonic ways — and traded only those that felt “right.”
In essence, Gann’s Law of Harmony is about working with the market’s natural flow, not against it. When you’re in sync, trades feel clearer, decisions become easier, and success feels almost effortless.
The Four Fears of Trading
In a recent Twitter poll I conducted, 45% of traders admitted that fear was their toughest emotional challenge — more than greed, hope, or overconfidence. Fear in trading can be broken down into four key categories: the fear of losing money, fear of missing out (FOMO), fear of being wrong, and fear of leaving money on the table. Let’s explore each one — and how the Law of Harmony can help conquer them.
1. Fear of Losing Money
This is the most common fear among traders — nobody wants to lose money. The reality, however, is that losses are an inevitable part of trading. Trading is a game of probabilities, with each trade having around a 50% chance of success.
Many traders react to losses with irrational decisions like closing trades too early or holding onto losing trades in the hope they’ll bounce back. This behavior stems from loss aversion — the natural human tendency to avoid losses more than we seek equivalent gains.
How the Law of Harmony helps:
Trade assets that ‘vibe’ with you. Some stocks or forex pairs will naturally feel clearer and easier to predict — that’s harmony.
Stop forcing bad trades. If you consistently lose on a specific pair, stop forcing it. It might not align with your psychology.
Backtest your system. Develop and backtest a trading system over multiple market conditions (trending, sideways, volatile). When you find one that feels ‘right,’ stick with it.
2. Fear of Missing Out (FOMO)
FOMO drives traders to jump into unplanned trades, often near market tops, for fear they’ll miss a big move. This leads to poor entries, increased risk, and reduced potential rewards. The irony? These impulsive trades often result in losses.
How the Law of Harmony helps:
Shift your mindset from “making money” to “following a process.” Money is a byproduct of trading in harmony with the right instruments.
Accept that the market is endless. Opportunities are like waves — there’s always another one coming. When you trade in sync with a market’s natural rhythm, better setups come to you.
3. Fear of Being Wrong
From childhood, we’re conditioned to avoid mistakes. In trading, however, losses are not failures — they’re feedback. The fear of being wrong can cause traders to hold onto losing trades, cut winners short, or avoid taking trades altogether.
How the Law of Harmony helps:
Focus on pairs or stocks that feel intuitive. When you feel more connected to an asset’s behavior, the fear of being wrong diminishes.
Accept that not every market resonates with you — and that’s okay.
Embrace losing trades as a natural part of the business. Even in harmony, some trades won’t work — that’s part of the rhythm.
4. Fear of Leaving Money on the Table
This fear emerges when a trader exits a trade too soon, only to watch the market continue in their favor. It’s frustrating, but trying to capture every last pip is a recipe for disaster. Markets are unpredictable, and no one catches the exact top or bottom consistently.
How the Law of Harmony helps:
Trust the market’s rhythm. If you’re aligned with the right instrument, more opportunities will come.
Define your exit strategy before entering a trade.
Let go of perfection. Accept that partial profits are better than no profits. In a harmonious market relationship, consistency matters more than squeezing every move.
Final Thoughts: Finding Harmony in Trading
Fear is a natural part of trading — it’s part of being human. The goal isn’t to eliminate fear but to manage it. By identifying which type of fear affects you the most and combining it with Gann’s Law of Harmony, you’ll make more rational decisions and improve your long-term performance.
Imagine you’re at a party. A mutual friend introduces you to a new group of people. You might vibe with some, while others give you an uncomfortable feeling. Stocks and forex pairs work the same way. You naturally gel with some, understanding their behavior and making profitable trades, while others consistently lead to losses.
The secret to long-term trading success is not forcing trades or chasing markets — it’s about finding what resonates with you. Focus on the process, trade in harmony, and the profits will follow.
Remember: The market doesn’t reward those who fight it. It rewards those who flow with it.
Happy trading!

Chart Analysis and Trading Strategy (2)
Hello, traders.
If you "Follow", you can always get new information quickly.
Please also click "Boost".
Have a nice day today.
-------------------------------------
If you look at the candle that the finger is pointing to, you can see that it is a bearish candle with Open > Close.
If you look at this on a 30m chart, you can see that it moves as follows and forms lows and highs.
These candle movements come together to form a candle arrangement, and by looking at this, we ultimately set support and resistance points.
As your understanding of candles deepens, you will study charts in various ways.
The reason is that you may know it when you look at the chart, but you cannot when you trade.
That is, because the understanding of candles is not clear.
As you study the charts over and over again, you will learn that charts tend to converge to the median and average values.
You learn that they converge to the median and average values while studying various indicators, but you end up not knowing what you can learn from them.
What is important in the arrangement of candles is that the arrangement of the Open and Close bodies and the Low and High tails that make up the candles play an important role in setting support and resistance points.
I recommend that you understand this explanation through the Internet or a book.
The reason is that it is something that requires a lot of time investment to acquire.
-
The HA-MS indicator was created to quickly display support and resistance points as objective information.
Therefore, you can see that when the channel composed of the HA-Low indicator and the HA-High indicator is broken, a trend is formed, and if not, a sideways movement is shown.
The HA-Low, HA-High indicators are indicators created by combining the arrangement of candles and the RSI indicator on the Heikin-Ashi chart.
Therefore, the trading strategy is used to create a trading strategy depending on whether there is support near the HA-Low, HA-High indicators.
The other indicators, BW(0), BW(100), DOM(-60), and DOM(60), are used as support and resistance to create a detailed response strategy.
-
Based on this information, trading should be divided into trading in the sideways section and trading in the trend to create a trading strategy.
This trading time is created based on whether there is support in the HA-Low, HA-High indicators.
Since it is made of indicators, I think it provides objective information for chart interpretation with others, reducing the room for controversy.
This is the fundamental reason for using indicators.
It is because we can share objective information with each other.
-
In trading within the sideways section, information about the trend is not particularly necessary.
If you set the sideways section with your own indicator or support and resistance points, you can trade based on whether there is support at the end of that section.
-
However, when you leave the sideways section, information about the trend is necessary.
That is why we use the M-Signal indicator and Trend Cloud indicator on the 1D, 1W, and 1M charts as indicators for the trend.
For short-term information, you can use the M-Signal indicator and Trend Cloud indicator on the 1D chart.
If the Trend Cloud indicator is displayed in green and the price is maintained above the M-Signal indicator on the 1D chart, it can be interpreted that there is a high possibility of a turn to an uptrend.
If not, it can be interpreted that there is a high possibility of a downtrend.
The mid- to long-term trend can be identified by checking the arrangement status of the M-Signal indicator on the 1W chart and the M-Signal indicator on the 1M chart.
That is, if the M-Signal on the 1W chart > the M-Signal on the 1M chart, it can be interpreted that the mid- to long-term trend is maintaining an uptrend.
Therefore, in order to continue the uptrend from a long-term perspective, the price must be maintained above the M-Signal indicator on the 1M chart.
If not, it is recommended to make short trades if possible.
-
To better set the support and resistance points, look at the 1M chart > 1W chart > 1M chart in that order and draw a horizontal line on the indicators (HA-Low, HA-High, BW(0), BW(100), DOM(-60), DOM(60)) displayed on the chart and mark them on the chart.
Mark the support and resistance points on the chart as above.
This marks the support and resistance points with the low and high points.
-
It is not easy to start trading at the low or high points every time.
Therefore, as I mentioned earlier, it is important to create a detailed response strategy based on the median and average values.
For this, the StochRSI 50 indicator is displayed.
In addition, the Close of the Heikin-Ashi chart of the 1D chart, which can be usefully utilized when trading below the 1D chart, is added.
-------------------------------------------------
The information I mentioned above is ultimately information that can be obtained through chart analysis.
You can create a trading strategy by deciding whether to check it directly with your eyes and indicate support and resistance points, or to use an indicator that can be checked more quickly.
Chart analysis is about understanding the movement of the chart, and actual trading is conducted according to the trading strategy.
You may think that chart analysis is the trading strategy, but it is not.
No matter how well you analyze charts with your eyes, if you analyze charts when your psychological state is unstable due to subjective thoughts based on various information other than the chart, as I mentioned earlier, you may end up trading in the wrong direction.
To prevent this, it is necessary to use indicators so that subjective thoughts are not applied.
Even if you start trading at the support and resistance points created by the indicator, and it goes in the opposite direction and you suffer a loss, the influence will be weak.
The reason is that you created a trading strategy with the support and resistance points created by the indicator in advance.
Things to consider when starting a trade in a trading strategy are:
1. When to buy or how to buy
2. When to cut loss or how to cut loss
3. How to realize profit
For this reason, it is important to set support and resistance points through chart analysis.
-
It is better to do chart analysis briefly.
If you spend too much time analyzing charts, you may end up being trapped in your own subjective thoughts, so be careful.
I think you can tell whether you will do chart analysis in an analyst-like manner or in a chart analysis necessary for trading by looking at how the support and resistance points are marked on the chart.
The ideas of chart analysis often do not include things that need to be considered when starting a trade.
Therefore, in order to apply them to actual trading, you need to create a trading strategy through chart analysis.
The chart analysis for trading reduces the need for separate chart analysis because the information necessary for the trading strategy is displayed on the chart.
However, it may need to change depending on your investment style or the time frame chart you are actually trading on, but it can be advantageous for trading because the support and resistance points are marked.
To ensure this, you need to create an indicator and receive support and resistance points as objective information.
-
Thank you for reading to the end.
I hope you have a successful trade.
--------------------------------------------------

Possible vs. Probable in Trading — Most Traders Ignore ThisOne of the biggest mistakes traders make — especially beginners — is confusing what is possible with what is probable.
This confusion leads to poor decisions, unnecessary risks, and eventually, losses that could have been easily avoided.
Possible and Probable Are NOT the Same Thing
Let's make this very clear:
• Possible means it can happen.
• Probable means it is likely to happen, based on evidence and context.
In life, many things are possible — but that doesn’t mean we should live our lives preparing for each possible (and often extreme) event.
To give you a real-life example: it’s possible that something falls from the roof top of a builing and hits you while shopping and die. Sadly, this actually happened in Romania about a month ago.
But as rare and tragic as it is, it’s not probable. And it definitely doesn’t mean that we should stop going outside, right?
Trading Is a Game of Probabilities, Not Possibilities
When trading, we are not betting on what is possible.
If we did, we would enter trades every time we imagine a price could go higher or lower — and that would be a disaster.
Instead, we are betting on what is probable — based on:
• Technical analysis
• Price action
• Market context
• Volume
• Sentiment
⚠️ Yes, it is always possible for price to go in either direction.
But our edge comes from identifying what is more likely to happen based on the data we have.
Why This Difference Is Crucial for Your Trading Success
✅ Focusing on probabilities means:
• You enter only high-probability setups.
• You manage risk properly because you accept that nothing is 100% sure.
• You avoid chasing trades just because "it’s possible" something happens.
❌ Focusing on possibilities leads to:
• Overtrading
• Emotional decisions
• Hoping instead of following a plan
• Blowing up accounts
Conclusion: Trade Like a Professional — Trade Probabilities
Remember:
"Anything is possible, but not everything is probable."
If you want to survive and thrive in the markets, focus on probabilities — not on fantasies of what could happen.
You are not trading "maybe this happens", you are trading "this is likely to happen, and I’m managing my risk if it doesn’t".
Make this shift in mindset, and you’ll already be ahead of most traders out there.

HOW-TO: Optimizing FADS for Traders with Investment MindsetIn this tutorial, we’ll explore how the Fractional Accumulation/Distribution Strategy (FADS) can help traders especially with an investment mindset manage risk and build positions systematically. While FADS doesn’t provide the fundamentals of a company which remain the trader’s responsibility, it offers a robust framework for dividing risk, managing emotions, and scaling into positions strategically.
Importance of Dividing Risk by Period and Fractional Allocation
Periodic Positioning
FADS places entries over time rather than committing the entire position at once. This staggered approach reduces the impact of short-term volatility and minimizes the risk of overexposing the capital.
Fractional Allocation
Fractional allocation ensures that capital is allocated dynamically during building a position. This allows traders to scale into positions as the trade develops while spreading out the risk.
Using a high volatility setting, such as a Weekly with period of 12 , optimizes trend capture by filtering out minor fluctuations.
Increasing Accumulation Factor to 1.5 results in avoiding entries at high price levels, improving overall risk.
Increasing the Accumulation Spread to a higher value, such as 1.5 , expands the distance between buy orders. This leads to fewer trades and a more conservative accumulation strategy. In highly volatile markets, a larger distance between entry positions can significantly improve the average cost of trades and contribute to better capital conservation.
To compensate for the reduced number of trades, increasing the Averaging Power intensifies the position sizing proportionate to price action. This balances the overall risk profile by optimizing the average position cost.
This approach mimics the behavior of successful institutional investors, who rarely enter the market with full exposure in a single move. Instead, they build positions over time to reduce emotional decision-making and enhance long-term consistency.

How to Use MonthlyReturnTableMonthlyReturnTable
Displays ROI, profit, maximum drawdown, and number of trades by month and year.
The results may not be accurate, so use them for reference only.
This script can be added to the bottom of a strategy script for use.
Written in PineScript version 6.
Settings
Mode : Value Type
ROI : Return on Investment(%)
Profit : Profit Amount
MDD : Maximum Drawdown(%)
Trade : Number of Trades
Position : Table Position - Displays the table in 9 locations on the chart, combining top/middle/bottom and left/center/right.
Precision : Value Precision - Specifies decimal precision (not applied to the number of trades).
Text : Font Size - 0 is automatic.
MARGIN : Sets the top, bottom, left, and right margins of the table.
COLOR : Sets the cell and text colors of the table.
Head : Title Cell
Bull : Positive Value Cell
Bear : Negative Value Cell
Zero : Zero Value Cell
How to Apply
Copy the script below and paste it at the bottom of the strategy script.
Cannot be applied to private scripts that are not publicly shared.
Comments can be removed.
import CHULTOO/MonthlyReturnTable/1
// Output mode and table position
string mode = input.string("ROI", title = "Mode", options = , group = "Monthly Return Table settings ──────────────", inline = "0", display = display.none)
string tablePosition = input.string(position.bottom_right, "Position", options = , group = "Monthly Return Table settings ──────────────", inline = "0", display = display.none)
// Precision and font size
int precision = input.int(2, "Precision", minval = 0, group = "Monthly Return Table settings ──────────────", inline = "1", display = display.none)
int textSize = input.int(12, "Text", minval = 0, group = "Monthly Return Table settings ──────────────", inline = "1", display = display.none, tooltip = "Text size 0 = Auto")
// Table margins
int marginTop = input.int(0, "Top", minval = 0, group = "Margin", inline = "2", display = display.none)
int marginBottom = input.int(0, "Bottom", minval = 0, group = "Margin", inline = "2", display = display.none)
int marginLeft = input.int(0, "Left", minval = 0, group = "Margin", inline = "3", display = display.none)
int marginRight = input.int(0, "Right", minval = 0, group = "Margin", inline = "3", display = display.none)
// Table colors (header, profit, loss, principal)
var color colorHead = input.color(#808080, title = "Head", group = "Color", inline = "1", display = display.none)
var color colorBull = input.color(#089981, title = "Bull", group = "Color", inline = "1", display = display.none)
var color colorBear = input.color(#F23645, title = "Bear", group = "Color", inline = "1", display = display.none)
var color colorZero = input.color(#808080, title = "Zero", group = "Color", inline = "1", display = display.none)
MonthlyReturnTable.get_table(mode, tablePosition, precision, textSize, marginTop, marginBottom, marginLeft, marginRight, colorHead, colorBull, colorBear, colorZero)
Application Method
If the variable name mode is already used in the existing strategy, change it to a different name such as dataType.
Removing precision, font size, and color settings - Since precision and font size are in the middle of the function parameters, you must delete them from the middle and explicitly specify the names of the subsequent parameters when calling the function.
import CHULTOO/MonthlyReturnTable/1
// Output mode and table position
string dataType = input.string("ROI", title = "Mode", options = , group = "Monthly Return Table settings ──────────────", inline = "0", display = display.none)
string tablePosition = input.string(position.bottom_right, "Position", options = , group = "Monthly Return Table settings ──────────────", inline = "0", display = display.none)
// Table margins
int marginTop = input.int(0, "Top", minval = 0, group = "Margin", inline = "2", display = display.none)
int marginBottom = input.int(0, "Bottom", minval = 0, group = "Margin", inline = "2", display = display.none)
int marginLeft = input.int(0, "Left", minval = 0, group = "Margin", inline = "3", display = display.none)
int marginRight = input.int(0, "Right", minval = 0, group = "Margin", inline = "3", display = display.none)
MonthlyReturnTable.get_table(dataType, tablePosition, marginTop = marginTop, marginBottom = marginBottom, marginLeft = marginLeft, marginRight = marginRight)

Why DCA Does Not Work For Short-Term TradersIn this video I go through why DCA (Dollar Cost Averaging) does not work for short-term traders and is more suitable for investors. I go through the pitfalls than come through such techniques, as well as explain how trading should really be approached. Which at it's cost should be based on having a positive edge and using the power of compounding to grow your wealth.
I hope this video was insightful, and gives hope to those trying to make it as a trader. Believe me, it's possible.
- R2F Trading

Exploring the Main Components of a Powerful Trading Journal
In one of the previous posts, we discussed the significance of a trading journal. In the today's article, I will share with you the key elements of a trading journal of a professional trader.
And first, a quick reminder that a trading journal is essential for your trading success. No matter on which level you are at the moment, you should always keep track of your results.
Let's go through the list of the things that you should include in your journal.
1 - Trading Instrument
The symbol where the order is executed.
You need that in order to analyze the performance of trading a particular instrument.
2 - Date
The date of the opening of the position. Some traders also include the exact time of the execution.
3 - Risk
Percentage of the account balance at risk.
Even though some traders track the lot of sizes instead, I do believe that the percentage data is more important and may give more insights.
4 - Entry Reason
The set of conditions that were met to open the trade.
In that section, I recommend to note as much data as possible.
It will be applied in future for the identification of the weaknesses of your strategy.
5 - Risk Reward Ratio
The expected returns in relation to potential risks.
6 - Results
Gain or loss in percentage.
And again, some traders track the pip value of the gain, however,
in my view, the percentage points are more relevant for studying the statistics.
Here is the example of the trade on Gold:
Here is how exactly you should journal the following trade:
Instrumet: Gold (XAUUSD)
Date: 03.07.2023
Risk: 1%
Entry Reason: H&S Pattern Formation,
Neckline Breakout & Retest
R/R Ratio: 1.77
Results: +1.77%
Of course, depending on your trading strategy and your personal goals, some other elements can be added. However, the list that I propose is the absolute minimum that you should track.
❤️Please, support my work with like, thank you!❤️
I am part of Trade Nation's Influencer program and receive a monthly fee for using their TradingView charts in my analysis.

Donchian Channel Strategy like The Turtles TradersThe Turtle Traders strategy is a legendary trend-following system developed by Richard Dennis and William Eckhardt in the 1980s to prove that trading could be taught systematically to novices. Dennis, a successful commodities trader, bet Eckhardt that he could train a group of beginners—nicknamed "Turtles"—to trade profitably using strict rules. The experiment worked, with the Turtles reportedly earning over $100 million collectively. Here’s a detailed breakdown of their strategy, focusing on the core components as documented in public sources like Curtis Faith’s Way of the Turtle and other accounts from the era.
Core Philosophy
Trend Following: The Turtles aimed to capture large price trends in any direction (up or down) across diverse markets—commodities, currencies, bonds, and later stocks.
Systematic Rules: Every decision—entry, exit, position size—was predefined. No discretion allowed.
Volatility-Based: Risk and position sizing adjusted to each market’s volatility, not fixed dollar amounts.
Long-Term Focus: They targeted multi-month trends, ignoring short-term noise.
Two Trading Systems
The Turtles used two complementary breakout systems—System 1 (shorter-term) and System 2 (longer-term). They’d trade both simultaneously across a portfolio of markets.
System 1: Shorter-Term Breakout
Entry:
Buy when the price breaks above the 20-day high (highest high of the past 20 days).
Sell short when the price breaks below the 20-day low.
Skip the trade if the prior breakout (within 20 days) was profitable—avoid whipsaws after a winning move.
Initial Stop Loss:
Exit longs if the price drops 2N below entry (N = 20-day Average True Range, a volatility measure).
Exit shorts if the price rises 2N above entry.
Example: Entry at $100, N = $2, stop at $96 for a long.
Trailing Stop:
Exit longs if the price breaks below the 10-day low.
Exit shorts if the price breaks above the 10-day high.
Time Frame: Aimed for trends lasting weeks to a couple of months.
System 2: Longer-Term Breakout
Entry:
Buy when the price breaks above the 55-day high.
Sell short when the price breaks below the 55-day low.
No skip rule—take every breakout, even after a winner.
Initial Stop Loss:
Same as System 1: 2N below entry for longs, 2N above for shorts.
Trailing Stop:
Exit longs if the price breaks below the 20-day low.
Exit shorts if the price breaks above the 20-day high.
Time Frame: Targeted trends lasting several months (e.g., 6-12 months).
Position Sizing
Volatility (N): N, or “noise,” was the 20-day Average True Range (ATR)—the average daily price movement. It normalized risk across markets.
Unit Size:
Risk 1% of account equity per trade, adjusted by N.
Formula: Units = (1% of Account) / (N × Dollar Value per Point).
Example: $1M account, 1% = $10,000. Corn N = 0.5 cents, $50 per point. Units = $10,000 / (0.5 × $50) = 400 contracts.
Scaling In: Add positions as the trend confirms:
Long: Add 1 unit every ½N above entry (e.g., entry $100, N = $2, add at $101, $102, etc.).
Short: Add every ½N below entry.
Max 4 units per breakout, 12 units total per market across systems.
Risk Management
Portfolio Limits:
Max 4 units in a single market (e.g., corn).
Max 10 units in closely correlated markets (e.g., grains).
Max 12 units in one direction (long or short) across all markets.
Stop Loss: The 2N stop capped risk per unit. If N widened after entry, the stop stayed fixed unless manually adjusted (rare).
Drawdown Rule: If account dropped 10%, cut position sizes by 20% until recovery.
Markets Traded
Commodities: Corn, soybeans, wheat, coffee, cocoa, sugar, cotton, crude oil, heating oil, unleaded gas.
Currencies: Swiss franc, Deutschmark, British pound, yen.
Bonds: U.S. Treasury bonds, 90-day T-bills.
Metals: Gold, silver, copper.
Diversification across 20-30 markets ensured uncorrelated trends.

Europe - America War, Impact on Forex
Hello, my name is Andrea Russo and today I want to talk to you about an important issue that is shaking up the international market: the trade war between the European Union and the United States. Recently, the European Union responded to the duties imposed by the United States on steel and aluminum with countermeasures worth 26 billion euros. In response, US President Donald Trump threatened to impose 200% duties on all wines, champagnes and spirits from France and other countries represented by the EU2.
This escalation of trade tensions will certainly have a significant impact on the FOREX market. Let's see together what the consequences could be:
Market Volatility: Trade tensions between two of the world's largest economies will increase the volatility of the FOREX market. Investors will seek safe havens, such as the Swiss Franc (CHF) and the Japanese Yen (JPY), increasing the demand for these currencies.
Euro (EUR) depreciation: The euro could come under downward pressure due to concerns about the economic impact of tariffs on key EU sectors, such as wine. The reduction in exports of wine and other alcoholic products could negatively impact the EU's trade balance.
US dollar (USD) appreciation: The dollar could strengthen further, as investors view the US as a safe haven in times of economic uncertainty. However, the increase in tariffs could also lead to higher inflation in the US, complicating the Federal Reserve's decisions regarding interest rates.
Impact on the currencies of wine exporting countries: The currencies of major European wine exporters, such as the euro (EUR) and the Swedish krona (SEK), could come under downward pressure due to the decrease in exports to the US.
In conclusion, the tariff war between the European Union and the US will have a significant impact on the FOREX market. Investors will need to monitor developments closely and adjust their trading strategies accordingly. Stay tuned for more updates and market analysis!
Happy trading to all!
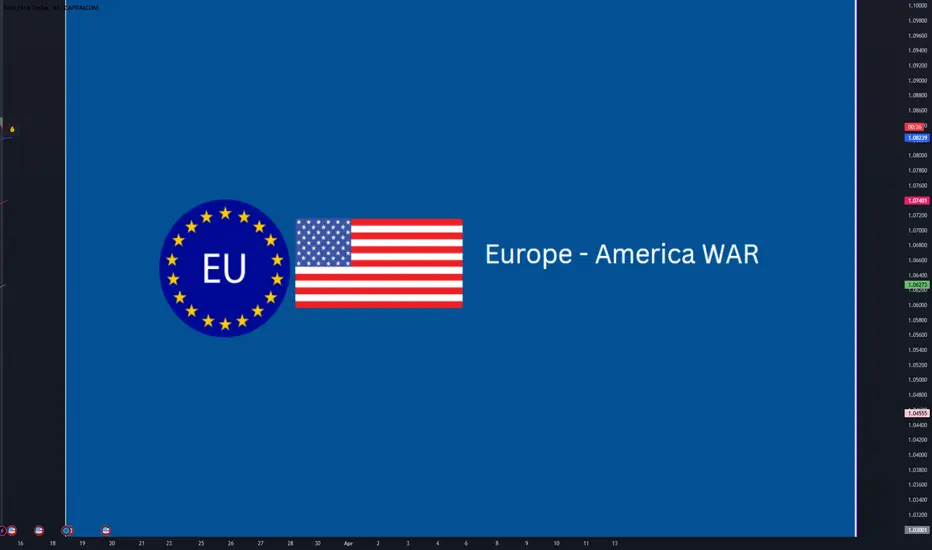
Learn To Invest: Global Liquidity Index & BitcoinGlobal Liquidity Index & BitCoin:
🚀 Positive Vibes for Your Financial Journey! 🚀
BITSTAMP:BTCUSD
Look at this chart! It's the Global Liquidity Index , a measure of how much extra money is flowing through the world's financial systems.
Why is this important? Because when this index is high, it often means good things for investments like #Bitcoin! 📈
Think of it like this: when there's more money flowing, people are often more willing to take risks and invest in things like Bitcoin.
See those "BullRun" boxes? That means things are looking bright! It's showing that money is flowing, and that's often a good sign for potential Bitcoin growth. 🌟
Even if you're not a pro, it's easy to see the good news here. Understanding these trends can help you make smarter decisions.
Let's all aim for growth and success! 💪
