Bitcoin Or Gold? Real Safe Haven In Middle East tension When the world shakes, where does money go— Bitcoin or gold ?
You may think crypto is the ultimate safe haven… but data tells a different story.
This breakdown compares digital dreams vs. physical trust —with charts, tools, and the psychology behind every move.
Hello✌
Spend 3 minutes ⏰ reading this educational material.
🎯 Analytical Insight on Bitcoin:
Contrary to common expectations, Bitcoin has shown relative resilience amid recent geopolitical tensions, refraining from a sharp sell-off.
This price behavior signals a potential shift in market psychology—something I’ll explore further in an upcoming educational post.
Based on my previous analyses, I continue to anticipate an upward breakout above the $110K resistance zone in the current structure.
Now , let's dive into the educational section,
📌 Gold: The Legacy of Trust
For thousands of years, gold has been the go-to safe asset. In wars, inflation, sanctions, and crashes—it remains the mental anchor of value. Tangible, historic, and out of government control.
🪙 Bitcoin: Revolutionary but Unstable
Bitcoin promises freedom, decentralization, and anti-inflation. But during actual crises, trust wavers. High volatility, regulatory risk, and lack of a long history make investors hesitate when fear hits hard.
🛠️ TradingView Tools That Reveal Where Smart Money Flows
One reason TradingView stands out is its wide set of tools that help you track market psychology—not just price action. When it comes to analyzing the Bitcoin-vs-Gold battle during global crises (like the Iran-Israel war), these tools are essential:
Correlation Coefficient: This shows how closely BTC and gold move together. In panic moments, it helps reveal where the real trust is flowing.
On-Balance Volume (OBV): Key for spotting where big money is headed. If OBV on gold rises while BTC’s falls, smart money isn’t betting on crypto just yet.
Fear & Greed Index Logic (DIY): While not a native TradingView tool, you can mimic it by combining volatility and volume indicators to reflect market emotion.
Overlay XAUUSD and BTCUSD: Place both on a single chart with “percentage scale” enabled. You’ll see exactly which one holds up better during chaos.
Marking Geo-Political Events: Tag key events (like missile strikes or sanctions) on your charts. Track how Bitcoin and gold react immediately after.
📊 How Investors React in Crisis
During events like an Iran-Israel war, data shows money often flows into gold—not BTC. When panic peaks, people run toward the “known,” not the “new.”
🧠 The Illusion of Crypto as Safe Haven
We want to believe BTC is the new gold. But the human mind—under threat—defaults to ancient instincts. Fear doesn’t innovate. It runs to what it knows: shiny, physical, historical gold.
💡 When Will Bitcoin Truly Compete?
When the next generation fully embraces digital assets. When institutions store BTC alongside gold. When BTC no longer crashes on scary headlines—that’s when the shift becomes real.
⚠️ Lessons from War
Wars reveal that markets don’t behave rationally in fear. Even if Bitcoin makes sense on paper, emotion drives flows. Right now, that flow still favors gold.
🔍 What to Watch Next
If, during a future conflict, Bitcoin drops less—or even rises while gold does—you may be witnessing a turning point. Until then, keep tracking both with your TradingView setups.
🧭 Final Takeaway
Gold still owns the trust game in a crisis. Bitcoin is on its way but hasn’t crossed that psychological line. If you’re a smart trader, know how to read both—and move before the herd does.
✨ Need a little love!
We put so much love and time into bringing you useful content & your support truly keeps us going. don’t be shy—drop a comment below. We’d love to hear from you! 💛
Big thanks,
Mad Whale 🐋
📜Please remember to do your own research before making any investment decisions. Also, don’t forget to check the disclaimer at the bottom of each post for more details.
Beyond Technical Analysis

The "True Close" Institutions Don't Talk About — But Trade On█ My Story from the Inside
I worked at a hedge fund in Europe, where I served as a Risk Advisor. One thing I never expected before joining the institutional side of the market was this:
They didn’t treat the current day’s close as the "true" close of the market.
Instead, they looked at the first hour of the next day — once all pending flows had settled, rebalancing was done, and execution dust had cleared — that was the true close in their eyes.
Here’s why that changed everything I knew about trading:
█ Institutional Reality vs Retail Fantasy
⚪ Retail traders are taught:
“The daily close is the most important price of the day.” But institutions operate under constraints that most retail traders are never exposed to:
Orders too large to fill before the bell
Internal compliance and execution delays
Batch algorithms and VWAP/TWAP systems that extend into the next session
So while the market might close on paper at 17:30 CET, the real trading — the stuff that matters to funds — might not wrap up until 09:30 or 10:00 the next morning.
Although the official “close” prints here, institutional volume ends quickly. It drops off sharply, almost immediately. Once the books are closed and final prints are done, big players exit — and what's left is thin, passive flow or noise.
The first hour of the New York session reveals structured flows, not random volatility. This is where institutions finalize yesterday’s unfinished business, which is why many consider this the “true” close.
And that’s the price risk managers, portfolio managers, and execution teams internally treat as the reference point.
█ Example: The Rebalance Spillover
Let’s say a fund needs to offload €100 million worth of tech stocks before month-end. They start into the close, but liquidity is thin. Slippage mounts. They pause execution. Next morning, their algo resumes — quietly but aggressively — in the first 30 minutes of trade.
You see a sharp spike. Then a reversal. Then another surge.
That’s not noise. That’s structure. It’s the result of unfinished business from yesterday.
█ Why the First Hour is a War Zone
You’ve probably seen it:
Prices whip back and forth at the open
Yesterday’s key levels are revisited, sometimes violently
Big moves happen without any overnight news
Here’s what’s happening under the hood:
Rebalancing spillovers from the day before
Late-position adjustments from inflows/outflows
Risk parity or vol-targeting models triggering trades based on overnight data
The market’s not reacting to fresh news — it’s completing its old to-do list.
█ What the Research Really Says About Morning Volatility
The idea that "the true close happens the next morning" isn’t just insider intuition — it’s backed by market microstructure research that highlights how institutional behaviors disrupt the clean narrative of the official close.
Here’s what the literature reveals:
█ Heston, Korajczyk & Sadka (2010)
Their study on intraday return patterns shows that returns continue at predictable 30-minute intervals, especially around the open.
The key driver? Institutional order flow imbalances.
When big funds can’t complete trades at the close, they spill into the next session, creating mechanical, non-informational momentum during the first hour. These delayed executions are visible as persistent price drifts after the open, not random volatility.
█ Wei Li & Steven Wang (SSRN 2010)
This paper dives into the asymmetric impact of institutional trades. It shows that when institutions are forced to adjust positions — often due to risk limits, inflows/outflows, or model-based triggers — the market reacts most violently in the early hours of the day.
When funds lag behind the clock, the next morning becomes a catch-up window, and price volatility spikes accordingly.
█ Lars Nordén (Doctoral Thesis, Swedish Stock Exchange)
In his microstructure research, Nordén found that the variance of returns is highest in the early part of the session, not at the close. This is especially true on days following macro events or at the end/start of reporting periods.
The data implies that institutions “price in” what they couldn’t execute the day before, making the next morning more informative than the actual close.
█ Bottom Line from the Research:
The first hour isn’t wild because it’s full of emotion.
It’s wild because it’s full of unfinished business.
These studies reinforce that price discovery is a rolling process, and for institutional flows, the official close is just a checkpoint, not a final destination.
█ How to Use This as a Trader
⚪ Don't assume the official close is final
Treat it as a temporary bookmark. Watch what happens in the first hour of the next day — that’s when intentions are revealed.
⚪ Volume in the first 30–60 minutes matters
It’s not noise — it’s flow completion. Often non-price-sensitive. Often mechanical.
⚪ Design strategies around “true close” logic
Test fade setups after the first hour’s range is established. That’s often the real “settled” level.
⚪ Use the first-hour VWAP or midpoint as a reference
Institutions may anchor to that — not the official close — for mean reversion or risk metrics.
█ Final Thought
The first hour is not the start of something new.
It’s the conclusion of yesterday’s market.
And unless you understand how institutions truly close their books — and how long that takes — you’ll always be a step behind.
So next time you see chaos at the open, stop calling it random.
👉 It’s just the market putting yesterday to bed — late.
-----------------
Disclaimer
The content provided in my scripts, indicators, ideas, algorithms, and systems is for educational and informational purposes only. It does not constitute financial advice, investment recommendations, or a solicitation to buy or sell any financial instruments. I will not accept liability for any loss or damage, including without limitation any loss of profit, which may arise directly or indirectly from the use of or reliance on such information.
All investments involve risk, and the past performance of a security, industry, sector, market, financial product, trading strategy, backtest, or individual's trading does not guarantee future results or returns. Investors are fully responsible for any investment decisions they make. Such decisions should be based solely on an evaluation of their financial circumstances, investment objectives, risk tolerance, and liquidity needs.

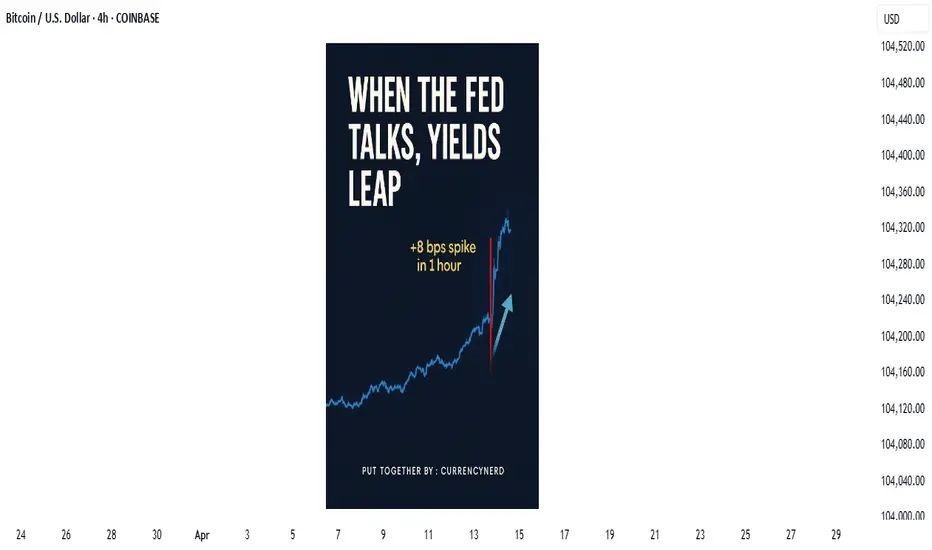
when Jerome says spike, the markets asks how low/high"Watch what they do, but also how they say it."
In the high-stakes world of central banking, few things move markets like the subtle wording of a Fed statement, But beyond the headlines and soundbites, one market absorbs this information faster—and with greater clarity—than almost any other: the bond market.
💬 What Is "Fed Speak"?
"Fed speak" refers to the nuanced and often deliberately vague language used by U.S. Federal Reserve officials when communicating policy expectations. It includes:
FOMC statements
Dot plot projections
Press conferences
Individual speeches from Fed officials
nerdy tip: the Fed aims to influence expectations without committing to specific outcomes, maintaining flexibility while steering market psychology.
📈 The Bond Market as a Decoder
The bond market, particularly the U.S. Treasury market, is where real-time interpretation of Fed policy plays out. Here's how it typically reacts:
1. Short-Term Yields (2Y, 3M) = Fed Expectation Barometer
These are the most sensitive to near-term interest rate expectations. If the Fed sounds hawkish (more rate hikes), short-term yields jump. If dovish (hinting cuts), they fall. At the May 7, 2025 FOMC meeting, the 2-year Treasury yield (US02Y) experienced a modest but clear reaction:
Just before the release, yields were hovering around 3.79%.
In the first hour following the 2:00 PM ET (20:00 UTC+2) statement, the yield ticked up by approximately +8 basis points, temporarily reaching about 3.87%.
Later that day, it eased back to around 3.79%, ending the day roughly unchanged—a sharp, immediate spike followed by a reversion.
2. Long-Term Yields (10Y, 30Y) = Growth + Inflation Expectations
Longer-dated yields reflect how the market sees the economy unfolding over time. After a Fed speech:
Rising long-term yields = stronger growth/inflation expected
Falling yields = fears of recession, disinflation, or policy over-tightening
3. The Yield Curve = Market's Policy Verdict
One of the best tools to read the bond market's verdict is the yield curve—specifically, the spread between 10Y and 2Y yields.
Steepening curve → Market thinks growth is picking up (Fed may be behind the curve)
Flattening or Inversion → Market believes the Fed is too aggressive, risking a slowdown or recession
📉 Example: After Jerome Powell’s hawkish Jackson Hole speech in 2022, the 2Y-10Y spread inverted deeply—markets were pricing in recession risks despite a strong Fed tone.
🧠 Why Traders Must Watch Bonds After Fed Speak
🪙 FX Traders:
Higher yields = stronger USD (carry trade advantage)
Falling yields = weaker USD (lower return for holding)
📈 Equity Traders:
Rising yields = pressure on tech/growth stocks (higher discount rates)
Falling yields = relief rally in risk assets
📊 Macro Traders:
The MOVE Index (bond volatility) often spikes around FOMC events
Forward guidance shifts = big rotation opportunities (e.g., bonds > gold > dollar)
(BONUS NERDY TIP) 🔍 How to Analyze Fed Speak Through Bonds
✅ Step 1: Watch the 2Y Yield
First responder to new rate expectations.
✅ Step 2: Check the Fed Funds Futures
Compare market pricing pre- and post-statement.
✅ Step 3: Look at Yield Curve Movement
Steepening or inversion? That’s the market’s macro take.
✅ Step 4: Track TLT or 10Y Yield on Your Chart
Bond ETFs or Treasury yields reveal sentiment instantly.
🧭 Final Nerdy Thought : Bonds React First, Talk Later
When the Fed speaks, don't just read the words. Read the yields. The bond market is often the first to interpret what the Fed really means—and the first to price in what comes next.
So next FOMC meeting, instead of watching only Powell’s facial expressions or CNBC pundits, open a chart of the 2Y and 10Y. That’s where the smart money’s listening.
put together by : @currencynerd as Pako Phutietsile
courtesy of : @TradingView
Most Traders React to Markets. The Best Anticipate Them.Most Traders React to Markets. The Best Anticipate Them.
Hard truth:
You're always one step behind because you trade reactively.
You can’t win a race if you're always responding to moves already made.
Here's how reactive trading burns your edge:
- You chase breakouts after they've happened, entering at the peak.
- You panic-sell into downturns because you didn't anticipate.
- You miss major moves because you're looking backward, not forward.
🎯 The fix?
Develop anticipatory trading habits. Identify scenarios in advance, set clear triggers, and act decisively when probabilities align - not after the market confirms.
TrendGo provides structure for anticipation - not reaction.
🔍 Stop responding, start anticipating. Your account will thank you.

Re-defining Trading Psychology: A Functional ApproachRethinking Trading Psychology: A Functional Definition
Trading psychology is often misunderstood or overly simplified in trading discourse. Psychology, by definition, is the scientific study of the mind and behavior. When applied to trading, trading psychology should be defined as the study of how our mental processes directly influence market structure through behavior—specifically through the act of placing trades.
The Facts: How Humans Influence the Market
Traders interact with the market in only a few meaningful ways:
Placing entries
Setting stop losses
Setting take-profit (target) levels
Though external variables such as news events can impact decision-making, they only affect where we choose to interact with the market—they do not directly move price. Price only responds to order flow , and all order flow originates from trader decisions. Therefore, these three actions—entries, stops, and targets—are the only real mechanisms through which psychology influences price action.
Entry: The Initiator of Market Movement
Entries are typically based on structural cues like engulfing candles or order blocks —price zones where a shift in momentum is visible. These areas act as high-probability triggers that prompt traders to take action in a particular direction.
When enough buy orders are placed at a bullish signal, we see that reflected in the strength and size of bullish candles. Conversely, strong bearish signals generate concentrated sell-side pressure. This collective order flow initiates price movement—entries are the impulse drivers of the market.
Stop Losses: The Creation of Liquidity Pools
Once a position is opened, traders generally place stop losses behind significant structure—often just beyond the order block or engulfing pattern that prompted the entry. These zones become liquidity pools —clusters of pending orders that, when triggered, cause mass exits and reallocation of capital.
When price returns to these zones, it forces traders out of the market, often resulting in sharp movements or false breakouts. This behavior is not coincidental; it is a byproduct of shared psychological behavior manifesting as clustered risk management.
Take-Profits: Delayed Exit Pressure
Alongside stop losses, traders also define target levels where they plan to close their trades. These levels can be calculated based on fixed R-multiples (2R, 3R, etc.) or drawn from contextual zones like previous highs/lows or supply and demand areas.
As price moves into profit and hits these levels, traders begin to exit en masse. This diminishes order flow in the direction of the trade, often leading to hesitation or minor reversals—much like stop losses do when they are hit.
Conclusion: Market Movement vs. Market Stalling
To summarize:
Entries drive market movement
Stop losses and target levels stall or reverse movement
This dynamic defines how human behavior—guided by psychological patterns—actually shapes price. In this framework, engulfments represent entry logic , while liquidity zones represent collective exit logic .
Redefining Trading Psychology
Contrary to popular belief, trading psychology isn’t just about “staying disciplined” or “keeping emotions in check.” While emotional control matters, it’s secondary to understanding how trader behavior creates cause-and-effect loops in price action.
Having a trading plan is important—but deviating from that plan is not always due to emotion alone. It can stem from overconfidence, impulsivity, cognitive bias, or poor conditioning. These are psychological behaviors that affect execution, and thus, affect market movement.
What’s Next
In my next writing, I will explore how the sheer volume of market participants leads to herding behavior —the collective patterns that emerge from mass psychology and their role in creating consolidation zones, liquidity traps, and false breakouts.

Iran-Israel Political Tension & End of Crypto marketDo geopolitical tensions truly cause markets to crash or pump?
In a world where financial safety is more fragile than ever, how do traders react?
This analysis dives deep into how pro traders think and act during critical moments.
Hello✌
Spend 3 minutes ⏰ reading this educational material.
🎯 Analytical Insight on Bitcoin:
Bitcoin is experiencing a fear-driven shock amid escalating geopolitical tensions, triggering potential downside volatility toward the $98K level 📉. Despite this risk-off sentiment, the broader market structure remains intact, and I maintain a bullish bias. A recovery from key support zones could pave the way for a renewed breakout above $100K in the mid-term .
Now , let's dive into the educational section,
🧠 Fear, Safety or Opportunity? Trading Psychology in Crisis 🧨
Markets don’t move based on headlines—they move based on how the crowd feels about those headlines. Political tension triggers emotional responses, especially panic selling.
However, experienced traders spot opportunities while others flee.
In such moments, two emotional extremes dominate:
🔸 Fear of losing capital (FUD)
🔸 Greed to seize a rare opportunity (FOMO)
Both are dangerous if uncontrolled. Tools like RSI and Fear & Greed Index (via external APIs) can provide rough estimates of market sentiment and potential turning points.
📊 Practical TradingView Tools for Analyzing Crisis-Driven Markets 🔍
When global tension spikes, the markets reflect collective emotion like a mirror. During uncertain times, smart traders rely on tools that turn raw data into sharp insights. TradingView provides several features that become extremely useful in times of high uncertainty:
1. Crypto Volatility Index Proxy (using ATR + Bollinger Bands)
These indicators help detect when the market is driven more by fear than logic. They show increasing volatility levels as tensions rise.
2. Sentiment Indicators – Funding Rate & Long/Short Ratios
These metrics, pulled from major exchanges, show whether traders are overly bullish or bearish. A sudden imbalance usually hints at insider expectations or fast-breaking news.
3. DXY and Gold (XAUUSD) Side-by-Side with BTC
Analyzing Bitcoin’s performance alongside USD and gold gives insight into whether investors are going risk-off or seeking crypto as a hedge.
4. Volume-Based Indicators – OBV & Volume Profile
While headlines can lie, volume doesn’t. These tools highlight areas of serious buying/selling interest and help identify where smart money enters or exits.
5. Multi-Chart Layout Feature
TradingView allows you to analyze multiple assets together—BTC, gold, oil, and stock indices like S&P 500—on one screen. Perfect for understanding macro capital flow during geopolitical events.
💣 Interconnected Markets During Regional Conflict 🌍
Crypto often acts like a risk-on asset during global crises. If traditional markets fall, Bitcoin may follow—unless it’s being viewed as a safe haven.
That’s why watching DXY, gold, and oil charts alongside BTC is crucial.
Understanding these correlations using TradingView’s comparison features gives you a better sense of where capital is flowing during uncertain times.
⏳ What Traders Should Focus on in Crisis Mode 💼
1. Focus on chart confirmations, not news hype.
2. Use multi-dimensional analysis with TradingView.
3. Prioritize risk management more than ever.
4. Cash is a position. Sometimes the best move is no move.
5. Always have a backup scenario—no analysis is guaranteed.
📌 Final advice:
When headlines play with your nerves, data becomes your best ally.
With the right tools and a disciplined mindset, traders can navigate even the stormiest markets with confidence.
The market rewards the calm, not the reckless.
✨ Need a little love!
We put so much love and time into bringing you useful content & your support truly keeps us going. don’t be shy—drop a comment below. We’d love to hear from you! 💛
Big thanks,
Mad Whale 🐋
📜Please remember to do your own research before making any investment decisions. Also, don’t forget to check the disclaimer at the bottom of each post for more details.

Learn 6 Common Beginner Trading Mistakes (FOREX, GOLD)
In the today's post, we will discuss very common beginner's mistakes in trading that you should avoid.
1. No trading plan 📝
That is certainly the TOP 1 mistake. I don't know why it happens but 99% of newbies assume that they don't need a trading plan.
It is more than enough for them to watch a couple of educational videos, read some books about trading and Voilà when a good setup appears they can easily recognize and trade it without a plan.
Guys, I guarantee you that you will blow your trading account in maximum 2 months if you keep thinking like that. Trading plan is the essential part of every trading approach, so build one and follow that strictly.
2. Overtrading 💱
That mistake comes from a common newbies' misconception: they think that in order to make money in trading, they should trade a lot. The more they trade, the higher are the potential gains.
The same reasoning appears when they choose a signal service: the more trades a signal provider shares, the better his signals are supposed to be.
However, the truth is that good trades are very rare and your goal as a trader is to recognize and trade only the best setups. While the majority of the trading opportunities are risky and not profitable.
3. Emotional trading 😤
There are 2 ways to make a trading decision: to make it objectively following the rules of your trading plan or to follow the emotions.
The second option is the main pick of the newbies.
The intuition, fear, desire are their main drivers. And such an approach is of course doomed to a failure.
And we will discuss the emotional trading in details in the next 2 sections.
4. Having no patience ⏳
Patience always pays. That is the trader's anthem.
However, in practice, it is extremely hard to keep holding the trade that refuses to reach the target, that comes closer and closer to a stop loss level, that stuck around the entry level.
Once we are in a trade, we want the price to go directly to our goal without any delay. And the more we wait, the harder it is to keep waiting. The impatience makes traders close their trades preliminary, missing good profits .
5. Greed 🤑
Greed is your main and worst enemy in this game.
It will pursue you no matter how experienced you are.
The desire to get maximum from every move, to not miss any pip of profit, will be your permanent obstacle.
Greed will also pursue you after you close the profitable trades. No matter how much you win, how many good winning trades you catch in a row, you always want more. And that sense main lead you to making irrational, bad trading decision.
6. Big Risks 🛑
Why to calculate lot size for the trade?
Why even bother about risk management?
These are the typical thoughts of the newbies.
Newbie traders completely underestimate the risks involved in trading and for that reason they are risking big.
I heard so many times these stories, when a trading deposit of a trader is wiped out with a one single bad trade.
Never ever risk big, especially if you just started.
Start with a very conservative approach and risk a tiny little portion of your trading account per trade.
Of course there are a lot more mistakes to discuss.
However, the ones that I listed above at the most common
and I am kindly recommending you to fix them before you start trading with a substantial amount of money.
❤️Please, support my work with like, thank you!❤️
I am part of Trade Nation's Influencer program and receive a monthly fee for using their TradingView charts in my analysis.

It Wasn’t on a Chart. It Was in My JournalYou don’t become consistent by learning more setups. You become consistent by learning more about yourself.
✍️ The Day I Started Journaling, I Stopped Guessing
I used to chase charts like they owed me something.One moment I was confident. The next, I was doubting everything, not because the market betrayed me, but because I wasn’t keeping track of who I was becoming .
Then I started journaling.
Not just logging wins and losses, but writing what I felt, what I saw, where I rushed, and why I broke my own rules. It changed everything.
What Journaling Gave Me (That Charts Alone Couldn’t)
1. Clarity Over Chaos
Every trade became a lesson. I stopped reacting and started reviewing.
2. Accountability Over Emotion
Writing “I entered out of fear of missing out” hits different when you see it five times in a row. I couldn’t lie to myself anymore.
3. Discipline Over Drama
No more revenge trades. No more “just one more” trades. Journaling made me pause, and that pause saved me more than any setup ever could
It’s Not Just a Journal. It’s a Mirror.
Most traders document price. Few document themselves. And yet that’s where the edge lives, not in more indicators, but in more self-awareness.
My Advice to Any Trader Trying to Break Through
Don’t just journal for results . Journal to understand who you are in the market. Your wins will mean more, and your losses will teach more. And if you're consistent with it, your growth won’t just be measurable. It’ll be undeniable.
The best setups won’t save you if your mindset is undisciplined.And the best mentors can’t help you if you don’t study your own patterns.
Journaling isn’t just about logging trades.It’s about documenting your evolution as a trader, from reactive to intentional, from hopeful to professional. So, if you’re serious about growth: Don’t just screenshot your wins, start writing your journey. That’s where the edge really begins.

#AN007: Israel Attacks Iran, What's Happening? in Forex
Hello, I'm Forex Trader Andrea Russo, creator of the SwipeUP Elite FX Method, which allows me to analyze and operate in the Forex world as if I were a Hedge Fund or an Investment Bank. Today I want to talk to you about the relevant news of the last few hours, namely Israel's attack on Iran.
⚠️ What happened
Israel launched a massive preemptive air strike on numerous nuclear and military installations in Iran, including sites in Tehran and Natanz. Among the victims were key figures such as Revolutionary Guard commander Hossein Salami and several high-profile nuclear scientists.
The operation was completely "unilateral", with no direct involvement of the United States, according to official sources
reuters.com. However, it was previously coordinated with Washington, which received notification before the attack.
Iran has responded by announcing that it will respond “hard and decisively” and has begun planning missile and drone strikes against Israeli targets, with a response that could come as early as the next few days.
🌍 Global reactions
Australia, New Zealand, Japan and the UN have expressed alarm and called for maximum restraint.
Oil prices have reacted with a surge: WTI +9% due to fears of supply disruptions.
💱 Impact on Forex
↑ Oil prices → Strengthens CAD, NOK, and commodity currencies in general.
Global risk-off mode → Benefits safe haven currencies such as JPY, CHF, and temporarily also USD.
Rising geopolitical risk → USD may have swings: drops in risk-off phases, but bounces as a safe-haven.
EUR under pressure due to general risk aversion and physical demand for USD, CHF, JPY.
Finally, emerging markets (BRL, MXN, INR) could suffer high volatility: outflows towards safer assets.
🧩 Operational focus for Forex traders
Monitor oil and US yield bonds: rising signals could push commodity currencies.
Follow movements on USD/JPY and USD/CHF: potential breakouts in case of escalation.
Watch out for volatility on EUR/USD: the geopolitical crisis rewards USD and CHF.
Stay ready for emerging currencies to react: possible flash crashes or speculative rebounds.
To receive other news or other analyses, continue to follow me.

#AN006 Forex: Dollar, Yen and Emerging Currencies Collapse
Hello, I'm Forex trader Andrea Russo, creator of the SwipeUP Elite FX Method that analyzes the market like a Hedge Fund. Today I want to talk to you about the most important economic news of the last few hours and how these are influencing, in real time, the global currency market.
## 🔜 US inflation: is the Fed heading for a cut?
The CPI data released yesterday surprised the markets: annual core inflation stopped at +2.8% while the general figure stood at +2.4%, below expectations. This inflationary cooling immediately triggered speculation about a possible rate cut by the Federal Reserve as early as September. The Dollar Index (DXY) reacted negatively, losing ground and touching the lowest levels since April.
### Forex Impact:
* The dollar weakens across the board.
* EUR/USD tested the 1.15 area
* GBP, JPY and CHF strengthened in counter-balance.
## 🌐 US-China trade tensions: half-way deals
Over the past 24 hours, President Trump spoke of "partial progress" in talks with China on tariffs and rare metals. However, the lack of a definitive deal keeps global uncertainty high. Investors are weighing the risk of a new escalation, especially in strategic sectors such as technology and raw materials.
### Forex impact:
* AUD and NZD show high volatility.
* JPY benefits as a safe haven currency.
* Commodity currencies remain reactive to geopolitical developments.
## 📉 ECB: rate cut and expansionary forward guidance
The European Central Bank has cut interest rates to 2%, marking the eighth consecutive cut. The governor opened up to further expansionary measures in the third quarter, should inflation fail to rebound towards the 2% target.
### FX Impact:
* The euro remains under pressure, despite the dollar weakness.
* EUR/CHF in congestion.
* EUR/USD in a sideways phase after the initial rally.
## 🚗 Emerging Markets: New Cycle of Strength
According to the World Bank, growth in emerging markets will slow to 3.8% in 2025. However, currencies such as the Brazilian real (BRL) and the Mexican peso (MXN) have gained momentum thanks to the dollar weakness and speculative inflows on carry trades.
### FX Impact:
* BRL and MXN strengthen.
* Long-term opportunities on USD/EM crosses.
* Beware of political risks and local inflation.
## ⛽ Oil rally: domino effect on currencies
Oil prices rose this week: WTI hit +6%, while Brent marked +4%. The rally was triggered by improvements in US-China relations and geopolitical tensions in the Middle East.
### Forex Impact:
* Strengthening CAD and NOK.
* EUR and JPY penalized as net importers.
* Correlation opportunities on USD/CAD.
## 🔄 Forex Outlook: what to expect now
The market has entered a phase of **macro realignment**:
* The dollar is in structural correction.
* The euro is struggling between ECB stimulus and USD weakness.
* Safe haven currencies (JPY, CHF) remain strong.
* Emerging markets and commodity currencies show momentum.
In the short term, the key will be the evolution of US data (PPI, retail sales) and new statements from the Fed.
Keep following me for updates and operational analysis always based on real data and institutional methodology.

How can I use PEGs to trade Forex?Hello everyone,
On May 6, we brought you a technical update on the USD/HKD rate (US dollar VS Hong Kong dollar), as the exchange rate was testing the PEG level of 7.75, defended by the Hong Kong monetary authorities. The PEG therefore provided solid support, and the exchange rate rebounded strongly. It is now under resistance. We'd like to take this opportunity to offer you an educational update on the notion of the PEG in Forex. The link to our May 6 article is just below.
What is a PEG and why use it?
A PEG, or fixed-rate exchange rate regime, consists of a central bank maintaining its currency at a stable value against a foreign currency, often the US dollar or the euro. This system aims to reduce exchange rate volatility, and is advantageous for a country's trade and investment. It promotes economic stability, particularly in countries that are heavily dependent on a stable currency. PEGs survive thanks to the considerable reserves mobilized by monetary authorities to support the target exchange rate. PEGs can thus create technical supports or resistances that can be worth exploiting, but caution is sometimes called for, as history has shown that some central banks can abruptly stop defending a PEG.
1) Interesting PEGs currently in force
Many countries, particularly in the Middle East, Africa and the Caribbean, maintain a fixed rate against the dollar:
Bahrain (BHD), Kuwait (KWD), Oman (OMR), Qatar (QAR), Saudi Arabia (SAR), United Arab Emirates (AED), Panama (PAB). The CFA franc (XOF/XAF), used in 14 African countries, is pegged to the euro at 655.957 CFA per euro.
Some PEGs use a currency board or fluctuation band, such as the Hong Kong dollar (HKD) via a band of 7.75-7.85 HKD per USD. This is the support we shared with you on May 6, and the price rebounded strongly.
The case of the Singapore dollar (the USD/SGD rate) illustrates yet another sophisticated form of intermediate exchange rate regime. Unlike a fixed-rate policy or a free float, the Monetary Authority of Singapore (MAS) steers the value of the SGD through a regime based on a basket of weighted commercial currencies, the exact composition of which remains confidential. This system is based on an unannounced fluctuation band around a central rate, also unpublished.
2) Historical and discontinued PEGs (the landmark episode of the 1.20 PEG on the EUR/CHF rate)
The 1.20 PEG between the euro (EUR) and the Swiss franc (CHF) is one of the most significant episodes in the recent history of European exchange rate policies. Here is a detailed summary of this PEG and its spectacular abandonment in January 2015.
In September 2011, the Swiss National Bank (SNB) set a floor of CHF 1.20 to EUR 1, i.e. a unilateral PEG (not a classic fixed rate, but a floor rate). On January 15, 2015, the SNB abandoned the PEG without notice, citing the growing divergence between the monetary policies of the ECB (falling rates) and the United States. The immediate result: a historic crash on the Forex market.
The EUR/CHF rate dropped instantly from 1.20 to around 0.85-0.90, before stabilizing at around 1.00. The Swiss franc appreciates by almost 30% in a matter of minutes, causing forex intermediaries to go bankrupt, Swiss exporting companies to suffer huge losses and, above all, retail investors who had staked a lot on preserving the CHF 1.15 support level to suffer huge trading losses.
3) The case of the Yuan exchange rate against the US dollar
Another emblematic example is that of China, whose exchange rate regime against the US dollar is not a classic PEG, but a hybrid system often referred to as managed floating. Prior to 2005, the yuan (CNY) was firmly pegged to the dollar at a fixed rate of 8.28, maintained since 1994. In 2005, Beijing decided to make this mechanism more flexible, allowing the yuan to appreciate gradually. However, in the face of the global financial crisis, the People's Bank of China (PBoC) once again froze the rate at around 6.83 until 2010. Since then, the regime has evolved towards a more sophisticated system: every morning, the central bank publishes a USD/CNY reference rate, around which the currency is allowed to fluctuate within a narrow band of plus or minus 2%. This daily fixing is based both on recent market movements and on a basket of strategic currencies. Although this system is not a formal PEG.
DISCLAIMER:
This content is intended for individuals who are familiar with financial markets and instruments and is for information purposes only. The presented idea (including market commentary, market data and observations) is not a work product of any research department of Swissquote or its affiliates. This material is intended to highlight market action and does not constitute investment, legal or tax advice. If you are a retail investor or lack experience in trading complex financial products, it is advisable to seek professional advice from licensed advisor before making any financial decisions.
This content is not intended to manipulate the market or encourage any specific financial behavior.
Swissquote makes no representation or warranty as to the quality, completeness, accuracy, comprehensiveness or non-infringement of such content. The views expressed are those of the consultant and are provided for educational purposes only. Any information provided relating to a product or market should not be construed as recommending an investment strategy or transaction. Past performance is not a guarantee of future results.
Swissquote and its employees and representatives shall in no event be held liable for any damages or losses arising directly or indirectly from decisions made on the basis of this content.
The use of any third-party brands or trademarks is for information only and does not imply endorsement by Swissquote, or that the trademark owner has authorised Swissquote to promote its products or services.
Swissquote is the marketing brand for the activities of Swissquote Bank Ltd (Switzerland) regulated by FINMA, Swissquote Capital Markets Limited regulated by CySEC (Cyprus), Swissquote Bank Europe SA (Luxembourg) regulated by the CSSF, Swissquote Ltd (UK) regulated by the FCA, Swissquote Financial Services (Malta) Ltd regulated by the Malta Financial Services Authority, Swissquote MEA Ltd. (UAE) regulated by the Dubai Financial Services Authority, Swissquote Pte Ltd (Singapore) regulated by the Monetary Authority of Singapore, Swissquote Asia Limited (Hong Kong) licensed by the Hong Kong Securities and Futures Commission (SFC) and Swissquote South Africa (Pty) Ltd supervised by the FSCA.
Products and services of Swissquote are only intended for those permitted to receive them under local law.
All investments carry a degree of risk. The risk of loss in trading or holding financial instruments can be substantial. The value of financial instruments, including but not limited to stocks, bonds, cryptocurrencies, and other assets, can fluctuate both upwards and downwards. There is a significant risk of financial loss when buying, selling, holding, staking, or investing in these instruments. SQBE makes no recommendations regarding any specific investment, transaction, or the use of any particular investment strategy.
CFDs are complex instruments and come with a high risk of losing money rapidly due to leverage. The vast majority of retail client accounts suffer capital losses when trading in CFDs. You should consider whether you understand how CFDs work and whether you can afford to take the high risk of losing your money.
Digital Assets are unregulated in most countries and consumer protection rules may not apply. As highly volatile speculative investments, Digital Assets are not suitable for investors without a high-risk tolerance. Make sure you understand each Digital Asset before you trade.
Cryptocurrencies are not considered legal tender in some jurisdictions and are subject to regulatory uncertainties.
The use of Internet-based systems can involve high risks, including, but not limited to, fraud, cyber-attacks, network and communication failures, as well as identity theft and phishing attacks related to crypto-assets.

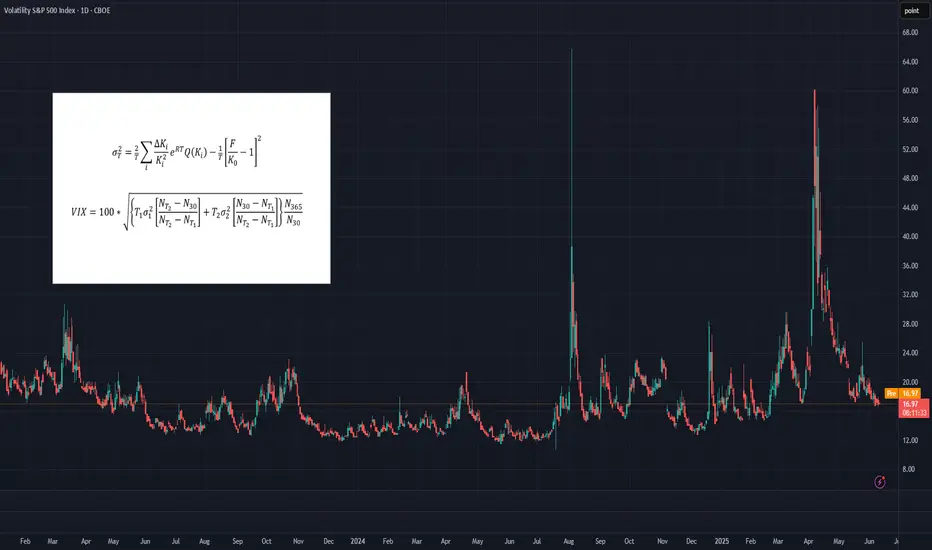
Trading the VIXOften dubbed the "fear index," the VIX gauges SPX options' implied volatility, typically rising during equity market declines and vice versa. It quantifies investor anxiety, demand for hedging, and market stress, crucial for traders and risk managers seeking to measure turbulence.
The VIX calculates a constant 30-day implied volatility using SPX options expiring over the next two months. Unlike simple weighted averages of equity indices, its methodology is more complex, involving implied variance calculation for the two nearest monthly expirations across all strikes. For detailed formulas, refer to the introductory chart or visit the CBOE’s official VIX Index page.
While the VIX Index itself isn’t tradable, exposure can be gained through VIX futures or exchange-traded products (ETPs) like VXX, UVXY, and SVXY. However, these instruments come with their own unique risks, pricing behaviors, and structural nuances, which can make directional VIX trading considerably more complex than it might initially appear.
What You Need to Know About Implied Volatilities
• In calm or uptrending markets, the volatility curve typically slopes upward (contango), indicating higher implied volatility with longer maturities.
• In declining or turbulent markets, the curve can invert, sloping downward (backwardation), as shorter-term implied volatilities rise sharply.
• This pattern can be observed, comparing VIX9D, VIX, and VIX3M against the SPX. In stable markets: VIX9D < VIX < VIX3M. In stressed markets, this relationship may reverse. The VIX9D and VIX3M are the 9-day respectively 3-month equivalent to the 30-day VIX.
What You Need to Know About VIX Futures
• When the volatility spot curve is in contango, the VIX futures curve will also slope upward.
• In backwardation, the futures curve slopes downward, reflecting heightened short-term volatility and short-term volatility spikes.
• While in contango, VIX futures "roll down the curve," meaning that—independent of changes in volatility—futures tend to decline in value over time.
• In backwardation, the opposite occurs: futures "roll up the curve," potentially rising in value over time even without volatility changes.
• VIX futures’ responsiveness to VIX Index movements – the beta of VIX futures against the VIX index - declines with longer expirations; front-month futures may react to 70-80% of VIX changes, compared to 40-60% for third or fourth-month futures.
Key Consequences for Traders
• Directional trading of VIX futures can be strongly influenced by the shape of the futures curve.
• Contango in low-VIX environments creates strong headwinds for long VIX futures positions, caused by the “roll-down-effect”.
• Conversely, backwardation in high-VIX environments creates headwinds for short positions.
• These effects are more pronounced in front-month contracts, making timing (entry and exit) for directional trades critical.
• There's a trade-off in directional strategies: front-month futures offer greater exposure to VIX movements but suffer more from negative roll effects.
How to Trade VIX Futures
• Due to these structural challenges, directional VIX futures trading is difficult and requires precision.
• A more effective approach is to trade changes in the shape of the futures curve using calendar spreads (e.g., long VX1, short VX2). This reduces the impact of roll effects on individual contracts.
• In low-VIX, contango conditions, a rising VIX typically leads to VX1 increasing faster than VX2, widening the VX1–VX2 spread—an opportunity for spread trading.
• While VX1 may initially suffer more from roll-down than VX2, this can reverse as the VIX rises and VX1 begins to “roll up,” especially when VIX > VX1 but VX1 < VX2.
• The opposite dynamic applies in high-VIX, backwardation environments.
• More broadly, changes in the shape of the futures curve across the first 6–8 months can be profitably traded using calendar spreads. Roll-effects and the declining beta-curve can also be efficiently traded.
How to capture the Roll-Down-Effect
One of the more popular VIX-trading strategies involves capturing the roll-down effect,, while the curve is in contango. It is a positive carry strategy that is best applied during calm or uptrending market conditions. Here’s a straightforward set of guidelines to implement the Roll-Down-Carry trade:
• Entry Condition: Initiate during calm market conditions, ideally when VIX9D-index is below VIX-index (though not guaranteed).
• Choosing Futures: Use VX1 and VX2 for calendar spreads if VX1 has more than 8-10 trading days left; otherwise, consider VX2 and VX3.
• Spread Analysis: Short VX1 and long VX2 if VX1–VIX spread is larger than VX2–VX1; otherwise, VX2 and VX3 may be suitable.
• Contango Effect: VX1’s roll-down effect typically outweighs VX2’s during contango.
• Relative Beta: VX1 shows higher reactivity to VIX changes compared to VX2, mimicking a slight short position on VIX.
• Exit Strategy: Use spread values, take-profit (TP), and stop-loss (SL); consider exiting if VIX9D crosses over VIX.
________________________________________
Conclusion
Directional trading of the VIX Index—typically through futures—demands precise timing and a good understanding of the volatility curve. This is because curve dynamics such as contango and backwardation can create significant headwinds or tailwinds, often working against a trader’s position regardless of the VIX’s actual movement. As a result, purely directional trades are not only difficult to time but also structurally disadvantaged in many market environments.
A more strategic and sustainable approach is to trade calendar spreads, which involves taking offsetting positions in VIX futures of different maturities. This method helps neutralize the impact of the curve's overall slope and focuses instead on relative changes between expirations. While it doesn’t eliminate all risk, calendar spread trading significantly reduces the drag from roll effects and still offers numerous opportunities to profit from shifts in market sentiment, volatility expectations, and changes in the shape of the futures curve.
What else can be done with VIX instruments
VIX indices across different maturities (VIX9D, VIX, VIX3M), along with VIX futures, offer valuable insights and potential entry signals for trading SPX or SPX options. In Part 2 of the Trading the VIX series, we’ll explore how to use these tools—along with VIX-based ETPs—for structured trading strategies.
How to Calculate Forex Lot Size on TradingView. Free Calculator
Do you know that TradingView has a built-in Forex position size calculator?
It is completely free, it is simple to use, and it does not require a paid subscription to use it.
In this article, I will teach you how to calculate a lot size for your trades on TradingView easily in 3 simple steps.
Step 1 - Setting Up the Calculator
First, open a price chart on TradingView and find a "Trading Panel" button in the bottom of the window.
Click "Maximize Panel" afterward.
In the list of brokers, select " TradingView Paper Trading" and click "Connect".
Paper Trading is built in demo trading account on TradingView.
It does not require KYC or any other verification.
Choose "Account" list box and tap "Create Account" .
Then fill all the inputs with exactly the same parameters as your real trading account has.
Type in your exact account size, leverage and commission rate.
Then click "Create".
TradingView position size calculator is ready to use.
Step 2 - Find the Trading Opportunity
Find a trading setup to trade. Make sure that you know the exact entry level and stop loss.
Imagine that you want to buy EURUSD from 1.0899 price level with 1.08846 stop loss level.
Step 3 - Measure a Proper Lot Size
Right-click on a price chart and choose "Trade" and in the appeared menu select "Create New Order".
Fill the following fields:
"Price" - your entry level,
"% risk" - your desired risk per trade in %,
"Stop Loss price" - your stop loss price level.
Your lot size will be based on the calculated units .
In forex trading 1 standard lot equals 100000 units.
The only thing that you should do is to take the exact units number and divide it by 100000.
In our case we have 704225 units.
704225 / 100000 = 7,04 lot.
That will be your lot size for buying EURUSD with 1% risk for 100000 trading account.
If you apply TradingView for market analysis and charting and your trading terminal does not have a lot size calculator, this method will be the quickest and the easiest to apply for measuring the position size.
❤️Please, support my work with like, thank you!❤️
I am part of Trade Nation's Influencer program and receive a monthly fee for using their TradingView charts in my analysis.

Mastering Liquidity Dynamics: Understand the Dynamic True ValueDear Reader,
Thank you for reading—your time is valuable.
Use the chart's zoom-in/out (-/+) function for better visibility. This chart captures a large sample for your evaluation.
Below is the manual detailing the Smart Farmer System —a Dynamic True Value framework derived from real-time data to anticipate market intent and liquidity behavior .
If this resonates with you, drop a comment below— constructive insights are always welcome .
The Dynamic True Value - a Smart Farmer System: Terminology and Mechanics
: For now, I have firmed up POC - Price of Control, VAP - Value Average Pricing, SULB - Sell Upper Limit Bound, BLLB - Buy Lower Limit Bound.
Mechanic:
POC - Where fair value price dynamic is read.
VAP - Trading above indicates bullish sentiment of the cycle, and the opposite for bearish sentiment.
A crossed over of:
Grey POC above Green VAP - Signaling distribution, accumulation, consolidation, build-ups, correction, retracement .
Green VAP above Grey POC - Bullish strength and momentum consistency .
Pink VAP above Black POC - Bearish strength and momentum consistency .
Flip of Pink VAP to Green VAP - Sentiment flips from bear to bull, and the same goes for green flip to pink showing bull to bear.
Validation of entry signals requires:
Signal's candle must close past the opposite side of POC – flip sentiment .
The confirmation candle (is the closed next candle immediately after entry signal candle) must continue closed past the POC – maintain sentiment .
The progress candle (is the next candle closed right after the Confirmation Candle) shows traction, momentum build-up, and volume consistency .
Hint of invalidation:
Signal's candle is considered void if the next candle prints a new entry signal in the opposite direction. This often signals accumulation, sideways movement, build-up, uncertainty, or swings in range .
The immediate next candle closed past POC to the opposite side.
What to understand about Liquidity Trap, SULB, and BLLB:
Liquidity traps
Often occur at the recent/previous flatlines of Dynamic True Value (POC, VAP, SULB, BLLB) .
It is worth paying attention to the market’s intent and institutional positioning.
Signs of exhaustion, absorption, inducement, offloading, and accumulation are visible in the M1 (one-minute) TF, with significant confluence near the previous/recent flatlines of Dynamic True Value in the higher/macro-TFs.
An Anchored VWAP tool can be helpful for filtering noise in the market. This tool can be found in the drawing tab in the TradingView platform.
SULB
Details the dynamic of upper resistance where Bears remain in control below the dynamic level.
Below this limit bound (LB) , bears show strength – bear sentiment .
A converging price toward this LB indicates bulls are present.
Moving past this LB (a candle closed above) and successfully RETESTING newly formed support indicates a confirmed directional shift . Followed by printing a new BLLB in the next following candles with price continuing to rise above this failed SULB.
A rejection below LB (a rejection/exhausted candle closed below LB) and successful RETEST reaffirms the resistance holds , indicating downside continuation .
BLLB
Details the dynamic of lower support where Bulls remain in control above the dynamic level.
Above this LB, bulls show strength – bull sentiment .
A converging price toward this LB signifies bears are present.
Moving past this LB (a candle closed below) and successfully RETESTING newly formed resistance indicates a confirmed directional shift . Followed by printing a new SULB in the next following candles with price continuing to push lower below this failed BLLB.
A rejection above LB (a rejection/exhausted candle closed above LB) and successful RETEST reaffirms the support holds , indicating upward continuation .
Important Notes:
Select preferred Entry’s Signal TF (ex. M3 TF, M5 TF for scalping strategy, M15 for intraday/daily strategy, 4H TF for day-to-weekly strategy, etc.).
Always refer to the selected Entry’s TF for trading progress. Anticipate TP and SL by watching the range in this TF.
Non-entry TFs are not for entry purposes. These multi-TFs are used for measuring strength, momentum, liquidity, positioning, structure – The market intends . The Non-entry TF is used to anticipate institutional executions and liquidity pools.
These criteria MUST BE MET. A failed criterion suggests vague execution. Be patient and wait for clear validations.
Institutions excel in creating illusions.
SFS is designed to stand ready, calm, and execute with Clarity.
SFS cuts through noise, distraction, and stays independent of NEWS, GEOPOLITIC, RUMORS, and herd mentality because all these are designed to mislead retail traders into institutional traps.
When we see such ambiguity against the criteria, we know not to fall into the TRAP and become the liquidity FUEL.
Stay sharp, only respond when signals are firmed. SFS is designed to counter Smart Money capitalism. It is about time to level the playing field.

Differences Between Trading Stock Market and Coin Market
Hello, traders.
If you "Follow", you can always get new information quickly.
Have a nice day today.
-------------------------------------
Please read with a light heart.
-
Trading stock market and coin market seem similar, but they are very different.
In stock market, you have to buy and sell 1 share at a time, but in coin market, you can buy and sell in decimals.
This difference makes a big difference in buying and selling.
In the stock market, you should buy when the price is rising from a low price if possible.
The reason is that since you buy in units of 1 week, you have to invest more money when you sell and then buy to buy 1 week.
I think the same goes for the coin market, but since you can buy in decimal units, you have the advantage of being able to buy at a higher price than when you buy in the stock market.
For example, if you sell and then buy again at the same price, the number of coins (tokens) will decrease, but there will be no cases where you can't buy at all.
Therefore, the coin market is an investment market where you can trade at virtually any price range.
-
In terms of profit realization, the stock market can only be traded in a way that earns cash profits.
The reason is that, as I mentioned earlier, since you have to trade in units of 1 week, there are restrictions on trading.
However, in the coin market, in addition to the method of earning cash profits, you can also increase the number of coins (tokens) corresponding to the profits.
The biggest advantage of increasing the number of coins (tokens) corresponding to profit is that you can get a large profit in the long term, and the burden of the average purchase price when conducting a transaction is reduced.
When the price rises by purchase price, if you sell the purchase amount (+ including the transaction fee), the coins (tokens) corresponding to profit will remain.
Since these coins (tokens) have an average purchase price of 0, they always correspond to profit even if there is volatility.
In addition, even if the price falls and you buy again, the average purchase price is set low, so it plays a good role in finding the right time to buy and starting a transaction.
Of course, when the number of coins (tokens) corresponding to profit is small, it does not have a big effect on the average purchase price, but as the number increases, you will realize its true value.
You can also get some cash when you increase the number of coins (tokens) corresponding to profit.
When selling, if you add up the purchase price + transaction fee X 2~3, you can also get some cash profit.
If you get cash profit, the number of coins (tokens) remaining will decrease, so you can adjust it well according to the situation.
When the profit is large, increase the cash profit slightly, and when you think the profit is small, decrease the cash profit.
-
Therefore, when you first move from the stock market to the coin market and start trading, you will experience that the trading is not going well for some reason.
In the stock market, there are some restrictions on the rise and fall, but in the coin market, there are no restrictions, so it is not easy to respond.
However, as I mentioned earlier, the biggest problem is the difference in the transaction unit.
When trading in the stock market, you need to check various announcements and issues in addition to the chart and determine how this information affects the stock or theme you want to trade.
This is because trading is not conducted 24 hours a day, 365 days a year like the coin market.
This is because if an announcement or issue occurs during a non-trading period, the stock market may rise or fall significantly when trading begins.
-
When using my chart on a stock chart, the basic trading strategy is to buy near the HA-Low indicator and sell near the HA-High indicator.
However, if you want to buy more, you can buy more when the M-Signal of the 1D chart > M-Signal of the 1W chart, and it shows support near the M-Signal indicator of the 1W chart.
In the stock chart, it is recommended to trade when the M-Signal indicators of the 1D, 1W, and 1M charts are aligned.
The reason is that, as I mentioned earlier, trading must be done in 1-week units, so the timing of the purchase is important.
In the coin chart, you can actually trade when it shows support at the support and resistance points.
However, since trading is possible 24 hours a day, 365 days a year, even if it shows support at the support and resistance points, psychological anxiety due to volatility increases, so it is recommended to proceed with trading according to the basic trading strategy.
The creation of the HA-Low indicator means that it has risen from the low range, and the creation of the HA-High indicator means that it has fallen from the high range.
Therefore, if it shows support near the HA-Low indicator, it is likely to rise, and if it shows resistance near the HA-High indicator, it is likely to fall.
However, on the contrary, if it is supported and rises at the HA-High indicator, it is likely to show a stepwise rise, and if it is resisted and falls at the HA-Low indicator, it is likely to show a stepwise fall.
In order to confirm this movement, you need to invest a lot of time and check the situation in real time.
-
Thank you for reading to the end.
I hope you have a successful transaction.
--------------------------------------------------

Latest Published Ideas by UsersThis is not a trading idea, but some form of representing my desire, about to see again on TradingView, the great function that can help and improve the vision and knowledge about the current situation on the market, so effectively.
If you an individual user, member, and friend of TradingView, like this idea,
Click Boost Symbol!
Thank you! Have a great day.

NO TRADE? THAT IS THE TRADEToday, I took no trades and I’ll be honest, it was really tempting to break that discipline.
I stared at the chart longer than I needed to. My cursor hovered around the Buy and Sell buttons. My brain tried to convince me that “maybe” this candle meant something. Even though there was no valid sweep, no BOS, and no clean entry into an FVG , the desire to just “be in a trade” was strong.
But I reminded myself:
📌 No Setup = No Trade
📌 Your edge is your lifeline
📌 Discipline is what pays you, not activity
What I felt today is something every trader battles, setup hoping . It’s that mental trap where silence feels wrong, and boredom feels dangerous. But the truth is, boredom is part of being a consistently profitable trader. There are days where your best trade is the one you don’t take.
And I’m proud to say I did nothing.
No revenge trade.
No gambling.
No deviation from plan.
Instead, I observed. I journaled my emotions. I stayed in control. That’s the work behind the scenes: the mental reps that build longevity in this business .
So if you had a quiet session today too, and you resisted the urge to jump in without reason, celebrate that. You're training your mind to trust your system, not your feelings.
Sometimes, the most powerful trade you’ll ever take… is the one you never place.

Everything Looks Fine Until You're Liquidated Ever felt like the market is calm and steady, then boom — everything crashes?
Everything seems fine … until one liquidation candle slaps you awake.
This analysis explores how the illusion of safety can destroy your capital — and how to use TradingView tools to stay ahead.
Hello✌
Spend 3 minutes ⏰ reading this educational material.
🎯 Analytical Insight on Dogecoin:
If Dogecoin fails to gain at least 30% in the next two weeks—while Bitcoin continues to rally—this divergence could signal a broader market weakness. When BTC outperforms and altcoins lag, it often reflects declining risk appetite and potential capital rotation out of speculative assets. A move toward the $0.25 target is key for confirming bullish continuation across the altcoin sector. 📉
Now , let's dive into the educational section,
🧠 The Illusion of Safety: Silent Capital Killers
The biggest risk in trading is when things “seem fine.” A quiet chart is often the calm before the liquidation storm. Don't get cozy.
📍 TradingView Tools That Could Save You 🛠️
When the market feels safe, that’s exactly when danger starts brewing.
This is where TradingView’s tools come into play as your best defense.
First up: Volume Profile V isible Range. It reveals exactly where big players entered and where liquidity is building up.
Right near these zones, you’ll often find fake breakouts and whale traps.
Next: Fixed Range Volume Profile — great for identifying volume clusters within specific price ranges. If volatility shrinks while nearing a high-volume zone, get ready: a shakeout may be coming.
Don't just use price alerts. Go deeper — set alerts for EMA crossovers, sudden RSI shifts, or breaks through low-volume areas . That’s where silent moves become violent moves.
One underrated gem: Long/Short Position Tool . Use it to simulate your liquidation points before you open a trade. It’s like pre-visualizing your own death — so you can avoid it.
These tools aren’t just fancy widgets. They’re how you read the silent signals of the market before it slaps.
🐍 Whales Hunt Your Comfort Zone
The market doesn’t wait for you to be ready. Whales wait until you feel safe. Then they hit, wiping retail traders to create room for entry.
🚩 Trades Without a Plan Are Liquidation Invitations
Opening a position without mapping your liquidation zone? That’s like flying blind into a hurricane. Always have Plan A — and a backup Plan B.
🔍 Quiet Crashes Begin With Fake Breakouts
The market won’t warn you. It teases with one green candle, maybe a soft pump... and then drops like a rock. That’s the trick.
🧮 Moving Averages: When Smooth Means Scary
When EMA 21 and 55 flatten out too much, it’s not peace — it’s buildup. Flat EMAs = warning. Don’t be fooled by “smooth” charts.
⚠️ Liquidation Data = Psychological Red Flag
Liquidation spikes on sites like Coinglass aren’t just stats — they’re signs of herd slaughter. Use them as sentiment analysis. It's not just what got liquidated — it's who and why.
🧪 Post-Liquidation Analysis: Recovery or Spiral?
After liquidation, many rush to “make it back.” That's when more destruction happens. You need a post-liquidation plan, not just a pre-trade strategy.
🔐 The Best Trades Are Sometimes Early Exits
Exiting a trade that looks “fine” is a pro move. When everything feels stable, the market may be prepping to flip the table.
🧊 Cold-Minded Trading Saves Accounts
Pros stay ready during calm markets. Amateurs dive in when it’s “finally safe.” That mindset difference defines survival.
🧭 Final Takeaway
If there’s one thing to remember from this analysis, it’s this:
Never trust the market. Trust your tools. Trust your strategy.
The market is never safe — it only pretends to be.
✨ Need a little love!
We put so much love and time into bringing you useful content & your support truly keeps us going. don’t be shy—drop a comment below. We’d love to hear from you! 💛
Big thanks,
Mad Whale 🐋
📜Please remember to do your own research before making any investment decisions. Also, don’t forget to check the disclaimer at the bottom of each post for more details.

#AN005 What Changes After USA-China, ECB and Oil
Hello, I'm Andrea Russo, forex trader and creator of the SwipeUP Elite FX Method, which analyzes the market as a Hedge Found. Today I want to talk to you about the latest crucial economic news of the week that will influence the currency markets.
Let's start with the important trade meeting between the United States and China that took place in London. The negotiations, mainly focused on exports and rare earth metals, showed positive signs with optimistic statements from both sides. This event immediately brought an improvement in global sentiment, strengthening trade-sensitive currencies such as the Australian dollar (AUD) and the New Zealand dollar (NZD), while the US dollar recorded a slight decline.
The World Bank, on the other hand, tagged its 2025 global growth forecast from 2.8% to 2.3%. This downgrade reflects significant concerns for the United States, China and Europe, due to trade uncertainties and reduced investments. This scenario, however, could favor some emerging currencies, such as the Brazilian real (BRL) and the Mexican peso (MXN), which benefit from less restrictive monetary policies and a reduction in pressure on the US dollar.
Looking at Europe, the European Central Bank (ECB) has decided to further reduce rates, bringing them to 2%, with the possibility of further decreases of up to -0.25% by the autumn. This expansionary policy is dictated by the need to support a stagnant economy and contain inflation. Inevitably, this will put pressure on the euro (EUR), which is expected to weaken against major currencies, especially the dollar.
In the United States, on the other hand, all eyes are on the May CPI due on June 11. Inflation is expected to be 2.5%, and the publication of data that is above or below expectations could generate strong volatility on the dollar. A higher CPI would strengthen the dollar, reducing the likelihood of a rate cut by the Federal Reserve, while a lower reading could further weaken the greenback.
Finally, oil has also rallied, with WTI up 6% and Brent up 4%. This increase has been driven by a more favorable geopolitical context and the reduction of trade tensions. The effect on currency markets is direct, favoring commodity-related currencies, such as the Canadian dollar (CAD) and the Norwegian krone (NOK), while currencies such as the euro (EUR) and the Japanese yen (JPY), of oil-importing countries, could find themselves in difficulty.
In summary, the current week is proving to be crucial for Forex: declining trade tensions are supporting trade-related currencies, the ECB's accommodative monetary policy is weakening the euro, while US economic data will drive sentiment on the dollar.
To stay updated on future developments, continue to follow my analyses and articles here on TradingView.

are you the Messi or Ronaldo of trading“In football, some say Messi was born with it, and Ronaldo built it. In trading, the same debate lives on—are the best naturally gifted, or relentlessly crafted?”
The Messi vs Ronaldo debate is more than just about football. It’s a lens into how we perceive greatness:
Messi, the effortless genius, gliding past defenders like he was born with a ball at his feet.
Ronaldo, the relentless machine, forged through discipline, self-belief, and sheer work ethic.
Both legends. Both dominant. But two very different paths to mastery.
And that same question echoes loudly in the world of trading:
Are great traders born with a gift—or made through grind, loss, and experience?
The “Natural” Trader : Messi
There’s a romantic idea that some traders just have it:
They “see” the market differently.
They time entries perfectly.
They stay calm in chaos.
But what we often overlook is that this perceived instinct is usually refined intuition, earned through thousands of chart hours, hard-won lessons, and deep emotional work.
Just like Messi has trained for decades—even the gifted must still grow.
The Ronaldo Blueprint: Greatness Is Built
Cristiano Ronaldo is often cited as the perfect example of what's possible through obsession, sacrifice, and discipline. Every goal, every leap, every sprint—is a result of work. And in trading, that blueprint is more common than you think.
Here’s how great traders are built:
Through structured process. Clear rules, risk protocols, and systems that remove emotion.
Through deep reflection. Journaling trades, studying behavior patterns, reviewing psychology—not just price.
Through emotional mastery. Remaining centered during drawdowns and not getting high off wins.
Through resilience. Getting back up after losses, blown accounts, bad calls, and still showing up.
This is the Ronaldo of trading. And it’s replicable—if you’re willing to put in the reps.
Talent Helps—but It’s Never Enough
Yes, some traders may be “wired” with certain advantages:
Pattern recognition, mathematical intuition, calm under pressure. But just like talent in sports, without discipline, it fades. Without consistency, it cracks.
In truth, most consistently profitable traders you’ll meet are not the flashiest or most “gifted.”
They’re the most adaptable, the most disciplined, and the most reflective.
So… Which One Are You?
It doesn’t matter. Because the bigger question is:
Are you willing to grow into the trader you want to become?
Great traders are not born or made.
They are choosing to evolve—every day.
They put ego aside and put in the work.
They trade with intention, not impulse.
Nerd Tip:
You might start your journey as a “Messi” or a “Ronaldo,” but in the markets, the path is yours to shape.
The charts don’t care where you begin—they respond only to how you show up.
So whether you’re gifted or grinding—
Keep sharpening the edge. Keep showing up.
Because in this game, consistency beats brilliance.
Stay disciplined. Stay dangerous.
put together by : Pako Phutietsile as @currencynerd

Guide: How to Read the Smart Farmer SystemDear Reader , Thank you for tuning in to my first video publication.
This video explains the 3-step signal validation process—helping you quickly and precisely anticipate market intent and liquidity dynamics before taking action.
We do not react to noise; we respond with structured execution because we understand the market’s true game.
Listen to the market— this guide is here to sharpen your journey.
Correction Notice (16:58 timestamp): A slight clarification on the statement regarding signal validation :
SELL signals: The trading price must close BELOW the Price of Control (POC) and Value Average Pricing (VAP) without invalidation occurring in both the confirmation candle and progress candle.
BUY signals: The trading price must close ABOVE the Price of Control (POC) and Value Average Pricing (VAP) without invalidation occurring in both the confirmation candle and progress candle.
Multiple signals indicate liquidity games are actively unfolding, including accumulation, control, distribution, and offloading.

Position Sizing 101: How Not to Blow Up Your Account OvernightWelcome to the trading equivalent of wearing a seatbelt. Not really exciting but entirely recommended for its lifesaving properties. When the market crashes into your stop-loss at 3:47 a.m., you’ll wish you’d taken this lesson seriously.
Let’s talk position sizing — the least flashy but most essential tool in your trading kit. This is your friendly reminder that no matter how perfect your chart setup looks, if you’re risking 50% of your capital on a single trade, you’re not trading. You’re gambling. And also — if you lose 50% of your account, you have to gain 100% to get even.
✋ “Sir, This Isn’t a Casino”
Let’s start with a story.
New trader. Fresh demo account turned real. He sees a clean breakout. He YOLOs half his account into Tesla ( TSLA ). "This is it," he thinks, "the trade that changes everything."
News flash: it did change everything — his $10,000 account turned into $2,147 in 48 hours.
The lesson? Position sizing isn’t just about managing capital. It’s about managing ego. Because the market doesn’t care how convinced you are.
🌊 Risk of Ruin: The More You Know
There’s a lovely concept in trading called “risk of ruin.” Sounds dramatic — and it is. It refers to the likelihood of your account going to zero if you keep trading the way you do.
If you risk 10% of your account on every trade, you only need to be wrong a few times in a row to go from “pro trader” to “Hey, ChatGPT, is trading a scam?”
Risking 1–2% per trade, however? Now we’re talking sustainability. Now you can be wrong ten times in a row and still live to click another chart.
🎯 The Math That Saves You
Let’s illustrate the equation:
Position size = Account size × % risk / (Entry – Stop Loss)
Example: $10,000 account, risking 1%, with a 50-point stop loss on a futures trade.
$10,000 × 0.01 = $100
$100 / 50 = 2 contracts
That’s it. No Fibonacci razzle-dazzle or astrology needed. Just basic arithmetic and a willingness to not be a hero.
🤔 The Myth of Conviction
Every trader has a moment where they say: “I know this is going to work.”
Spoiler alert: You don’t. And the moment you convince yourself otherwise, you start increasing position size based on emotion, not logic. That’s where accounts go to die.
Even the greats keep it tight. Paul Tudor Jones, the legend himself, once said: “Don't focus on making money; focus on protecting what you have.” Translation: size down, cowboy.
🔔 Position Size ≠ Trade Size
A common mistake: confusing position size with trade size.
Trade size is how big your order is. Position size is how much of your total capital is being risked. You could be trading 10 lots — but if your stop loss is tight, your position size might still be conservative.
So yes, trade big. But only if your risk is small. You’ll do better at this once you figure out how asymmetric risk reward works.
🌦️ Losses Happen. Don’t Let Them Compound
Let’s say you lose 5% on a trade. No big deal, right? Until you try to “make it back” by doubling down on the next one. And then again. And suddenly, you’re caught in a death spiral of revenge trading .
This is not theoretical. It’s Tuesday morning for many traders.
Proper position sizing cushions the blow. It turns what would be a catastrophe into a lesson — maybe even a mildly annoying Tuesday.
🌳 It’s Not Just About Risk — It’s About Freedom
Smart sizing gives you flexibility (and a good night’s sleep).
Want to hold through some noise? You can. Want to scale in? You’re allowed. Want to sleep at night without hugging your laptop? Welcome to emotional freedom.
Jesse Livermore, arguably the most successful trader of all time, said it best: “If you can’t sleep at night because of your stock market position, then you have gone too far. If this is the case, then sell your position down to the sleeping level.”
⛳ What the Pros Actually Do
Here’s a dirty little secret: pros rarely go all-in without handling the risk part first (that is, calibrating the position size).
If they’re not allocating small portions of capital across uncorrelated trades, they’ll go big on a trade that has an insanely-well controlled risk level. That way, if the trade turns against them, they’ll only lose what they can afford to lose and stay in the game.
Another great one, Stanley Druckenmiller, who operated one of the best-returning hedge funds (now a family office) said: “I believe the best way to manage risk is to be bullish when you have a compelling risk/reward.”
🏖️ The Summer of FOMO
Let’s address the seasonal vibes.
Summer’s here. Volume’s thin. Liquidity’s weird. Breakouts don’t follow through. Every false move looks like the real deal until it isn’t. And every poolside Instagram story from your trader friend makes you want to hit that buy button harder.
This is where position sizing saves you from yourself. Small trades, wide stops, chill mindset. Or big trades, tight stops, a bit of excitement in your day.
No matter what you choose, make sure to get your dose of daily news every morning, keep your eye on the economic calendar , and stay sharp on any upcoming earnings reports (GameStop NYSE:GME is right around the corner, delivering Tuesday).
☝️ Final Thoughts: The Indicator You Control
In a world of lagging indicators, misleading news headlines, and “experts” selling you dreams, position sizing is one of the few things you have total control over.
And that makes it powerful.
So next time you feel the rush — the urge to go big — take a breath. Remember the math. Remember the odds. And remember: the fastest way to blow up isn’t a bad trade — it’s a good trade sized wrong.
Off to you: How are you handling your trading positions? Are you the type to go all-in and then think about the downside? Or you’re the one to think about the risk first and then the reward? Let us know in the comments!

AMP Futures - Order types, and how to place a stop on the DOM.In this idea we will cover the different order types you can use in Tradingview, also explaining the placement of the different order types, and how to place a stop order on the DOM.
